
For nearly two thousand years, the average height of men in Europe remained remarkably stable.
According to skeletal remains analyzed by Richard Steckel, male height hovered around 170 centimeters from the Roman era through the Middle Ages and into the early modern period and today, and female height around 160 centimeters.
This consistency suggests that for centuries, despite fluctuations in wealth, empire, and war, the basic determinants of growth—caloric intake, childhood health, disease exposure—did not significantly improve for most people.
But beginning in the 18th and especially the 19th century, something changed.
The sharp uptick in male height observed in modern nations like Sweden and the United States (based on more reliable data sources such as military records and health surveys) reflects broader societal transformations: advances in public health, the spread of industrial agriculture, declines in childhood infections, and better maternal health.
In the U.S., for example, native-born male height rose steadily to reach over 177 cm by the late 20th century, while Sweden followed a similar upward curve.
Key Takeaways
A 200-Year Trend: How Human Height Has Increased Globally
View this post on Instagram
One of the most striking biological changes in human history has occurred quietly and consistently over the last 200 years: people have grown taller.
The global upward trend in human height is a clear reflection of improvements in nutrition, childhood health, sanitation, and living standards. While height may seem like a static trait, it’s one of the most sensitive indicators of a population’s well-being across generations.
Research by the University of Tübingen, based on work by economic historians Baten and Blum (2014), offers detailed estimates of average male height from 1810 to 1980 in many countries worldwide. In some cases, estimates stretch as far back as 1750.
These figures are based on military conscription records, medical examinations, and historical archives—sources that mainly capture the male population due to the nature of data collection at the time (soldiers, prisoners, slaves, and servants).
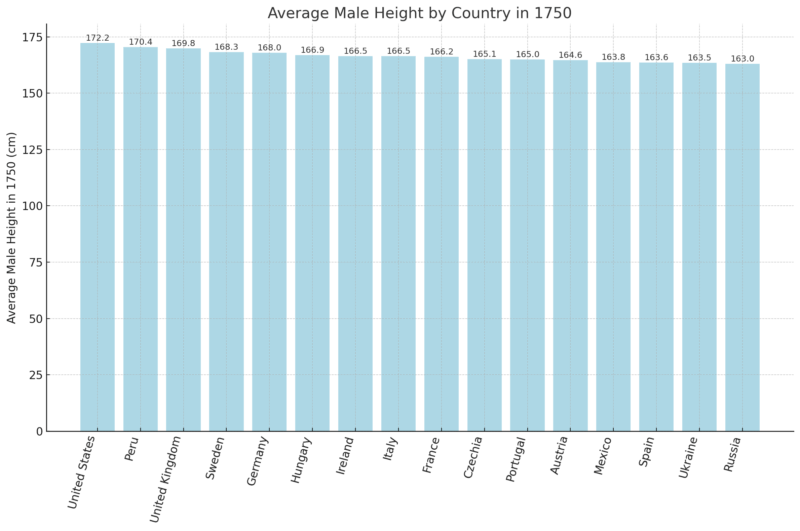
Despite these limitations, the trend is unmistakable: in the mid-18th century, average male height was relatively low across much of Europe and the Americas.
For example, American men were already among the tallest at around 172.2 cm, followed by men from Peru (170.4 cm) and the UK (169.8 cm). In contrast, men from Central and Eastern Europe were significantly shorter—Russia, Austria, and Ukraine all recorded averages below 165 cm.
The table below shows a selection of countries with available data on average male height circa 1750:
What Changed?
Since 1750, average male height in many of these countries has increased by 10 to 20 centimeters or more, especially in wealthier nations. This rapid growth started in the 19th century and accelerated through the 20th century with the introduction of better public health systems, cleaner water, antibiotics, and mass education about hygiene and nutrition.
Countries like the Netherlands—which had no early data but show among the highest modern heights globally today (average male height now exceeds 183 cm)—demonstrate how height can change rapidly when socioeconomic conditions improve.
Meanwhile, countries that faced political instability, poor access to healthcare, or chronic malnutrition saw much slower gains. For instance, data from sub-Saharan Africa and parts of Asia show that average height has increased only modestly—or in some cases, plateaued or declined due to war, famine, or systemic poverty.
How Has Height Changed Around the World?
Across the globe, people today are measurably taller than they were just a century ago.
From Europe to Asia, from North America to Africa, the rise in average height reflects sweeping changes in public health, nutrition, and living conditions. It’s one of the most consistent biological indicators of human progress.
But just how much have we grown? And is this increase the same everywhere?
In 2016, the NCD Risk Factor Collaboration (NCD-RisC) published a massive dataset compiling adult height estimates from across the world. This research analyzed millions of datapoints from health surveys, academic studies, and demographic records to track how average height has changed by birth cohort—that is, by year of birth.
Importantly, this dataset includes only adults aged 18 and older, so it reflects final adult height rather than childhood growth projections.
On average, men and women born in the early 21st century are about 10 centimeters taller than those born in the early 20th century. That’s an increase of roughly 5% in body height, achieved within the span of just four or five generations.
In countries with the most dramatic gains—such as South Korea, Iran, the Netherlands, and parts of Scandinavia—the change is even more striking. For example, South Korean women born in 1996 were nearly 20 cm taller on average than those born in 1896, according to NCD-RisC data.
How Tall Are People Around the World? Global Averages for Height, Weight, and BMI by Country
People from the Netherlands top the global height charts. Dutch men average 1.84 meters tall, while Dutch women are also among the tallest at 1.70 meters. Close behind are countries from the Balkans like Montenegro, Bosnia and Herzegovina, and Serbia, where both men and women boast impressive averages.
At the other end, nations in South Asia and Southeast Asia—such as Bangladesh, India, Cambodia, and Indonesia—tend to have the shortest averages, with male height hovering around 1.65 meters and women often under 1.55 meters.
Meanwhile, the United States lands in the upper-middle range: American men average 1.77 meters, and women 1.63 meters, placing them below Northern and Eastern European nations but above many Asian and Latin American countries.
Country
Male Height
Male Weight
Male BMI
Female Height
Female Weight
Female BMI
Netherlands
1.84 m
87.2 kg
25.9
1.70 m
72.9 kg
25.2
Montenegro
1.83 m
89.4 kg
26.7
1.70 m
73.0 kg
25.4
Estonia
1.82 m
90.9 kg
27.3
1.68 m
74.2 kg
26.2
Denmark
1.82 m
86.1 kg
26.1
1.69 m
70.5 kg
24.7
Bosnia and Herzegovina
1.82 m
89.7 kg
27.2
1.67 m
72.5 kg
26.0
Iceland
1.81 m
89.8 kg
27.3
1.68 m
73.7 kg
26.0
Czechia
1.81 m
91.2 kg
27.9
1.68 m
74.2 kg
26.4
Slovenia
1.81 m
89.9 kg
27.5
1.67 m
70.6 kg
25.3
Slovakia
1.81 m
91.5 kg
28.0
1.67 m
73.0 kg
26.2
Croatia
1.81 m
92.3 kg
28.3
1.67 m
75.3 kg
27.1
Serbia
1.80 m
89.2 kg
27.4
1.68 m
72.3 kg
25.6
Sweden
1.80 m
86.2 kg
26.5
1.67 m
69.9 kg
25.2
Norway
1.80 m
88.1 kg
27.1
1.66 m
71.7 kg
25.9
Lithuania
1.80 m
90.0 kg
27.7
1.67 m
74.2 kg
26.5
Poland
1.80 m
91.6 kg
28.2
1.65 m
72.6 kg
26.5
Ukraine
1.80 m
86.3 kg
26.6
1.66 m
74.3 kg
26.9
Finland
1.80 m
87.3 kg
26.9
1.66 m
72.9 kg
26.4
Latvia
1.80 m
89.2 kg
27.5
1.68 m
74.5 kg
26.4
Germany
1.80 m
87.8 kg
27.1
1.66 m
71.4 kg
25.9
Dominica
1.80 m
81.7 kg
25.3
1.67 m
82.4 kg
29.7
Belgium
1.79 m
84.9 kg
26.5
1.64 m
69.9 kg
26.1
Bermuda
1.79 m
84.9 kg
26.5
1.66 m
80.1 kg
29.2
Greece
1.79 m
89.1 kg
27.9
1.65 m
74.2 kg
27.1
Puerto Rico
1.79 m
91.0 kg
28.5
1.63 m
79.7 kg
30.0
Switzerland
1.79 m
82.9 kg
26.0
1.64 m
64.5 kg
24.0
Australia
1.79 m
89.6 kg
28.1
1.65 m
74.2 kg
27.4
Ireland
1.79 m
88.6 kg
27.8
1.64 m
73.9 kg
27.4
Canada
1.78 m
88.2 kg
27.7
1.65 m
73.2 kg
27.0
Austria
1.78 m
83.9 kg
26.4
1.66 m
68.1 kg
24.6
France
1.78 m
79.2 kg
24.9
1.64 m
65.2 kg
24.1
United States
1.77 m
91.5 kg
29.3
1.63 m
78.9 kg
29.7
United Kingdom
1.78 m
87.4 kg
27.6
1.64 m
73.6 kg
27.4
South Korea
1.75 m
76.5 kg
25.0
1.63 m
61.6 kg
23.3
Japan
1.72 m
70.7 kg
24.0
1.58 m
55.3 kg
22.1
China
1.75 m
75.6 kg
24.8
1.63 m
63.3 kg
23.9
India
1.66 m
63.4 kg
23.1
1.55 m
56.3 kg
23.5
Bangladesh
1.65 m
60.4 kg
22.3
1.52 m
54.4 kg
23.5
Vietnam
1.68 m
63.2 kg
22.4
1.58 m
55.7 kg
22.4
Indonesia
1.66 m
63.6 kg
23.2
1.54 m
59.8 kg
25.2
Mexico
1.70 m
81.1 kg
28.1
1.57 m
72.4 kg
29.2
Brazil
1.75 m
82.5 kg
26.9
1.62 m
72.9 kg
27.8
Argentina
1.74 m
86.2 kg
28.4
1.61 m
73.5 kg
28.4
Egypt
1.73 m
83.1 kg
27.8
1.60 m
80.7 kg
31.5
Turkey
1.76 m
84.3 kg
27.3
1.61 m
76.1 kg
29.2
Iran
1.75 m
79.7 kg
26.1
1.61 m
71.8 kg
27.7
Saudi Arabia
1.70 m
83.0 kg
28.7
1.58 m
74.6 kg
29.8
South Africa
1.69 m
70.5 kg
24.6
1.58 m
74.8 kg
29.8
Nigeria
1.70 m
67.9 kg
23.6
1.58 m
62.2 kg
25.0
Kenya
1.70 m
65.1 kg
22.6
1.59 m
64.0 kg
25.3
Ethiopia
1.68 m
58.2 kg
20.7
1.57 m
53.6 kg
21.8
Ghana
1.69 m
66.9 kg
23.3
1.59 m
65.1 kg
25.9
Algeria
1.74 m
77.3 kg
25.6
1.62 m
73.1 kg
27.9
Morocco
1.75 m
77.1 kg
25.1
1.61 m
71.2 kg
27.6
Tunisia
1.74 m
82.0 kg
27.1
1.62 m
70.3 kg
26.7
Libya
1.77 m
89.3 kg
28.5
1.63 m
78.6 kg
29.6
Sudan
1.71 m
69.3 kg
23.7
1.60 m
65.0 kg
25.5
Somalia
1.70 m
65.0 kg
22.4
1.59 m
65.2 kg
25.7
Zambia
1.73 m
73.1 kg
24.4
1.60 m
66.7 kg
25.9
Zimbabwe
1.70 m
65.7 kg
22.8
1.60 m
65.9 kg
25.9
Botswana
1.74 m
75.6 kg
25.0
1.60 m
69.2 kg
27.0
Namibia
1.72 m
72.2 kg
24.4
1.59 m
67.1 kg
26.6
Lesotho
1.73 m
71.5 kg
23.9
1.59 m
66.4 kg
26.2
Angola
1.68 m
64.7 kg
23.0
1.58 m
61.9 kg
24.9
DR Congo
1.68 m
62.7 kg
22.3
1.56 m
56.9 kg
23.4
Gambia
1.68 m
67.2 kg
23.9
1.61 m
66.2 kg
25.4
Cameroon
1.71 m
70.5 kg
24.1
1.60 m
66.1 kg
25.8
Togo
1.71 m
68.5 kg
23.4
1.60 m
62.3 kg
24.3
Sierra Leone
1.68 m
66.4 kg
23.5
1.58 m
62.7 kg
25.0
Mozambique
1.68 m
60.0 kg
21.3
1.58 m
55.2 kg
22.1
Madagascar
1.65 m
60.6 kg
22.3
1.53 m
51.3 kg
22.0
Central African Republic
1.70 m
65.8 kg
22.8
1.58 m
61.3 kg
24.6
Chad
1.68 m
63.4 kg
22.4
1.58 m
60.0 kg
24.0
Rwanda
1.68 m
60.6 kg
21.5
1.56 m
53.0 kg
21.8
Burundi
1.67 m
63.0 kg
22.7
1.55 m
51.7 kg
21.6
Malawi
1.69 m
65.3 kg
22.9
1.59 m
60.2 kg
23.8
Average Heights and Weights by Continent and Subregion

If you’re wondering how your height or weight compares globally, looking at averages by country helps—but viewing the data by continent and region provides even more context.
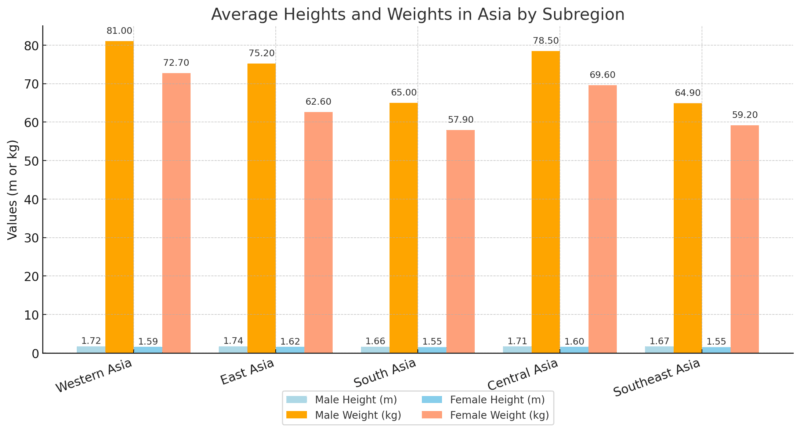
For example, Northern Europeans are typically taller and heavier than their Southern counterparts. Similarly, in Asia, body size varies sharply between South Asia and East Asia.
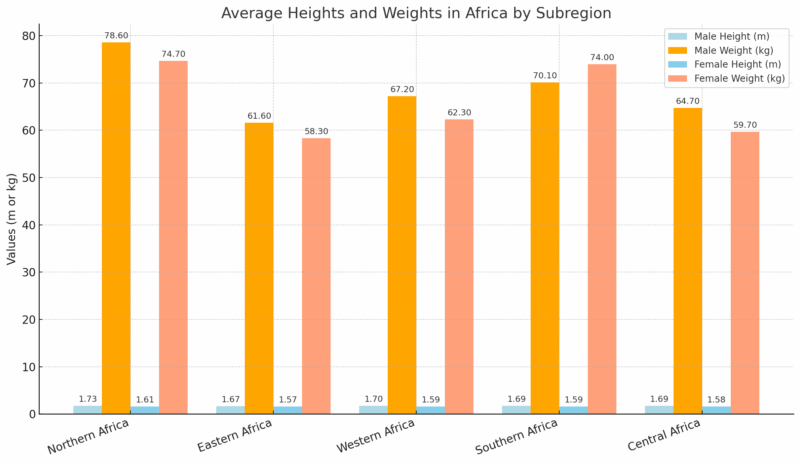
Africa
America
Subregion
Male Height
Male Weight
Female Height
Female Weight
Caribbean
1.74 m
77.3 kg
1.61 m
70.8 kg
North America
1.75 m
88.6 kg
1.62 m
76.8 kg
South America
1.73 m
81.1 kg
1.60 m
71.4 kg
Central America
1.68 m
76.0 kg
1.54 m
67.9 kg
Asia
Europe
Subregion
Male Height
Male Weight
Female Height
Female Weight
Western Europe
1.80 m
84.2 kg
1.66 m
68.8 kg
Southern Europe
1.76 m
82.8 kg
1.62 m
67.6 kg
Northern Europe
1.79 m
87.4 kg
1.65 m
73.0 kg
Eastern Europe
1.78 m
86.4 kg
1.65 m
72.4 kg
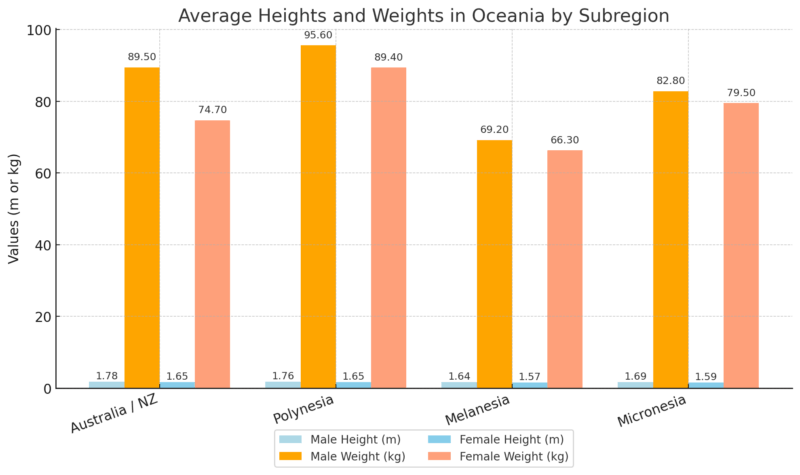
Oceania
Gender Differences in Height: How Much Taller Are Men Than Women?
One of the most consistent biological differences between sexes across the globe is height. No matter the country or region, men are, on average, taller than women, without exception.
The Global Gap: 12 Centimeters on Average
For people born in 1996, global data shows that men are about 12 centimeters (roughly 4.5 inches) taller than women. This difference has remained fairly stable over the decades, even as average heights have increased in both genders.
The difference isn’t just anecdotal—it’s supported by robust international health data and visualized clearly through comparative studies.
For example, when you plot average male height on the vertical axis and female height on the horizontal axis, you’ll find that every country falls above the 45-degree diagonal line—the line where male and female height would be equal.
This means that in every single country, men are taller than women on average. No country deviates from this pattern.
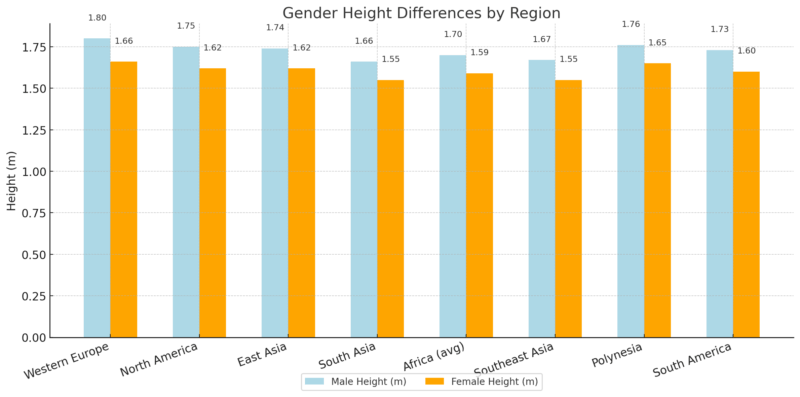
Gender Height Differences by Region
Here’s a quick look at the average male-female height gap in various parts of the world (based on global height data from people born in the 1990s):
Human Height in Prehistoric Times: What Bones Tell Us
@artlust #arthistory #historytiktok #historytok ♬ original sound – Yt @art_lust
Modern societies have seen a significant increase in human height over the past 150–200 years. But what about before the industrial era? How tall were people in prehistoric times, and in traditional societies that continued subsistence lifestyles into the 20th century?
Archaeological evidence from skeletons, combined with ethnographic studies of foragers and subsistence groups, reveals a surprising insight: human height remained relatively stable for millennia. For thousands of years, people were roughly the same height, with little long-term upward trend—despite occasional regional and temporal variations.
This stagnation aligns with the Malthusian theory, which argues that population growth in preindustrial economies often consumed any surplus resources, preventing sustained improvements in living conditions.
Heights in Modern Foraging and Subsistence Societies
Even in the 19th and 20th centuries, many groups around the world still lived in traditional or semi-nomadic ways. Studies of these populations—based on direct measurements—show that their average adult male height was often in the range of 155–172 cm.
Year
Group
Region
Age Range
Avg. Male Height
1892
Plains Indians
United States
23–49
172 cm
1970s
Anbarra
Australia
Adults
172 cm*
1970s
Rembarranga
Australia
Adults
171 cm*
1910
Alaskan Inuit
United States
Adults
170 cm*
1890
Northern Pacific Indians
United States
Adults
167 cm*
1944
Sandawe
Tanzania
Adults
167 cm*
1891
Shoshone
United States
20–59
166 cm
1970s
Fox Basin Inuit
Canada
Adults
166 cm*
1880s
Solomon Islanders
Solomon Islands
Adults
165 cm*
1906
Canadian Inuits
Canada
Adults
164 cm*
1969
!Kung
Botswana
21–40
163 cm
1980s
Ache
Paraguay
Adults
163 cm*
1970s
Hadza
Tanzania
Adults
163 cm*
1985
Hiwi
Venezuela
Adults
156 cm*
1980s
Batak
Philippines
Adults
155 cm*
1980s
Agta
Philippines
Adults
155 cm*
1980s
Aka
Central African Republic
Adults
155 cm*
Asterisk () indicates data from field studies without exact age breakdowns. These societies often lived without modern healthcare or industrial food systems, providing a unique lens into premodern human biology.*
Skeletal Remains: Human Height Over 10,000 Years
When we look at skeletal records dating back to the Mesolithic (about 10,000 years ago), we see that average height was surprisingly close to that of some modern populations.
But importantly, there was no clear upward trend—only slight fluctuations depending on diet, disease, and population density.
Period
Region
Sample Size
Avg. Male Height
Mesolithic (8000 BC)
Europe
82
168 cm
Neolithic (5000–3000 BC)
Europe
190
167 cm
Neolithic Denmark
Denmark
103
173 cm
1600–1800
Holland
143
167 cm
1700–1800
Norway
1956
165 cm
1700–1850
London
211
170 cm
Pre-Dynastic Egypt
Egypt
60
165 cm
Dynastic Egypt
Egypt
126
166 cm
2500 BC
Turkey
72
166 cm
1700 BC
Lerna, Greece
42
166 cm
2000–1000 BC
Harappa, India
—
169 cm
300 BC–AD 250
Japan (Yayoi period)
151
161 cm
1200–1600
Japan (Medieval)
20
159 cm
1603–1867
Japan (Edo period)
36
158 cm
1450
Marianas, Taumako
70
174 cm
1650
Easter Island
14
173 cm
1500–1750
New Zealand
124
174 cm
1400–1800
Hawaii
—
173 cm
Is the Growth in Human Height Slowing Down?

Over the last hundred years, people around the world have grown noticeably taller. Across every continent, both men and women saw steady increases in average height throughout the 20th century. Better nutrition, improved healthcare, and cleaner environments helped fuel this trend.
But in recent decades, something has shifted.
When we look at the year-on-year changes in average height—how much people have grown from one generation to the next—the global pattern starts to flatten. In some regions, it’s not just slowing down. In certain countries, average height is no longer increasing. In a few, it’s even declining.
What the Data Tells Us
Charts tracking the yearly changes in male and female height reveal several key insights:
- Height changes slowly – It usually increases or decreases by very small amounts from year to year. This makes trends harder to spot at a glance, but when we zoom out, patterns become clear.
- Most of the world saw growth. From 1900 through the early 2000s, every region experienced noticeable gains in average height, for both men and women.
- But growth is now stalling – In parts of the world, especially Europe and Central Asia, male height has plateaued. For women in North America, the trend has flattened as well.
- In some regions, height is shrinking. In the Middle East and North Africa, East Asia, and Sub-Saharan Africa, both male and female average heights have begun to decline in recent years.
Why Would Height Stop Increasing?
At first glance, this seems counterintuitive. Height is strongly linked to overall living standards, and across much of the world, those standards have been improving. So why would average height stagnate—or drop?
There’s no single explanation, but a few likely factors include:
- Nutrition quality has changed – In some regions, diets may be calorically sufficient but low in protein and micronutrients needed for growth.
- Early-life conditions still matter – Many height-limiting factors, like maternal undernutrition or childhood infections, are still widespread in some areas despite economic progress.
- Inequality plays a role – National averages can hide big differences. If the poorest still face poor health and nutrition, overall height can stall even while the rich grow taller.
- Obesity and metabolic disorders – As diets shift toward processed foods and sugary drinks, children may grow heavier without growing taller.
How Nutrition Shapes Human Height
Nutrition is one of the most important factors that influences how tall people grow. It is particularly vital during childhood, when the body is developing rapidly and needs enough energy and nutrients to sustain growth.
To put it simply, food is the fuel for our bodies — and if that fuel is lacking, growth slows down. When children do not consume enough energy through their diet, especially over long periods, their bodies adapt by slowing their growth. This results in stunting, which reduces adult height.
What we eat needs to provide not just calories, but the right kinds of nutrients too. Among these, protein plays a key role. Protein is critical for building and repairing tissues, and it’s especially important during the years when bones and muscles are developing.
Proteins are made up of amino acids, and while our bodies can produce some of them, others — called essential amino acids — must come directly from the food we eat. A well-balanced diet must supply all these amino acids in adequate amounts.
The effectiveness of different foods in supplying these essential amino acids is measured by something called PDCAAS — the Protein Digestibility Corrected Amino Acid Score. This score reflects both the quality of the amino acid profile and how easily the body can digest and absorb the protein.
Here’s a comparison of the protein quality in common foods:
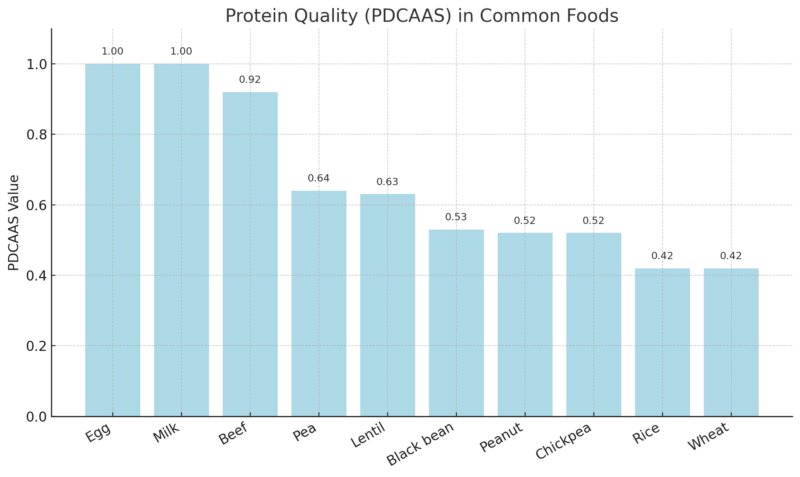
As the table shows, animal-based foods like eggs, milk, and beef score the highest, meaning they offer the most complete and digestible protein for human growth. These foods also tend to be rich in other crucial nutrients like iron and zinc, which support metabolism and development.
This difference in protein quality is one reason why height varies between countries. A 2018 study by Headey found that in lower-income nations, populations with higher intakes of animal-source foods — such as dairy, meat, or fish — also tend to be taller.
Similarly, a 2014 study by Grasgruber observed that in high-income countries, the best predictor of average male height was the ratio of high-quality animal proteins to low-quality plant proteins. In short, people who eat more milk products, red meat, and fish are often taller than those whose diets rely mostly on cereals and grains.
But it’s not just about wealth. Some countries with high incomes still fall short in average height compared to others with similar economic status. Why? It often comes down to the diversity of protein sources.
If a country’s diet relies heavily on one type of plant food, for instance, rice in Bangladesh, then people might not get all the amino acids needed for optimal growth. Even adding legumes or seeds to grains can help balance out this gap and provide a more complete nutritional profile.
However, in many poorer countries, diets remain too limited in variety to meet these needs.
Methodology
We combined historical, medical, and anthropometric research, using reliable sources like NCD-RisC data, peer-reviewed studies, and archaeological findings.
Statistical records from military conscription, health surveys, and skeletal remains were used to track long-term trends in human height.
We cross-referenced average height, weight, and BMI by country and region to highlight geographic patterns and gender differences.
For nutrition impact, we included PDCAAS protein scores to show how dietary quality affects growth and adult stature.
Prehistoric and forager population data provided a baseline comparison of human height before industrialization.
References
- ResearchGate – New Light on the Dark Ages: The Remarkably Tall Stature of Northern European Men during the Medieval Era
- ResearchGate – Global Height Trends in Industrial and Developing Countries 1810–1984: An Overview
- NCD Risk Factor Collaboration (NCD‑RisC) – NCD-RisC archives
- Our World in Data – Average height of men for selected countries
- Our World in Data – Mean height males vs females
- FindResearcher (University of Southern Denmark) – Ethnographic study on foragers and subsistence groups (AJPA article)
- Our World in Data – Share of calories from animal protein vs mean male height
- Wiley Online Library – Study by Headey on animal-source foods and height (2018)
- ScienceDirect – Grasgruber et al. (2014) on protein quality and male height