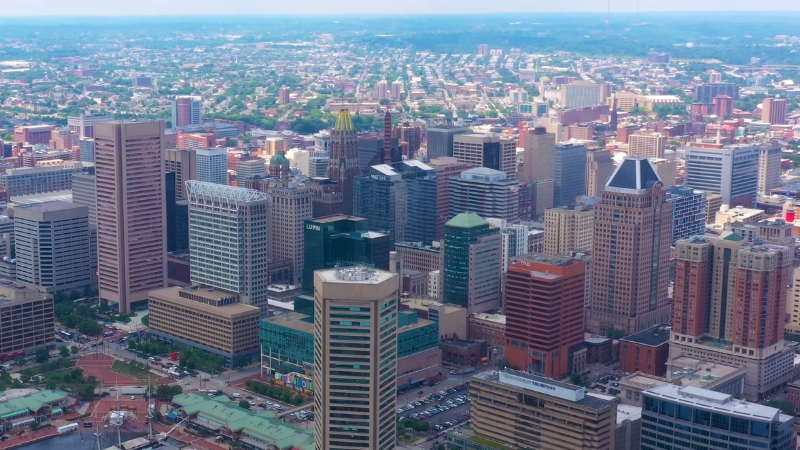
Baltimore has 569,997 residents, according to the latest U.S. Census Bureau estimate. The city has lost nearly 16,000 people since the 2020 Census, but its population has barely changed over the past two years.
Between 2024 and 2025, Baltimore lost just 56 residents. The decline is much smaller than the losses recorded earlier in the decade.
The surrounding metropolitan area is growing, even as Baltimore City remains below its 2020 population. Meanwhile, nearly 20% of city residents live in poverty, the median household income is $62,177, and the median home sale price is around $225,000.
Here are the latest population, demographic, employment, income and housing statistics for Baltimore in 2026, using the most recent figures available from the Census Bureau and other official sources.
Population of Baltimore in 2026 Compared to Recent Years
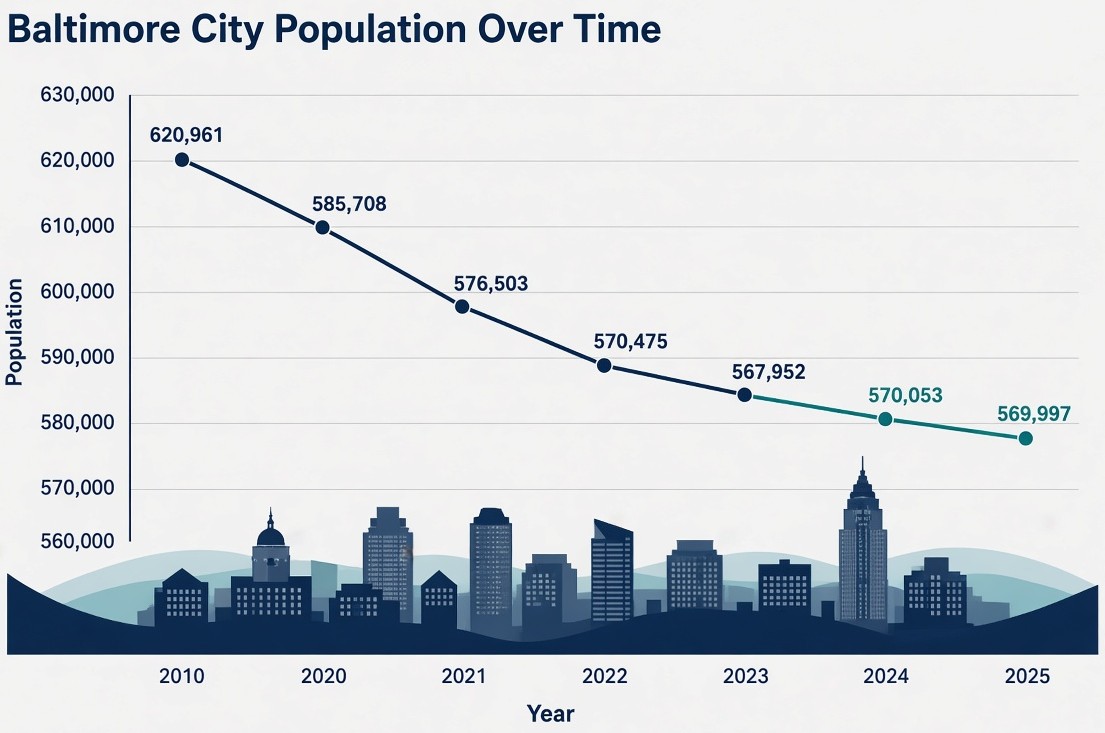
As we already said, the latest official population estimate is 569,997, dated July 1, 2025. We are still waiting for Census Bureau to release its 2026 city population estimates.
The city had 585,708 residents at the 2020 Census, meaning Baltimore lost 15,711 people over the following five years.
The figures from the U.S. Census Bureau for Baltimore City show a 2.7% decrease from the April 2020 population estimates base.
| Year | Baltimore City Population |
|---|---|
| 2010 | 620,961 |
| 2020 | 585,708 |
| 2021 | 576,503 |
| 2022 | 570,475 |
| 2023 | 567,952 |
| 2024 | 570,053 |
| 2025 | 569,997 |
Sources: U.S. Census Bureau and Federal Reserve Bank of St. Louis, Baltimore City population series.
Baltimore’s population dropped by more than 8,500 between 2021 and 2023. The direction then changed, with an increase of 2,101 residents in 2024.
The small decline in 2025 left the population almost unchanged from the previous year.
Two years of relative stability do not establish that Baltimore has permanently reversed its decline. They do show a sharp slowdown in population losses.
There is a Significant Decline Since the 1950s
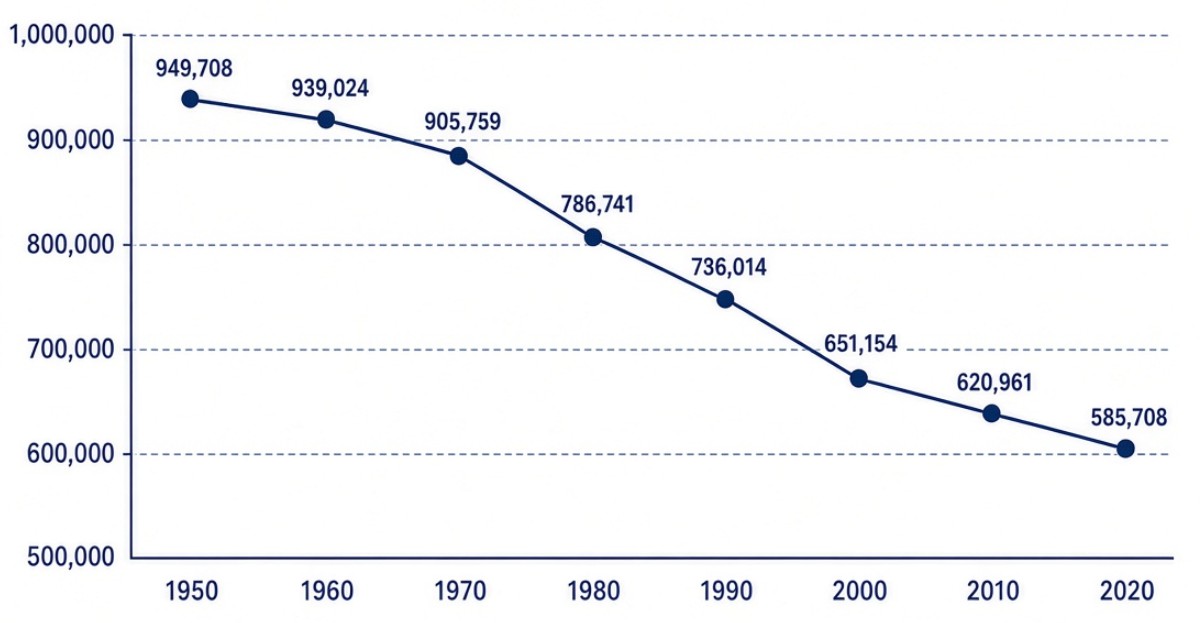
Baltimore was once one of the largest cities in the United States.
In 1950, its population reached 949,708, making it the sixth-largest city in the country, according to the 1950 U.S. Census records.
Manufacturing, steel production, shipping and industrial employment supported a much larger population than the city has today.
During the following decades, factories closed, industrial jobs declined and many households moved to surrounding suburbs.
| Year | Population |
|---|---|
| 1950 | 949,708 |
| 1960 | 939,024 |
| 1970 | 905,759 |
| 1980 | 786,741 |
| 1990 | 736,014 |
| 2000 | 651,154 |
| 2010 | 620,961 |
| 2020 | 585,708 |
Baltimore has lost 379,711 residents since its 1950 peak, a decline of almost 40%.
Population loss helps explain the large number of vacant properties in some neighborhoods. The city was built to accommodate a much larger population, and many residential blocks have fewer occupied homes than they had decades ago.
City Population vs. Metro Area
Baltimore City is much smaller than the surrounding metropolitan area.
The Baltimore-Columbia-Towson metro area includes Baltimore City and surrounding counties. Many people employed in Baltimore live outside the city limits.
The metro population reached 2,857,781 in 2025, according to Census data published through FRED.
| Year | Metro Area Population |
|---|---|
| 2020 | 2,847,138 |
| 2021 | 2,845,979 |
| 2022 | 2,843,177 |
| 2023 | 2,843,966 |
| 2024 | 2,853,522 |
| 2025 | 2,857,781 |
The metro area gained 4,259 residents between 2024 and 2025. Since 2020, its population has increased by 10,643.
The numbers show that the larger Baltimore region has continued growing even as the city itself has lost residents.
Population by Race and Ethnicity
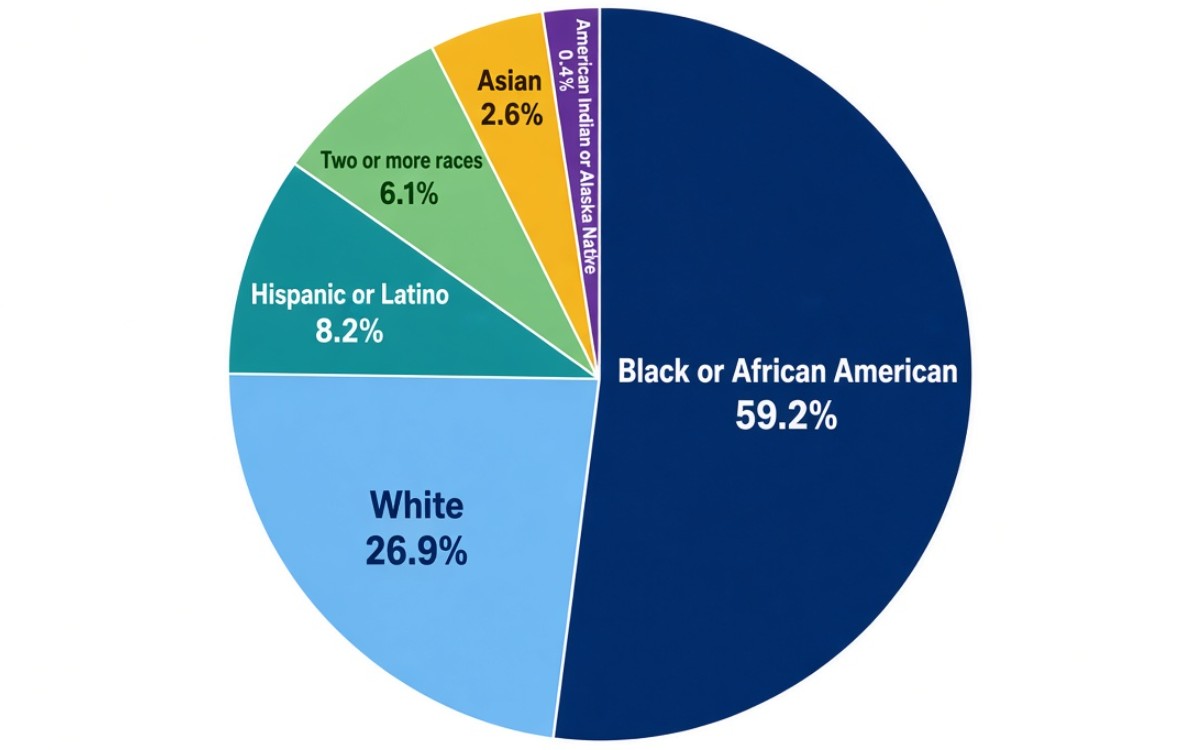
Baltimore remains a majority-Black city. African American residents account for 59.2% of the population, according to the Census Bureau.
White residents represent 26.9%, while Hispanic or Latino residents make up 8.2%.
| Race or Ethnicity | Share of Residents |
|---|---|
| Black or African American | 59.2% |
| White | 26.9% |
| Hispanic or Latino | 8.2% |
| Two or more races | 6.1% |
| Asian | 2.6% |
| American Indian or Alaska Native | 0.4% |
Source: U.S. Census Bureau QuickFacts. Hispanic or Latino is recorded separately from race, so the percentages do not total 100%.
Baltimore’s African American community has played a major role in the city’s political, cultural and economic history.
The Hispanic population has also become an established part of Baltimore, particularly in Southeast Baltimore, where Latino-owned businesses, restaurants and community organizations serve residents.
According to the Census Bureau’s 2020-2024 American Community Survey estimates, 9.3% of Baltimore residents were born outside the United States.
That is a citywide percentage. It should not be confused with immigrant statistics covering the larger metropolitan area.
Age Distribution
Children younger than 18 make up 20.9% of Baltimore’s population, while residents age 65 and older account for 15.3%.
The Census Bureau also reports that 6.0% of residents are younger than five, and 53.5% of the city’s population is female.
| Population Group | Share |
|---|---|
| Children under 5 | 6.0% |
| Residents under 18 | 20.9% |
| Residents age 65 and older | 15.3% |
| Female residents | 53.5% |
About one in five residents is a child, and more than one in seven is a senior.
The age figures are relevant to public services, particularly schools, childcare and healthcare. Baltimore also needs housing suitable for households at different stages of life.
Income and Poverty
Baltimore’s median household income is $62,177, based on the 2020-2024 American Community Survey. Per capita income is $40,604.
More concerning is the poverty rate. The Census Bureau estimates that 19.7% of Baltimore residents live below the federal poverty threshold.
| Income Statistic | Baltimore City |
|---|---|
| Median household income | $62,177 |
| Per capita income | $40,604 |
| Residents in poverty | 19.7% |
| Labor force participation, age 16+ | 63.1% |
| Female labor force participation | 61.3% |
The figures show that almost one in five Baltimore residents lives in poverty despite the city’s major hospitals, universities and professional employers.
Income also varies across neighborhoods. Some areas have expensive housing and relatively high household earnings, while other communities have lower incomes and fewer employment opportunities.
Median household income should not be confused with average wages. It measures the middle household in the income distribution and can include earnings from multiple household members.
Minimum Wage and Living Costs
Maryland’s minimum wage is $15 per hour in 2026 for covered workers, according to the Maryland Department of Labor.
A person working 40 hours per week at $15 per hour earns $600 before taxes. Over 52 weeks, that equals $31,200 annually.
The Census Bureau reports a median gross monthly rent of $1,331 in Baltimore for the 2020-2024 survey period.
Paying that amount for 12 months would cost $15,972. That represents 51.2% of the annual gross income of a full-time minimum-wage worker.
Rent is only one household expense. Food, utilities, transportation, medical costs and taxes take another share of income.
Maryland also has a separate living-wage requirement for certain government service contracts. According to the state’s living-wage schedule, the Tier 1 rate increased to $17.54 per hour on September 29, 2026.
Baltimore City is included in Tier 1. However, the $17.54 rate applies to qualifying state service contracts, not every private-sector job.
Employment and Unemployment
Baltimore’s labor market looks very different depending on whether the statistics cover the city or the surrounding metropolitan area.
In August 2026, Baltimore City had a civilian labor force of 284,223, including 268,641 employed residents and 15,582 unemployed residents.
The city’s unemployment rate stood at 5.5%, according to the Bureau of Labor Statistics local labor force tables.
The unemployment rate measures residents looking for work, not the number of jobs physically located within the city.
Employment in the Baltimore Metropolitan Area
The wider Baltimore-Columbia-Towson area supported 1.441 million nonfarm payroll jobs in August 2026.
According to the BLS metropolitan employment figures, payroll employment was 0.5% lower than a year earlier.
| Metro Employment Metric | August 2026 |
|---|---|
| Total nonfarm payroll jobs | 1,441,000 |
| Annual payroll employment change | -0.5% |
| Metro unemployment rate | 3.9% |
| Manufacturing jobs | 59,200 |
| Construction, mining and logging jobs | 85,800 |
| Trade, transportation and utilities jobs | 230,500 |
The metro unemployment rate was lower than Baltimore City’s rate of 5.5%.
Healthcare, higher education, professional services and government remain major parts of the regional economy. Institutions such as Johns Hopkins University and Johns Hopkins Hospital are among Baltimore’s most prominent employers.
The Port of Baltimore and Its Role in the Economy
The Port of Baltimore remains one of Maryland’s largest transportation and trade assets.
According to the Maryland Port Administration’s March 2026 report, the port handled 50 million tons of cargo in 2025.
That was its second-highest annual cargo total on record, behind the 52.3 million tons handled in 2023.
Cargo volume also increased from 45.9 million tons in 2024, the year the Francis Scott Key Bridge collapsed.
The port handled 728,225 automobiles and light trucks in 2025. It also processed 887,513 tons of imported agricultural and construction machinery through its public terminals.
Port activity supports jobs in trucking, rail transportation, shipping, warehousing and related industries across Maryland.
Baltimore Housing Market in 2026
Video: Providing some important insights about the real estate market in Baltimore. Shared by Grant, Weston & Jim Bim.
The median home sale price in Baltimore City was $224,498 in September 2026, according to Redfin’s Baltimore City housing market data.
Prices were down 0.22% from the same period a year earlier. Homes spent a median of 49 days on the market, compared with 46 days the previous year.
| Housing Metric | Latest Figure |
|---|---|
| Median sale price, September 2026 | $224,498 |
| Annual price change | -0.22% |
| Homes sold in September | 531 |
| Median days on market | 49 |
| Median sale price per square foot | $158 |
There were 531 home sales in September, down from 614 during the same month in 2025.
The Census Bureau’s housing survey provides additional information about the people living in those homes.
Its 2020-2024 estimates show an owner-occupied housing rate of 47.5%, a median owner-occupied home value of $229,600, and a median gross monthly rent of $1,331.
The Census home value is not the same measure as Redfin’s median sale price. The former comes from a household survey, while the latter measures properties sold during a defined period.
Home Prices Across Neighborhoods
Housing prices vary considerably across Baltimore.
Neighborhoods such as Canton, Federal Hill and Fells Point have established residential markets close to the waterfront, restaurants and employment centers.
Other neighborhoods offer lower-priced housing, although some properties need extensive repairs or renovations.
For buyers, the citywide median price is only a starting point. Housing condition, property taxes, insurance and renovation costs influence the total expense of owning a home.
We have also shared insights about Maryland population, where you can find additional context for the changing communities and housing demand.
Education
According to the Census Bureau, 36.1% of Baltimore residents age 25 and older have a bachelor’s degree or higher.
The share with a high school diploma or equivalent qualification is 87.7%.
| Educational Attainment | Residents Age 25+ |
|---|---|
| High school graduate or higher | 87.7% |
| Bachelor’s degree or higher | 36.1% |
| Without a high school qualification | 12.3% |
Baltimore is home to Johns Hopkins University, Morgan State University, the University of Maryland and several other higher-education institutions.
Universities and hospitals provide skilled employment and attract students from outside Maryland. However, the citywide education figures also show that most adults do not have a four-year college degree.
Many jobs in healthcare support, transportation, construction and other industries are available through vocational training or qualifications below the bachelor’s level.
Immigration and Foreign-Born Residents
Foreign-born residents account for 9.3% of Baltimore’s population under the 2020-2024 American Community Survey.
The Census also reports that 12.0% of residents age five and older speak a language other than English at home.
Baltimore’s immigrant communities include residents from Latin America, Africa, Asia and other regions.
Immigration has contributed to residential and commercial activity in neighborhoods such as Highlandtown and Greektown, where international businesses and community organizations are part of local life.
The city’s foreign-born percentage is lower than Maryland’s statewide share. Baltimore City should also not be confused with Baltimore County or the larger metropolitan area when comparing immigrant population totals.
Crime Statistics in Baltimore in 2026
Baltimore recorded substantial reductions in homicides and nonfatal shootings during 2025.
According to the Baltimore Police Department’s year-end report, the city recorded 133 homicides in 2025, compared with 194 in 2024.
That represents a 31% decline. Nonfatal shootings fell from 412 to 311, a reduction of 24%.
The decline continued during the first half of 2026.
The Baltimore Police Department’s July 2026 report recorded 50 homicides during the first six months, compared with 65 during the equivalent period in 2025.
The police department reported a 23% reduction in homicides and a 2.5% decline in nonfatal shootings.
Crime remains a serious concern in parts of Baltimore, but the recent reductions are supported by the city’s official reporting.
Methodology
The population statistics in this article use U.S. Census Bureau estimates available as of October 2026. The latest annual city and metropolitan population figures refer to July 1, 2025.
Demographic, income, education and household housing figures primarily come from the 2020-2024 American Community Survey. Employment figures refer to August 2026, and the home sale statistics cover September 2026.
City and metropolitan area data are presented separately. Historical census counts, survey estimates, payroll jobs and housing transactions measure separate subjects and should not be treated as interchangeable.