Approximately three babies in the United States are born with birth injuries every hour, impacting as many as seven out of every 1,000 deliveries according to Medscape.
Tragically, many families are left questioning the cause of their child’s condition. Birth injury statistics can provide valuable insight into these cases.
When medical negligence plays a role, families should not have to navigate the challenges alone. Financial compensation may be available to help cover the costs of care, as around 30,000 babies are born each year in the U.S. with some form of birth injury.
Table of Contents
ToggleKey Takeaways
Birth Injury Frequency in the U.S.
Statistic
Value
Babies born with birth injuries annually
Just under 30,000
Frequency of birth injuries
Every 20 minutes
Birth injuries per 1,000 live births
6.6
Birth injuries per 10,000 vaginal deliveries
4.0
Birth injuries remain relatively rare compared to the total number of births, but the fact that one occurs every 20 minutes highlights the significant impact on affected families according to the Birth Injuries Center. Vaginal deliveries show lower rates than overall averages, likely due to fewer medical interventions.
Birth Injury and Gender Differences

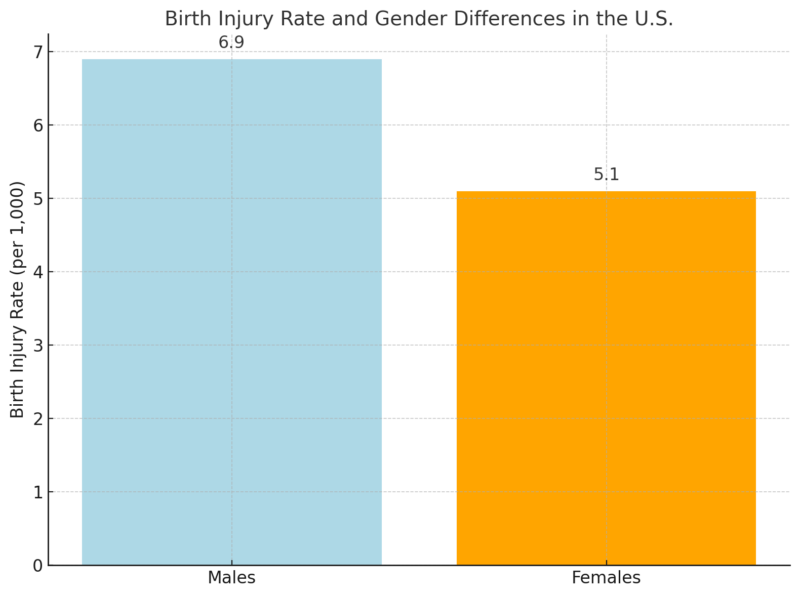
Male infants face a higher risk of birth injuries, likely due to their larger size, which can complicate delivery. This highlights the importance of careful monitoring during labor, especially for larger male fetuses.
Types and Severity of Birth Injuries
Statistic
Value
Percentage of moderate to severe injuries
Over 80%
Examples of moderate to severe injuries
Broken bones, brain damage, nerve damage
Percentage of minor injuries
Less than 20%
The majority of birth injuries are classified as moderate to severe, indicating significant medical and financial challenges for affected families. These injuries can result in long-term complications requiring extensive care, emphasizing the need for preventive measures during labor and delivery.
Use of Cesarean Deliveries

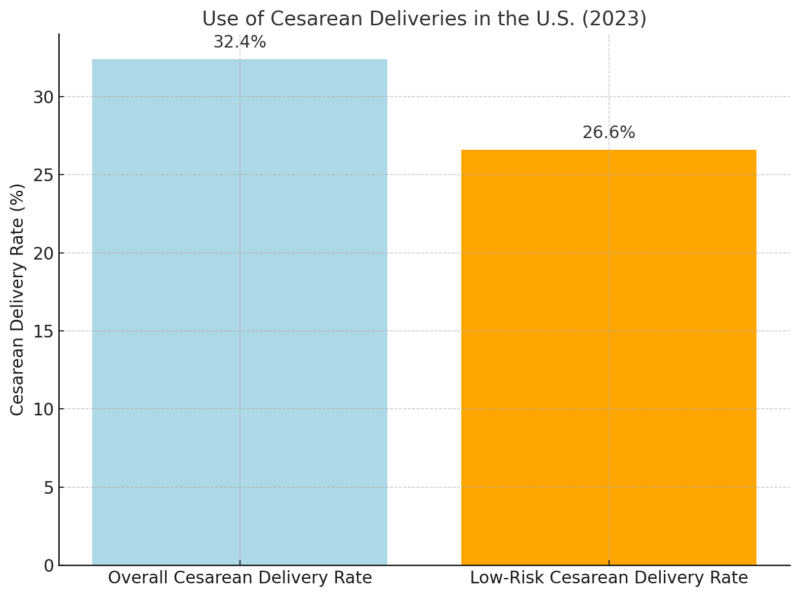
Cesarean deliveries remain common, accounting for nearly one-third of all births in 2024 according to the CDC. While these procedures can reduce the risk of complications in certain cases, the high rate of low-risk cesareans may suggest potential overuse, warranting further evaluation of delivery practices.
Infant Mortality and Birth Injury Contribution
Statistic
Value
Infant mortality rate (per 1,000 births)
5.6
Annual infant deaths in the U.S.
20,912
Birth injuries’ contribution to infant deaths
20%
Birth injuries’ ranking as the cause of death
4th leading
The CDC notes that birth injuries are a significant contributor to infant mortality, responsible for 20% of infant deaths annually and the rate is 5.6 per 1000 births. This underscores the critical need for improving delivery care and addressing preventable causes of birth injuries to reduce mortality rates.
Vacuum-Assisted Delivery Risks
Statistic
Value
Birth injuries per 10,000 vacuum-assisted deliveries
59
Common complications
Brain bleeds
Vacuum-assisted deliveries carry inherent risks, including brain bleeds, with a relatively high injury rate of 59 per 10000 deliveries according to NCBI. This highlights the need for careful consideration and skilled execution of this procedure to minimize potential harm.
Hydrocephalus in Newborns
Statistic
Value
Prevalence of hydrocephalus (per 1,000 births)
1-2
Hydrocephalus affects a small percentage of newborns but represents a serious condition requiring immediate medical attention as noted by UCLA. Early diagnosis and treatment are crucial for improving outcomes in affected infants.
Birth Injury Statistics on Legal Claims
There are approximately 20,000 infant deaths in the United States every year, and birth injuries account for 20% of those deaths: birth injuries are the fourth leading cause of death among infants. [READ MORE]https://t.co/nBwfbtrWCy pic.twitter.com/sk7qqykhM1
— Medical Malpractice (@MedMalLawyers) December 16, 2024
Every year, approximately 20,000 medical malpractice lawsuits are filed in the United States, with many related to birth injuries.
- The average medical malpractice payout for infants under one-month-old exceeds $1 million.
- Settlement amounts can vary widely due to the range of birth injury severity, from mild injuries to those causing permanent disability.
Birth Injury Statistics on Causes
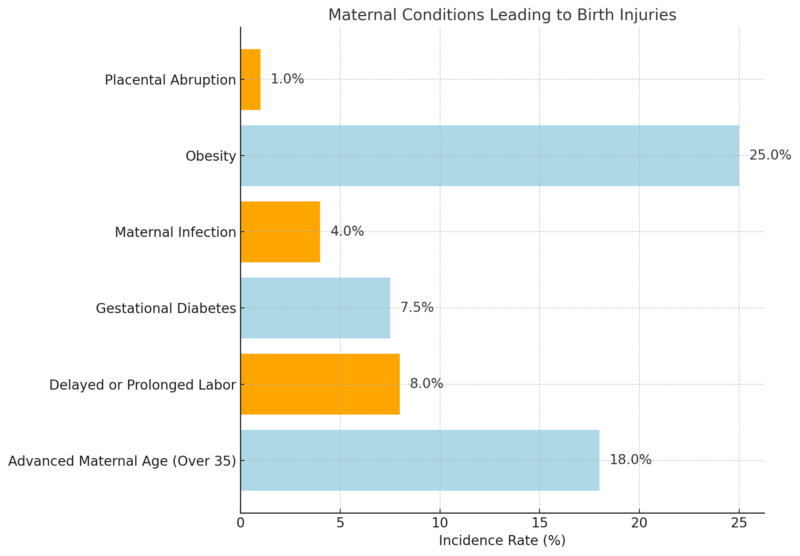
Birth injuries arise from a variety of factors, including maternal or infant conditions, as well as medical negligence. Below is a breakdown of key causes:
Maternal Conditions Leading to Birth Injuries

Severe maternal complications occur in 1% to 2% of deliveries and can lead to birth injuries if not properly managed according to sources.
Infant Conditions Leading to Birth Injuries
Condition
Incidence Rate
Breech (feet-first) positioning
3%-4% of deliveries
Fetal infection
4% of deliveries
Oxygen deprivation
~4 million deliveries/year
Proper diagnosis and management of these conditions are critical to reducing the risk of birth injuries.
Other Causes of Birth Injury
Type of Injury
Incidence Rate
Head and scalp injuries
80% of all birth injuries
Clavicle (collarbone) fracture
0.2%-4.5% of deliveries
Physical injuries, such as head trauma or broken bones, are often preventable with proper medical care during labor and delivery.
What to Do if You Suspect Medical Negligence
- Get legal assistance: If you believe your child’s birth injury could have been prevented, contact Garland, Samuel & Loeb for a free, confidential case review. Speak directly with experienced labor and delivery nurses to determine whether medical malpractice may have been involved.
- Talk to a nurse: Speak with a registered nurse in confidence to better understand your child’s birth injury and explore your legal options. There is no cost or obligation to reach out.
Birth Injury Demographic Statistics

An analysis of birth injury statistics across race, economic status, and geographic location reveals some surprising trends. While birth injuries affect families from all socio-economic backgrounds at similar rates, geographic location shows a marked impact on birth injury rates.
- Economic status: The rate of birth injuries is consistent across wealthy and poor areas in the U.S. However, mothers in wealthier locations experience significantly higher rates of obstetrical injuries compared to those in poorer areas.
- Insurance coverage: Babies insured by Medicaid experience slightly higher birth injury rates than those with private insurance. Interestingly, uninsured newborns have better birth injury rates compared to privately insured babies.
- Race: Asian and Caucasian newborns have notably higher birth injury rates than Hispanic and African American babies.
- Geographic location: Birth injury rates vary significantly by location, with the lowest rates in large metropolitan areas. Rates increase progressively in more rural regions, with birth injuries 33% more common in the most rural areas compared to large urban centers according to AHRQ.
Methodology
This article was crafted through a comprehensive review of reputable medical and legal sources, including data from Medscape, CDC, NCBI, UCLA, and AHRQ. We analyzed key statistics and trends to present an accurate and balanced overview of birth injury prevalence, causes, and outcomes.
Careful categorization was used to address demographic factors, medical practices, and legal claims, ensuring clarity and relevance for diverse readers. Each section was designed to highlight actionable insights, supported by authoritative references.
Finally, the content was tailored to assist families in understanding their options and accessing professional support when needed.
References
- Medscape – Birth Injuries in the United States: Statistics and Trends
- Birth Injuries Center – Birth Injury Statistics
- CDC – National Vital Statistics Reports
- NCBI – Vacuum-Assisted Deliveries and Birth Injuries
- UCLA Health – Hydrocephalus in Newborns
- AHRQ (Agency for Healthcare Research and Quality) – Birth Injury Disparities by Location and Demographics
Related Posts:
- The Silent Crisis - Statistical Trends in Jockey…
- Top 5 Causes of Cardiovascular Diseases: Statistical…
- What’s the Legal Difference Between a Certificate of…
- Philadelphia Population 2025 - Current Figures and Analysis
- New Orleans Population 2025 - Current Data and…
- Valencia Spain Crime Rate 2025 - Trends and Analysis


