Denver, located in Adams County, Colorado, has a 2025 population of 716,234. The city is experiencing a slight annual population decline of -0.05% and has decreased by -0.19% since the 2020 census, which recorded a population of 717,606 as noted by World Population Review.
By the year 2025, the Denver metro area is expected to reach approximately 2,995,000 people, marking a 1.08% increase from the previous year according to Macrotrends.
These trends have a substantial impact on the city’s infrastructure, economic planning, and community services, making it essential for stakeholders to stay informed.
With this knowledge, Denver can effectively plan and adapt to the needs of its expanding population, ensuring a vibrant and sustainable urban environment.
Key Takeaways
Historical Population Growth
The population of Denver, Colorado increased nearly 20% from 2010-2020, and the growth has come with an influx of business capital and robust job growth. However, the city now faces the challenges that come along with that prosperity. https://t.co/uqkBu5lvWt pic.twitter.com/Oxn3fIGeBf
— CNBC (@CNBC) May 22, 2024
Denver has led Colorado in population growth for four consecutive years, according to the Census Bureau. It is both the fastest-growing city and county in the state, boasting a growth rate of 2.42% between 2011 and 2012.
The city’s growth is driven by the development of areas like Stapleton, the expansion of the few remaining greenfield spaces, and significant densification in the urban core. Denver is now the fastest-growing city in the United States and leads large metro areas in population growth for individuals aged 25-34.
In 2013, metro Denver saw a net migration of nearly 17,000 people and an employment growth rate of 2.0%, making it an attractive destination for new residents. The city’s population was projected to surpass 700,000 by 2020, with the wider metro area expected to reach 4.1 million by 2040, according to state demographer projections.
Denver was founded in 1858 as a mining town during the height of the Gold Rush. Earlier that year, gold prospectors from Kansas established Montana City along the South Platte River, which later became Denver. This first settlement was abandoned by 1859 in favor of Auraria and nearby St. Charles City.
General William Larimer, a land speculator, claimed a site on the bluff overlooking the river near Auraria in 1858, naming it Denver City in honor of Kansas Territorial Governor James W. Denver—unaware that the governor had already resigned. Land parcels were sold to miners and merchants, establishing Denver City as a frontier town with an economy centered on livestock, saloons, and gambling.
Age Distribution
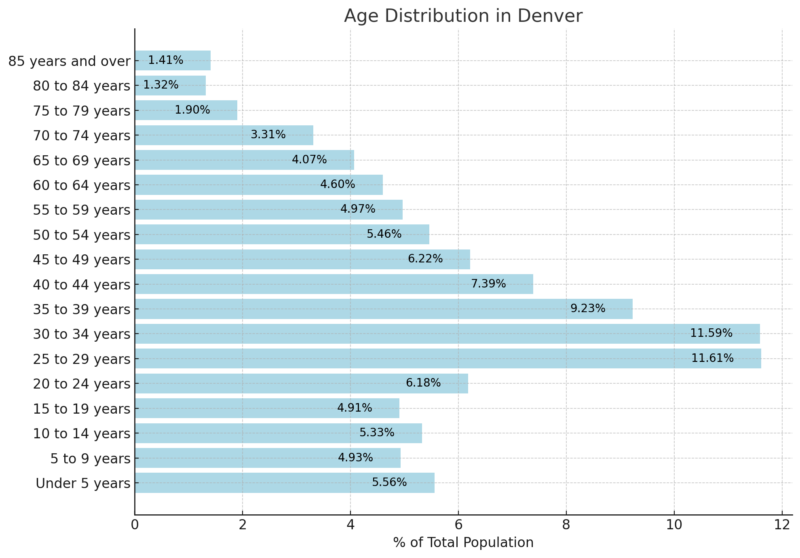
As per the 2018-2022 ACS 5-Year Estimates, the median age in Denver, CO is 34.9 years. The population is distributed as follows: 15.82% are under the age of 15, 22.70% are between 15 and 29 years old, 49.46% are aged 30 to 64, 10.60% are between 65 and 84 years old, and 1.41% are 85 years or older.
Gender Ratio
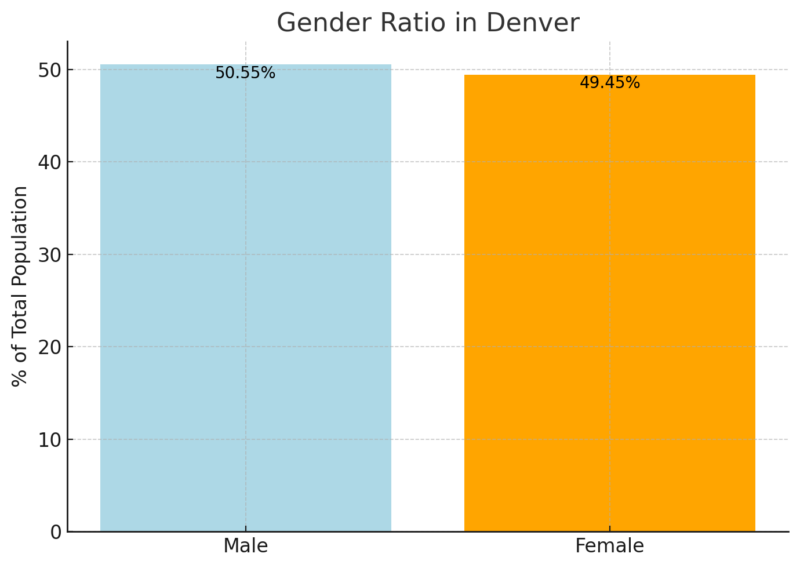
The population in Denver is almost evenly split between males (50.55%) and females (49.45%) as per Neilsberg article.
Males have a slight majority over females, with a difference of approximately 1.1%.
Ethnic Composition
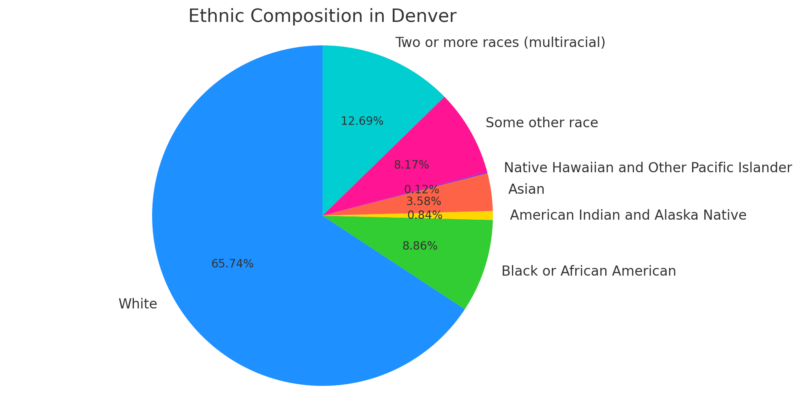
The White population constitutes the largest racial group, accounting for 65.73% of the total population.
Multiracial individuals represent a significant 12.69%, followed by Black or African American individuals at 8.86% and those of “some other race” at 8.17% according to Neilsberg.
Asian residents make up 3.58%, while American Indian and Alaska Native residents represent 0.84%. Native Hawaiian and Other Pacific Islander residents are the smallest group, at just 0.12%.
Top 50 Neighborhoods in Denver by Population
Rank
Neighborhood
Population (in thousands)
1
Montbello
30.35k
2
Gateway – Green Valley Ranch
29.20k
3
Hampden
19.83k
4
North Aurora
18.79k
5
Westwood
15.49k
6
Delmar Parkway
14.82k
7
Capitol Hill
14.71k
8
Hampden South
14.45k
9
Stapleton
13.95k
10
Washington Virginia Vale
13.03k
11
Five Points
12.71k
12
Windsor
12.59k
13
Virginia Village
12.49k
14
Mar Lee
12.45k
15
Harvey Park
11.53k
16
Marston
11.13k
17
Speer
10.95k
18
Congress Park
10.24k
19
East Colfax
10.19k
20
Ruby Hill
9.82k
21
West Colfax
9.74k
22
Sunnyside
9.73k
23
University
9.38k
24
North Park Hill
9.37k
25
Athmar Park
8.90k
26
Bear Valley
8.89k
27
Villa Park
8.76k
28
South Park Hill
8.59k
29
West Highland
8.54k
30
Fort Logan
8.45k
31
Highland
8.43k
32
Harvey Park South
8.39k
33
Hilltop
8.19k
34
Berkeley
8.11k
35
Lowry Field
8.07k
36
Cheesman Park
7.97k
37
Northeast Park Hill
7.83k
38
University Park
7.49k
39
Sloan Lake
7.24k
40
Hale
6.94k
41
Washington Park
6.90k
42
College View – South Platte
6.50k
43
Elyria Swansea
6.40k
44
Washington Park West
6.39k
45
Lincoln Park
6.12k
46
Barnum
6.11k
47
North Capitol Hill
5.82k
48
Goldsmith
5.81k
49
Cherry Creek
5.59k
50
University Hills
5.57k
Montbello and Gateway – Green Valley Ranch are the largest neighborhoods, with populations exceeding 29,000. These areas likely serve as significant residential hubs in Denver.
Statistical Atlas notes that neighborhoods like Capitol Hill (14.71k) and Stapleton (13.95k) reflect established urban communities with a balance of residential and commercial spaces.
The bottom-ranked neighborhoods, such as Cherry Creek (5.59k) and University Hills (5.57k), likely have lower population densities and may focus on specific lifestyle amenities or housing types.
Labor Force Data for Denver
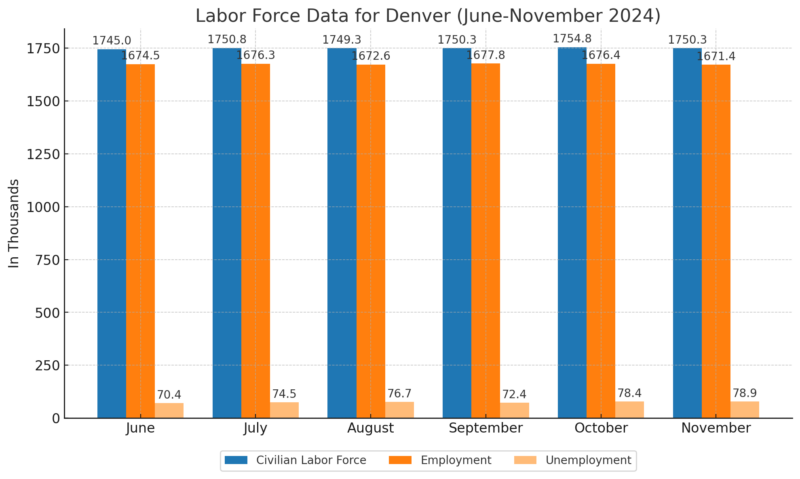
The civilian labor force remained relatively stable, ranging between 1,745.0k (June) and 1,754.8k (October). This indicates a steady participation in the workforce across the months.
BLS notes that employment peaked in September at 1,677.8k but showed a slight decline in October and November, dropping to 1,671.4k by November. This suggests a potential seasonal adjustment or minor economic slowdown.
Unemployment increased from 70.4k in June to 78.9k in November. The rise in unemployment may reflect either job losses or more individuals entering the labor force without securing employment.
The unemployment rate ranged from a low of 4.0% in June to a high of 4.5% in October and November. This relatively stable but slightly increasing trend signals moderate economic fluctuations.
Migration Trends
Category
Denver
Colorado
Children with Immigrant Parents
164,500 (87% U.S. citizens)
264,900 (89% U.S. citizens)
Non-Citizens at Risk of Deportation
188,300
290,400
Immigrants in Total Population
352,100 (12%)
545,500 (10%)
Immigrant-Owned Homes
80,700 homes
–
Immigrant Entrepreneurs
27,900
–
Immigrant Residents (since 2009 or earlier)
262,300
–
Immigrant Students (Pre-K to College)
44,300
–
Immigrants in the Labor Force
238,100 (14%)
364,500 (12%)
Labor Force Participation Rate
72%
71%
Immigrant Earnings
$14.4 billion
$21.3 billion
State & Local Taxes Paid
$1.1 billion
$1.7 billion
Federal Taxes Paid
$2.8 billion
$3.8 billion
Spending Power of Immigrants
$10.5 billion
$15.9 billion
Denver has 164,500 children with at least one immigrant parent, representing a significant demographic. The majority (87%) are U.S. citizens, reflecting the importance of mixed-status families.
Vera-Institute notes that Denver has 188,300 non-citizens potentially at risk of deportation, a concern for community stability and workforce continuity.
Immigrant-led households in Denver contribute $1.1 billion in state and local taxes and $2.8 billion in federal taxes, showcasing their substantial economic role.
Immigrants in Denver have an estimated $10.5 billion in spending power, driving local economic activity.
Immigrants make up 14% of Denver’s labor force, slightly higher than Colorado’s overall 12%. Their participation rate of 72% aligns closely with native-born workers, underlining their critical workforce presence.
With 27,900 immigrant entrepreneurs and 80,700 homes owned by immigrants, Denver’s foreign-born population contributes to business innovation and local housing stability.
Immigrants play a vital role in Denver’s educational system, with 44,300 enrolled students, and represent a long-standing community, as over 262,300 have resided in the metro area since 2009 or earlier. This highlights their integration and long-term presence in the region.
Housing Market Trends
Metric
Value
Typical Home Values
$545,849
1-Year Value Change
-1.3%
For Sale Inventory
3,173 (as of December 31, 2024)
New Listings
596 (as of December 31, 2024)
Median Sale Price
$562,867 (as of November 30, 2024)
Median List Price
$558,000 (as of December 31, 2024)
Median Sale-to-List Ratio
0.991 (as of November 30, 2024)
Percent of Sales Over List Price
20.2% (as of November 30, 2024)
Percent of Sales Under List Price
56.6% (as of November 30, 2024)
Median Days to Pending
42 days (as of December 31, 2024)
The Denver housing market is experiencing a slight decrease in typical home values, currently at $545,849, reflecting a 1.3% drop over the past year.
This suggests a minor cooling in the market after years of growth. Homes go pending in about 42 days, indicating continued demand and steady buyer interest according to Zillow.
The market remains competitive, with a significant percentage of homes (20.2%) selling over the list price, though more than half (56.6%) are sold under the asking price.
The sale-to-list ratio of 0.991 further highlights this competitive balance.
Environmental Considerations
Denver’s growing population impacts the environment, with increased resource consumption and waste production. The city must implement sustainable practices to mitigate these challenges. Water usage is a crucial concern, necessitating efficient management to avoid shortages.
Air quality may be affected as more vehicles contribute to pollution, emphasizing the need for clean energy solutions and public transit enhancements. Urban green spaces must be preserved to provide residents with recreational areas and maintain ecological balance.
Addressing these environmental concerns ensures that Denver can remain a livable and attractive city amid its population growth.
Comparison with Other Major Cities
The population of Denver in 2025 is reported to be approximately 2,995,000. This places Denver in a competitive position among American metropolitan areas in terms of population growth.
New York City remains the largest city in the United States, boasting a population of 8.1 million people. Despite some changes over the decades, it continues to be a significant urban center.
Phoenix and Washington, D.C. each have populations of around 5 million. These cities have shown considerable growth, marking them as key metropolitan hubs in the country.
Denver’s metropolitan growth rate is noteworthy. Between 2023 and 2025, it registered a steady annual increase, showcasing its expanding urban appeal.
In Colorado, the most populous cities following Denver are Colorado Springs and Aurora, with populations of 488,664 and 395,052 respectively. These Colorado cities reflect the increasing demographic trends seen throughout the Denver area.
Government Policies and Initiatives
@govofco It’s no surprise Colorado is #1 in EV sales as we continue to make charging your EV faster and easier with charging stations across the state. #EV #electricvehicle ♬ original sound – Governor Jared Polis
In 2025, the city introduced the Vibrant Denver Initiatives. These policies include expanding fleet electrification and increasing the number of electric charging stations to support sustainability efforts.
The city allocated $1.76 billion for governmental operations in its 2025 budget. This represents a marginal increase from the previous year, indicating a focus on efficient resource allocation. The budget reflects priorities such as creating a robust government infrastructure and ensuring effective city management.
To tackle housing challenges, the revised 2025 budget includes an additional $7.3 million for rental assistance and small business support. These measures aim to provide better affordability and economic opportunities for Denver residents.
Technology and innovation are key in Denver’s strategies for improving government operations. Initiatives such as the Peak Performance program work towards enhancing productivity and responsiveness by empowering staff across city departments. Program highlights include improving digital services and customer satisfaction.
For more information on these initiatives, readers can explore the Citywide Programs and Initiatives.
Income & Poverty in Denver, CO
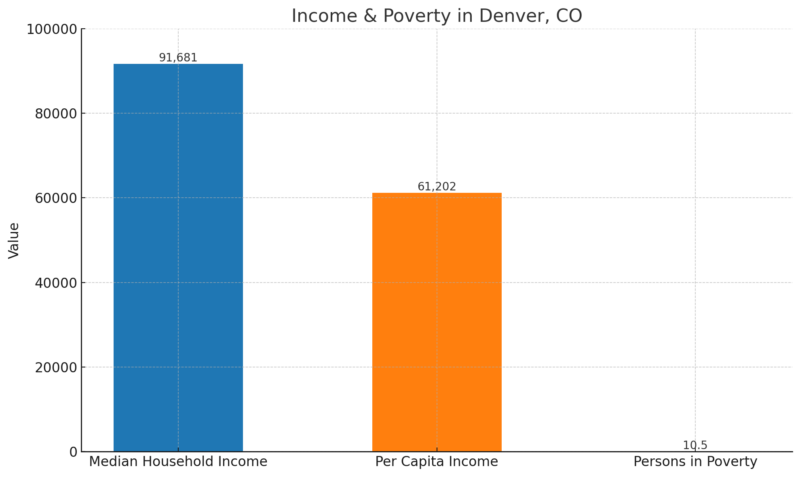
The median household income in Denver is $91,681 (in 2023 dollars), which indicates a relatively high earning capacity compared to many U.S. cities.
The per capita income of $61,202 further reflects the city’s overall economic strength and the substantial earning power of its residents noted by Census.gov.
However, with 10.5% of the population living in poverty, a notable portion of the community faces economic challenges.
Methodology
This article was crafted using verified data sources such as Census.gov, Zillow, and Macrotrends. We analyzed housing market trends, population growth, and labor force participation using structured datasets.
Comprehensive insights into immigrant contributions and community dynamics were derived from the American Immigration Council and Vera Institute reports. Historical and demographic context was incorporated through state and local government data.
The analysis is concise, balanced, and focused on delivering actionable information to stakeholders.
References
- World Population Review – Denver Population 2025
- Macrotrends – Denver Population Growth
- Neilsberg – Denver Population by Age
- Neilsberg – Denver Population by Gender
- Neilsberg – Denver Population by Race
- Statistical Atlas – Denver Neighborhood Population
- BLS – Denver Labor Force Data
- Vera Institute – Profile of the Foreign-Born Population in Denver
- Zillow – Denver Home Values
- City of Denver – Citywide Programs and Initiatives
- Census.gov – Denver QuickFacts


