

When I first started learning about statistics, I often found myself confused by terms like “population parameter” and “sample statistic.” They seemed pretty abstract, and I didn’t see why I needed to know the difference.
But understanding these concepts (without all the jargon) can actually make a huge difference when trying to make sense of data in everyday life.
What’s a Population Parameter?
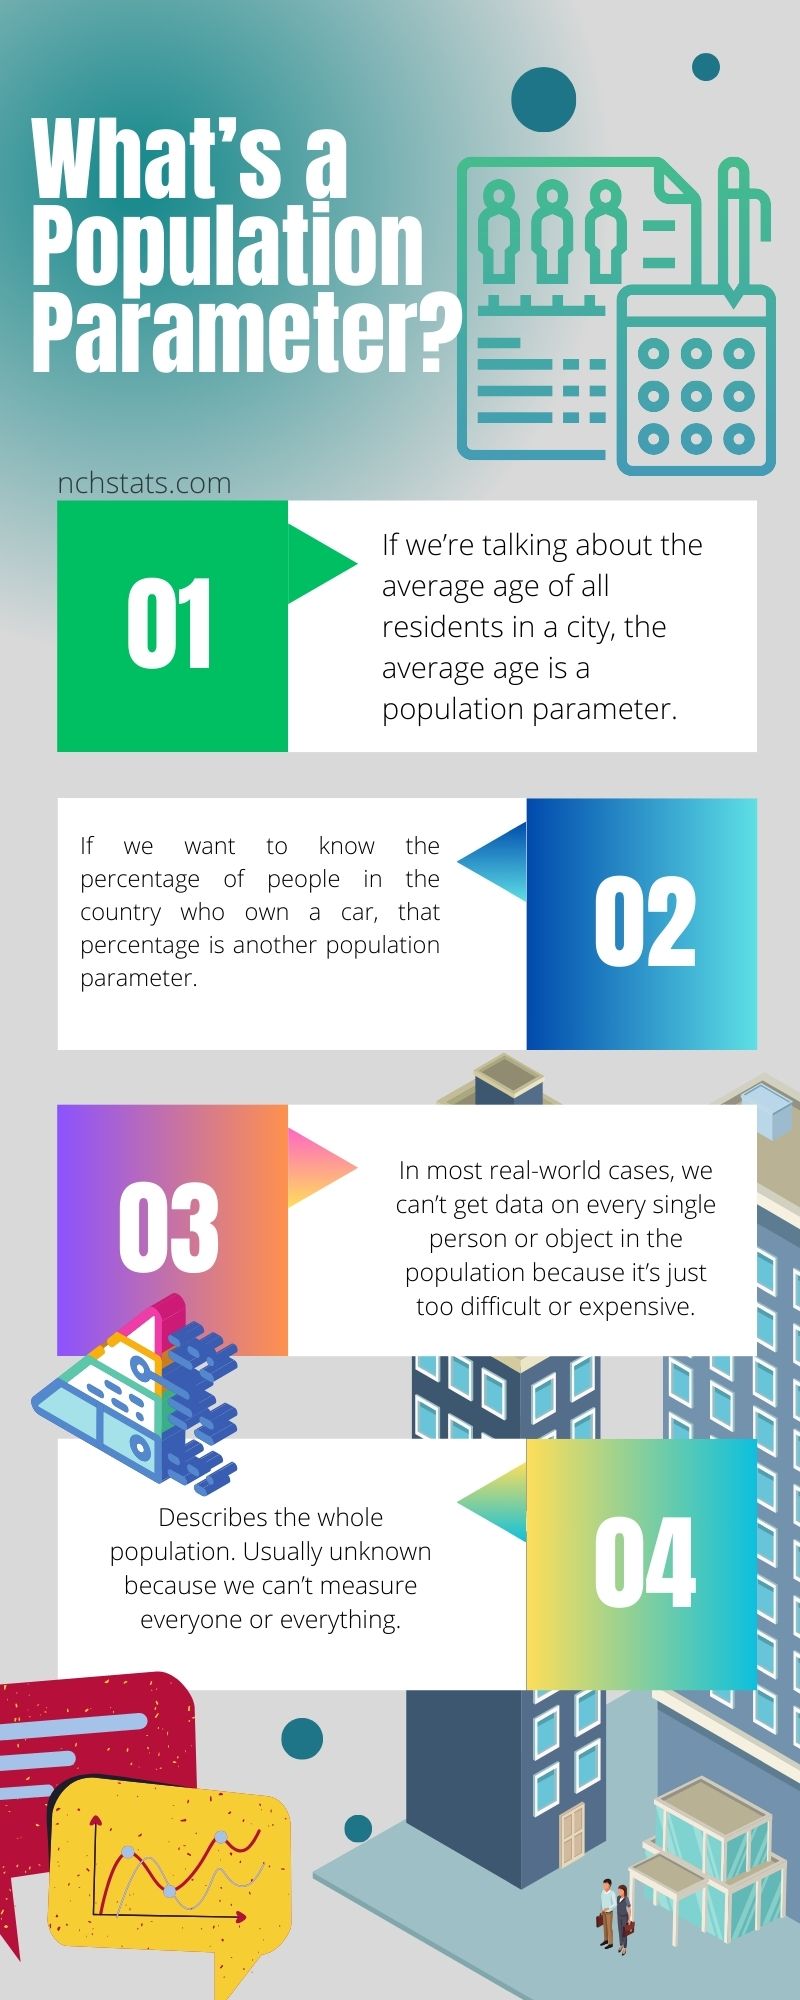
A population parameter is a number that describes something about an entire group we’re interested in. Think of the population as everyone or everything that fits into the category you’re studying.
- If we’re talking about the average age of all residents in a city, the average age is a population parameter.
- If we want to know the percentage of people in the country who own a car, that percentage is another population parameter.
So, What’s a Sample Statistic?
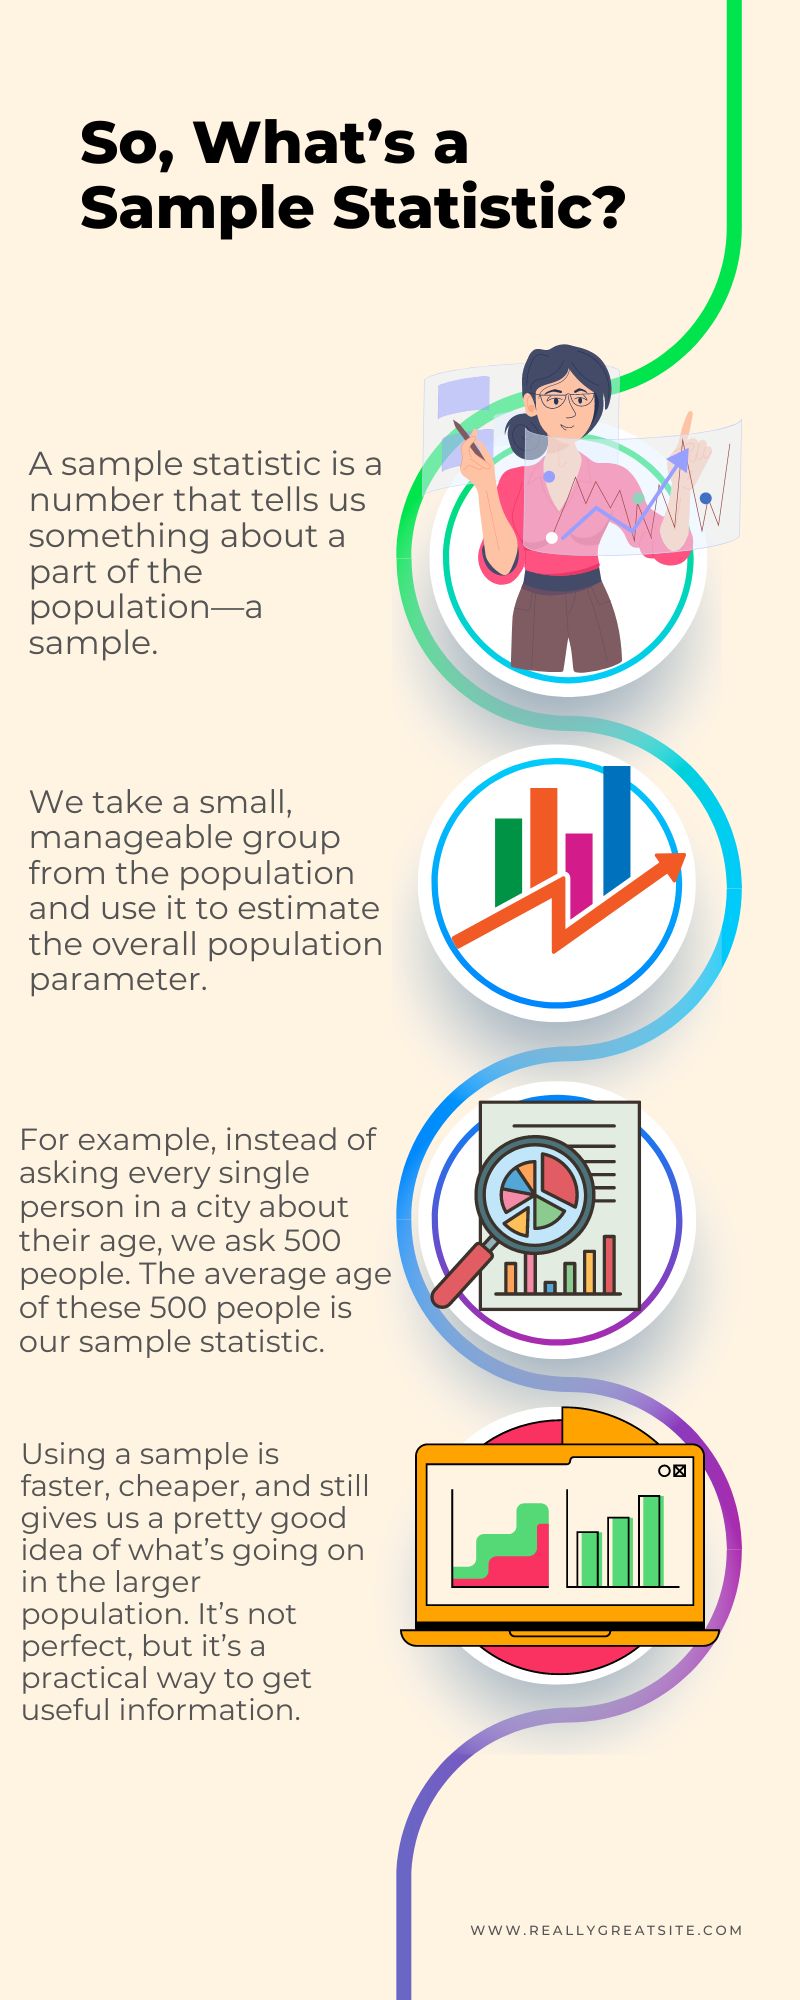
A sample statistic is a number that tells us something about a part of the population—a sample. We take a small, manageable group from the population and use it to estimate the overall population parameter. It’s like taking a small taste of a dish to guess how the whole thing will taste.
For example, instead of asking every single person in a city about their age, we ask 500 people. The average age of these 500 people is our sample statistic.
Instead of counting every car owner in the country, we survey a few thousand and use that percentage to estimate car ownership in the whole country.
Why Use Samples Instead of the Whole Population?
It would be great to have information on the entire population, but it’s not realistic. Imagine trying to interview every single person in the country about their car ownership. It would take forever and cost a fortune.
Using a sample is faster, cheaper, and still gives us a pretty good idea of what’s going on in the larger population. It’s not perfect, but it’s a practical way to get useful information.
Key Differences Between The Two
Let’s highlight the main differences:
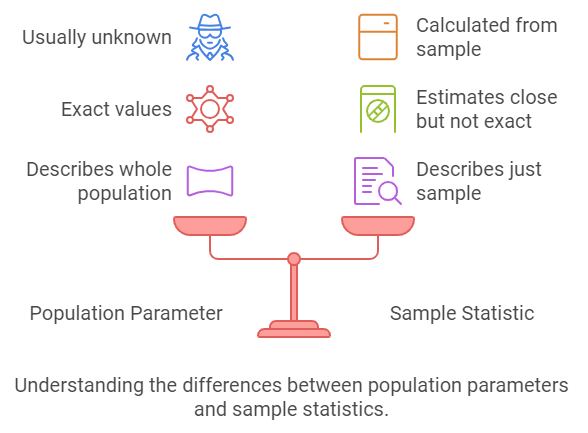
| Aspect | Population Parameter | Sample Statistic |
| Scope | Describes the entire population. | Describes just the sample and helps estimate the population parameter. |
| Accuracy | Exact values (if we could know them). | Estimates that can be close but not exact. |
| Availability | Usually unknown because we can’t measure everyone or everything. | Calculated based on the sample data we collect. |
Why It Matters in Everyday Life
You might wonder why it’s important to distinguish between these two. Here’s why: Every time you see a news headline, a survey result, or a poll, there’s a sample statistic behind it. Knowing this can help you evaluate how reliable that information is.
A report claims, “The average household income in the city is $50,000.” This is probably an estimate from a sample of households, not every household.
Understanding that these numbers are estimates from samples—and not exact values from the entire population—helps you see the bigger picture and not take every statistic at face value.
How We Choose Samples
Choosing the right sample is crucial. A poorly chosen sample can lead to misleading statistics. Here are some common methods:
- Random Sampling: Everyone in the population has an equal chance of being selected. This is typically the best method because it minimizes bias.
- Stratified Sampling: The population is divided into groups (like age or income levels), and samples are taken from each group. This ensures all parts of the population are represented.
- Convenience Sampling: The sample is chosen based on who’s easiest to reach, like surveying people at a mall. It’s not ideal because it can be biased.
Why Estimates Can Be Off
Even with a well-chosen sample, there’s always some error because we’re not measuring the whole population. This is called sampling error. It’s the difference between the sample statistic and the actual population parameter.
Bias – A Common Problem in Sampling
Bias happens when the sample doesn’t represent the population well. This can happen for a few reasons:
- Selection Bias: If some people are more likely to be included in the sample than others. For instance, calling only landlines excludes people who only have cell phones.
- Response Bias: If the way questions are asked influences answers. For example, asking, “Don’t you think Candidate X is doing a great job?” might lead to more positive responses.
Bias can seriously skew results, making the sample statistic a poor estimate of the population parameter.
How to Think Critically About Statistics
Next time you see a statistic:
- Check the Sample Size: Bigger samples usually give more accurate estimates.
- Look for Bias: Consider how the sample was chosen. Was it random? If not, there might be bias.
- Consider the Margin of Error: Understand that no sample statistic is perfect. There’s always a range of uncertainty.
Wrapping Up
In a nutshell, a population parameter tells us something about the entire group we’re interested in, but it’s typically out of reach. A sample statistic gives us an estimate based on a smaller group, and it’s what we often use to make decisions or predictions.
It’s not about getting everything perfectly right, but about making informed guesses. Knowing the difference between a population parameter and a sample statistic helps us interpret data more wisely and avoid being misled by headlines and reports.


