

If you are comparing your own bank balance with other Americans, start with $8,000, not $62,500.
Both numbers come from the Federal Reserve. The difference is that $8,000 is the median transaction-account balance, while $62,500 is the mean. Half of families with transaction accounts have less than the median and half have more. The mean gets pulled much higher by families holding very large cash balances.
There is another catch. The Federal Reserve is not measuring savings accounts alone. Its definition of transaction accounts includes checking accounts, savings accounts, money market accounts, call accounts and prepaid debit cards. Stocks, retirement accounts, certificates of deposit and home equity sit outside the figure.
So $8,000 is not a measure of total household wealth. It is closer to an answer to a simpler question: how much readily accessible money does the middle American family have sitting in bank-like accounts?
The Typical Balance Is $8,000, Not $62,500
The Federal Reserve’s 2022 Survey of Consumer Finances found that 98.6% of families owned at least one transaction account. Among families with an account, the median was $8,000 and the mean was $62,500.
| Federal Reserve Measure | Balance | What It Means |
|---|---|---|
| Median | $8,000 | Half of account-holding families are below it and half are above it |
| Mean | $62,500 | Total balances divided across families, including very large accounts |
| Families with transaction accounts | 98.6% | Share owning at least one account in the category |
A mean almost 7.8 times the median is not a small statistical quirk. It says cash holdings are concentrated enough at the top that the national average stops looking much like the household in the middle.
A family with $12,000 in checking and savings, for example, is already above the national median. Comparing that family with the $62,500 mean would make its position look far weaker than the actual distribution suggests.
The Numbers Come From 2022, Even Though We Are Using Them in 2026

The 2022 Survey of Consumer Finances remains the latest completed SCF available.
The $8,000 median and $62,500 mean describe balances collected for the 2022 survey.
The SCF is still the best national source for this question. It interviewed 4,602 families in its 2022 wave and deliberately included more wealthy households than a simple random survey would.
That is important because a small number of families own a large share of financial assets. Survey weights are then used to produce estimates for the country.
Bankrate uses the same SCF data for a more detailed breakdown. Its 2026 analysis of household bank balances reports a mean of $62,410 because of differences in tabulation and rounding. For consistency, the national figure here remains the Fed’s published $62,500.
Income Produces a Much Bigger Savings Gap Than Age
People generally accumulate more cash as they get older, but age is not the strongest dividing line in the data. Income is.
In the same 2022 SCF tabulation, families in the lowest income group had a median transaction balance of just $900. At the top, households earning at least $245,400 had a median of $111,600.
| Annual Income | Median Balance | Mean Balance |
|---|---|---|
| $0 to $34,599 | $900 | $7,860 |
| $35,600 to $59,499 | $2,550 | $16,410 |
| $59,500 to $91,899 | $7,400 | $25,200 |
| $91,900 to $153,099 | $15,760 | $44,070 |
| $153,100 to $245,399 | $33,800 | $76,940 |
| $245,400 and above | $111,600 | $353,030 |
The top group’s median is 124 times the $900 held by the lowest group. Even moving from the second-highest income bracket to the highest changes the median from $33,800 to $111,600.
That is why a single national savings figure needs to be treated carefully. Someone earning $40,000 and someone earning $300,000 do not simply have different balances. They also have radically different capacity to rebuild savings after a large expense.
Geography changes the equation again. Our middle-class income by state analysis shows how the same income can support very different household budgets depending on where someone lives.
Cash Balances Usually Rise With Age, but Not in a Straight Line
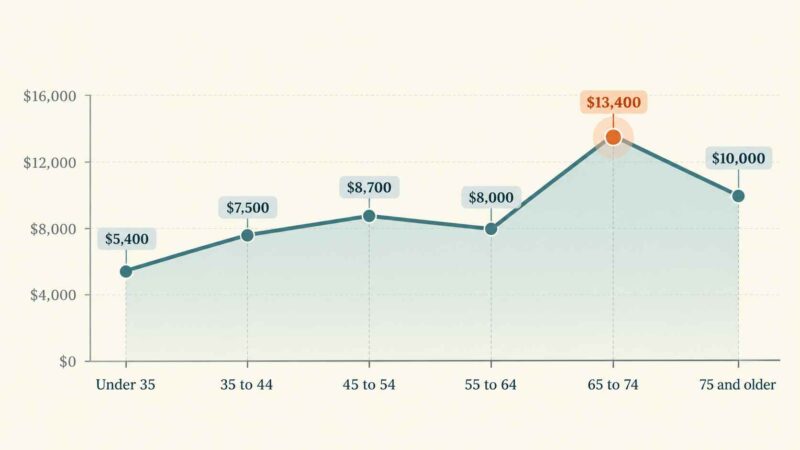
Households under 35 had a median transaction balance of $5,400. The median reached $13,400 for families ages 65 to 74, the highest figure in the age table.
| Age | Median Balance | Mean Balance |
|---|---|---|
| Under 35 | $5,400 | $20,540 |
| 35 to 44 | $7,500 | $41,540 |
| 45 to 54 | $8,700 | $71,130 |
| 55 to 64 | $8,000 | $72,520 |
| 65 to 74 | $13,400 | $100,250 |
| 75 and older | $10,000 | $82,800 |
The progression is not smooth. Families ages 45 to 54 report a higher median than those ages 55 to 64. Balances rise sharply in the 65-to-74 group and then fall after age 75.
That later decline is not surprising. Older retirees can begin drawing down the same cash they spent decades accumulating. A lower balance after 75 therefore does not automatically mean a weaker financial position.
Many of those households also own retirement assets, homes and investments that never enter the transaction-account calculation.
Family Structure Changes How Much Cash People Can Keep
Household type creates another wide split. Single parents had a median transaction balance of $2,400 in the SCF tabulation. Couples without children held $16,000.
| Household Type | Median Balance | Mean Balance |
|---|---|---|
| Single parent | $2,400 | $16,800 |
| Single, under 55, no children | $4,000 | $19,320 |
| Couple with children | $12,500 | $73,890 |
| Couple without children | $16,000 | $103,140 |
A couple without children holds about 6.7 times the median cash of a single parent. The table cannot tell us how much of that gap comes from second incomes, childcare costs, age, housing or other differences.
It does show why $8,000 means something very different for a household supporting children on one income than for a two-income household with no dependents.
The Racial Savings Gap Appears Before Housing and Retirement Wealth Are Counted
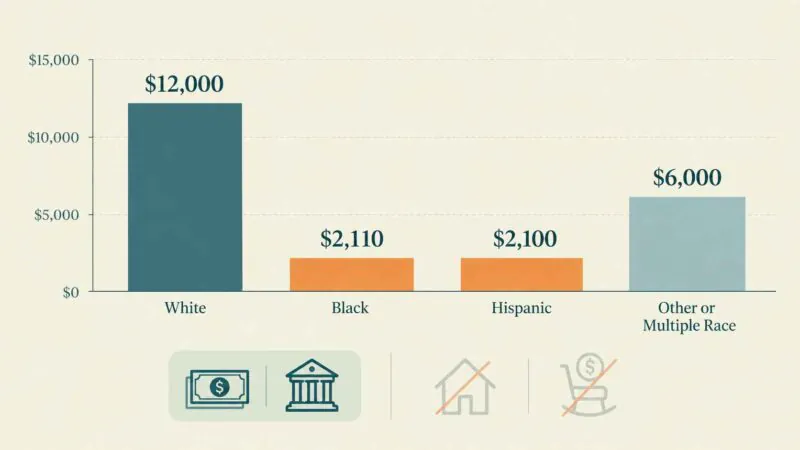
White families had a median transaction balance of $12,000, compared with $2,110 for Black families and $2,100 for Hispanic families. Those are cash-account differences before homes, retirement plans, businesses and other investments enter the calculation.
| Race or Ethnicity | Median Balance | Mean Balance |
|---|---|---|
| White | $12,000 | $80,040 |
| Black | $2,110 | $13,370 |
| Hispanic | $2,100 | $15,710 |
| Other or Multiple Race | $6,000 | $45,810 |
The White median is roughly 5.7 times the Black and Hispanic medians. Federal Reserve research finds an even larger divide once total assets and liabilities are counted.
Its analysis of racial wealth in the 2022 SCF put median wealth at about $285,000 for White families, $44,900 for Black families and $61,600 for Hispanic families.
No single cause explains those differences. Income, homeownership, inheritance, access to credit and decades of unequal asset accumulation all sit behind the final balance sheet.
Current Surveys Show How Fragile Those Balances Can Be
The SCF gives us the best detailed balance sheet, but it is several years old. A newer Federal Reserve survey asks a more immediate question: how much trouble would an unexpected expense cause right now?
The Fed’s 2025 household well-being survey, released in May 2026, found that 55% of adults had enough emergency savings to cover three months of expenses. That leaves 45% without a three-month rainy-day fund.
The same survey found that 70% could handle an expense of at least $500 using savings. Only 38% said their savings could absorb $5,000 or more. Another 30% said they could not cover three months of expenses even by borrowing, selling assets or drawing on other savings.
Income again changes the picture quickly. Only 21% of adults with family income below $25,000 had three months of emergency savings. The share rose to 39% between $25,000 and $49,999, 55% between $50,000 and $99,999, and 75% for people in households earning at least $100,000.
Bankrate arrives at somewhat different numbers. Its 2026 Emergency Savings Report found that 24% of adults had no emergency savings and only 46% could cover at least three months of expenses from those savings.
A nine-point difference between Bankrate’s 46% and the Fed’s 55% is not evidence that one survey is wrong. The surveys use different samples, wording and definitions. The useful finding is that both put a large share of adults below a three-month reserve.

An $8,000 Balance Does Not Go Very Far Against American Spending
The median becomes easier to judge when it is placed next to actual household expenses.
The latest complete annual Consumer Expenditure Survey available as of early October 2026 covers 2024. The Bureau of Labor Statistics reported average annual spending of $78,535 per consumer unit. That works out to about $6,545 per month.
At that spending level, an $8,000 balance covers about 1.2 months. Three months would require roughly $19,600 and six months about $39,300.
Normal spending and emergency spending are not the same thing. A household can cancel travel, restaurant meals and other discretionary purchases after losing income. Housing, food, utilities, insurance, transportation and minimum debt payments are harder to remove.
Housing alone averaged $26,266 in the BLS data, or about $2,189 a month. Transportation averaged another $13,318 a year. A serious reserve therefore needs to be judged against the bills a particular household cannot stop paying, not against the national median.
The 2022 balance also buys less four years later. Our U.S. inflation data tracks the price increases that have reduced the purchasing power of a fixed cash balance since the SCF was conducted.
Americans Saved 4.1% of Disposable Income in August 2026
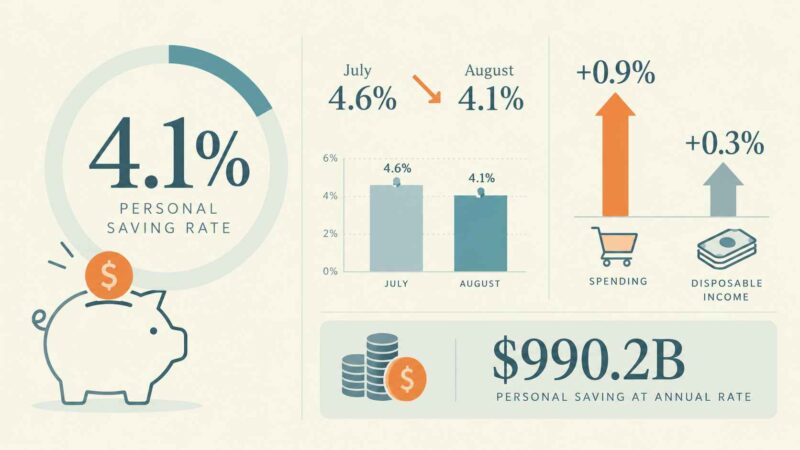
The latest economic data does not tell us the current median bank balance, but it does tell us how much income households are leaving unspent.
The Bureau of Economic Analysis put the personal saving rate at 4.1% in August 2026, down from 4.6% in July. Personal saving totaled $990.2 billion at an annual rate.
Consumer spending rose 0.9% during August, while disposable personal income increased 0.3%. Spending therefore grew three times as quickly as disposable income during the month.
The saving rate and the $8,000 median should not be blended into one statistic. The BEA rate is a flow, measuring how much current disposable income remains after spending. The SCF balance is a stock, measuring money accumulated in accounts over time.
Where the Money Sits Matters More Than It Used To
A household can have the right amount of cash and still earn almost nothing on it. The FDIC’s national rate data put the savings deposit rate at 0.38% in April 2026.
An $8,000 balance earning 0.38% produces about $30 in simple interest over a year before taxes. The national rate is not the best rate available, and some online savings accounts pay considerably more. It does show how little compensation many deposits receive.
The comparison becomes much more severe when a household is carrying credit card debt. Federal Reserve consumer credit data put the average rate on credit card accounts assessed interest at 22.15%.
| Example Using $8,000 | Rate | Simple Annual Interest |
|---|---|---|
| $8,000 in savings | 0.38% | About $30 earned |
| $8,000 revolving card balance | 22.15% | About $1,772 charged |
The credit-card figure is only an illustration because actual interest depends on daily balances and payments. The gap is large enough that the basic point survives any reasonable adjustment.
Someone holding a large cash reserve in a low-paying account while carrying expensive revolving debt can lose far more to interest than the savings account produces.
Household Debt Changes What a Savings Balance Means

The bank balance is only one side of a household balance sheet. The New York Fed reported $18.771 trillion in household debt at the end of the second quarter of 2026.
Mortgages accounted for $13.117 trillion. Auto loans reached $1.713 trillion, student loans $1.651 trillion and credit card balances $1.263 trillion. Credit card debt alone was $54 billion higher than a year earlier.
Two households can therefore have identical $20,000 bank balances and completely different finances. One may have no revolving debt. The other may owe $25,000 on cards charging more than 20%.
Our analysis of who holds U.S. debt provides more detail on the other side of American household and national balance sheets.
What the $8,000 Median Actually Means for Your Own Savings
If the question is simply “How much does the typical American family have in bank-like accounts?”, $8,000 is the best available national benchmark. The $62,500 average is useful for economists measuring total holdings, but it is badly distorted as a personal comparison.
If the question is “Do I have enough cash?”, neither number answers it. A household spending $3,000 a month on essential bills and one spending $8,000 live with completely different risks even if both have exactly $10,000 in the bank.
The newer 2026 evidence also makes clear why the national median should not be mistaken for financial security. Forty-five percent of adults do not have three months of expenses saved under the Federal Reserve measure.
The personal saving rate is only 4.1%. Credit card balances exceed $1.2 trillion, and people paying interest on those cards face rates above 22% on average.
Income remains the largest dividing line in the Federal Reserve balance data. The median rises from $900 in the lowest income group to $111,600 at the top.
@moneycoachdave This average savings by age data scares me. Why? Because the median savings for every age group isn’t even close to what you’d need for a 3–6 month emergency fund. That means millions of Americans are just one financial emergency away from falling back into the paycheck-to-paycheck cycle, or worse, into debt. Don’t be average. Build your emergency fund now. Your future self will thank you. #creatorsearchinsights #averagesavingsbyage #savings ♬ Mysterious and sad BGM(1120058) – S and N
Age, education, race and household structure create substantial differences too, but no national average can erase the effect of how much money comes in every month and how much of it is already committed.
For a household trying to judge its own position, the useful order is simple. The $8,000 median tells you where you sit relative to other families. Monthly essential expenses tell you how long your money would last.
High-interest debt tells you how quickly that reserve can be undermined. Those three numbers say far more about financial security than the $62,500 national average ever could.