The study “State Variation in Meeting the 2008 Federal Guidelines for Both Aerobic and Muscle-strengthening Activities Through Leisure-time Physical Activity Among Adults Aged 18-64: United States, 2010-2015” uncovers important insights into physical activity patterns across the country.
Lead authors Dr. Debra L. Blackwell and Dr. Tanya C. Clarke analyzed data from 2010 to 2015, revealing key state-level differences in how adults meet federal physical activity guidelines.
Some results were unexpected, like the higher percentages of adults in colder states meeting these guidelines, raising questions about how people stay active during harsh winters.
Additionally, the study observed surprising gender trends in specific states where men and women achieved similar activity levels, deviating from the usual pattern favoring men.
This analysis points to several factors, including occupational roles and health conditions, which contribute to these variations.
The findings set the stage for a deeper conversation on what drives these differences and how public health strategies can adapt to encourage greater physical activity across all demographics.
Below are the questions that aim to dig into the findings, motivations, and broader implications of this research.
Was There a Result in Your Study that You Hadn’t Expected and That Really Surprised You?
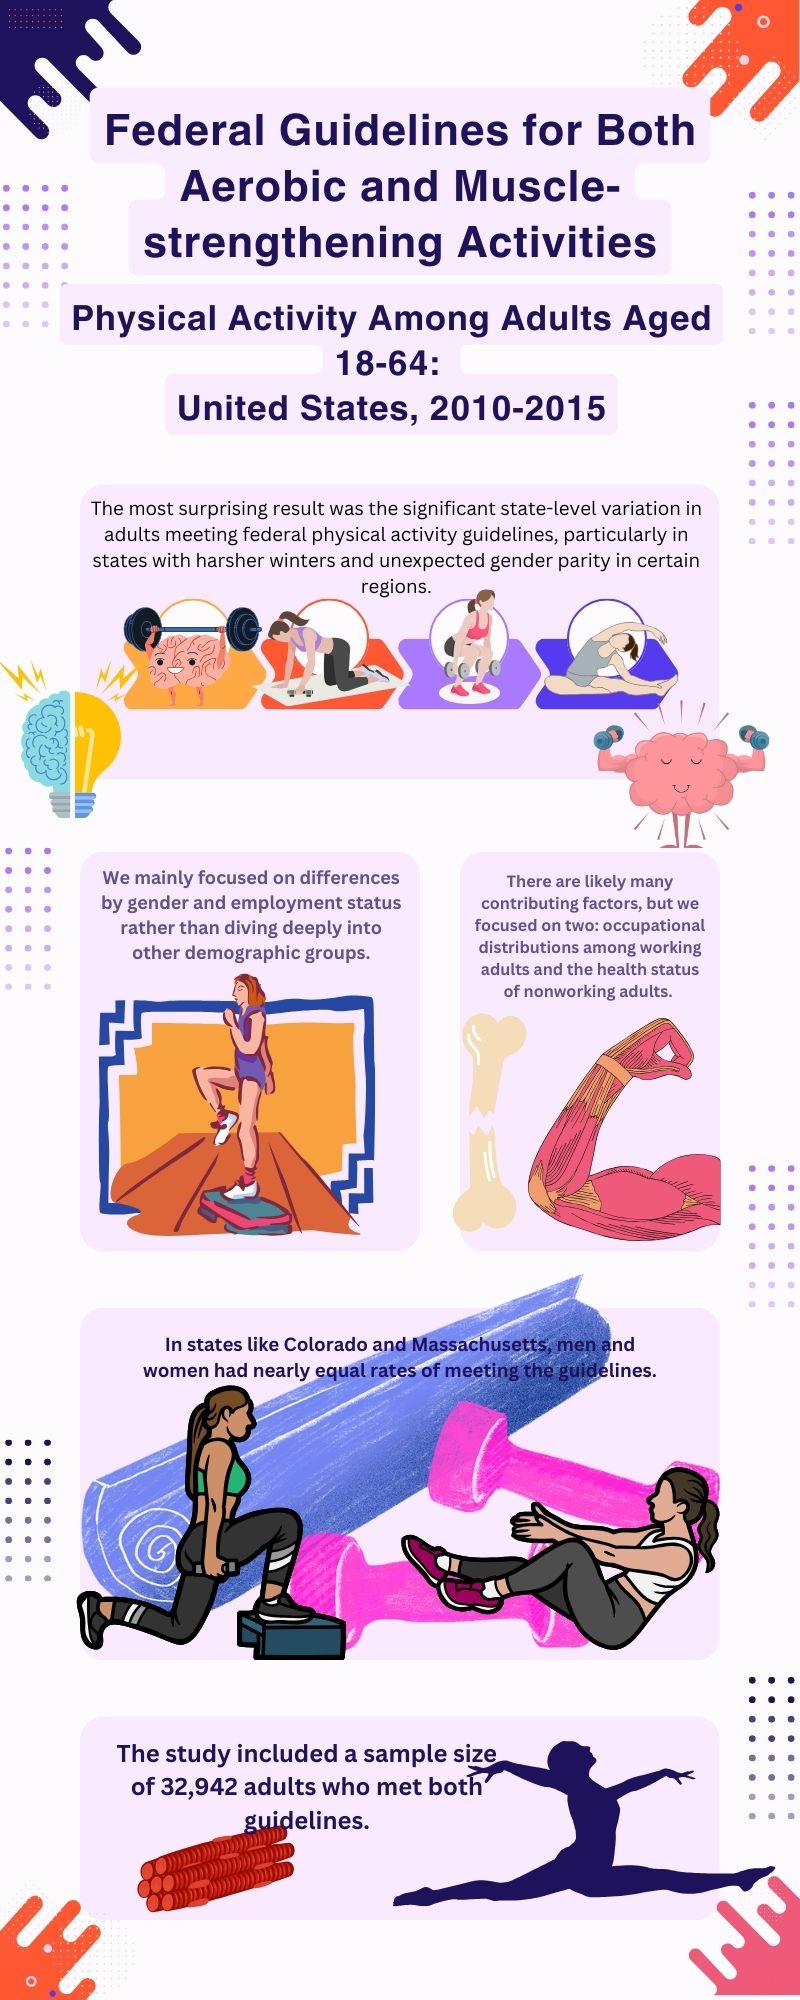
The most surprising result was the significant state-level variation in the percentages of adults meeting the federal physical activity guidelines through leisure-time physical activity.
It was especially striking to see that states with harsher winter conditions, often associated with reduced outdoor activities, had some of the highest percentages.
This led us to wonder how residents of these states maintain such high levels of physical activity during the colder months. Are they engaged in outdoor winter sports, using indoor facilities, or a combination of both?
Although our data can’t answer these specific questions, they certainly highlight an area for further research.
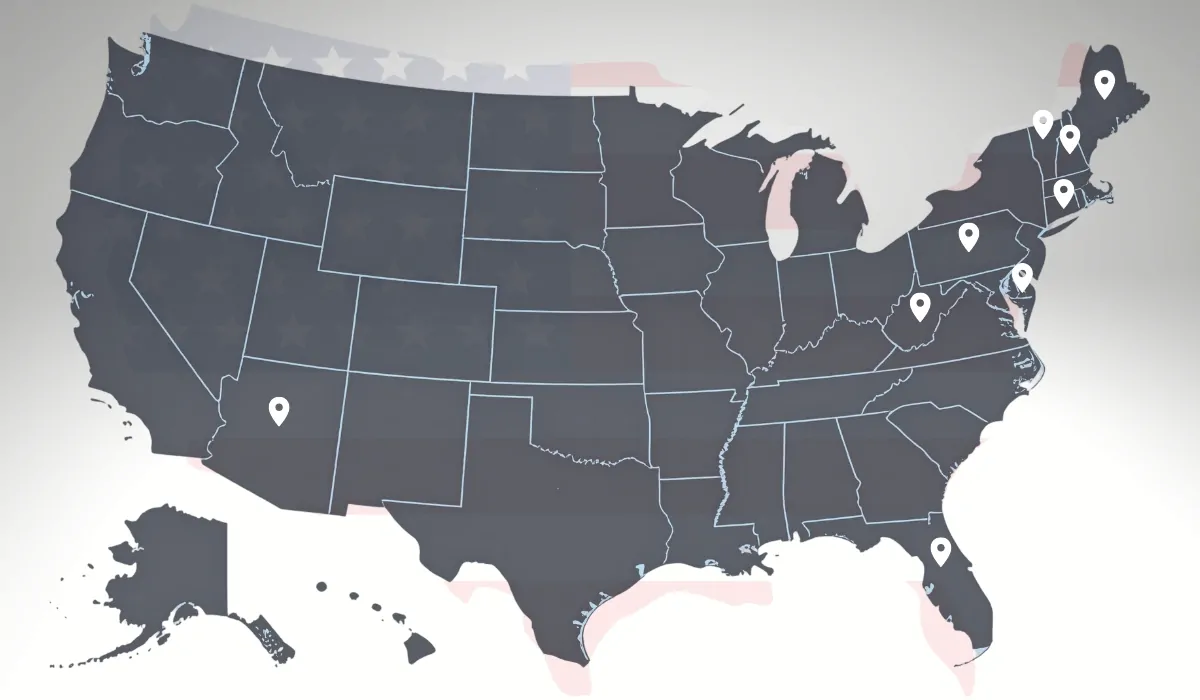
We also noted that, contrary to the usual trend of men being more active than women, certain states like Colorado, Massachusetts, Washington, New Hampshire, Utah, and Wyoming had statistically comparable percentages for both genders.
What Would You Say Is the Take-Home Message of This Report?
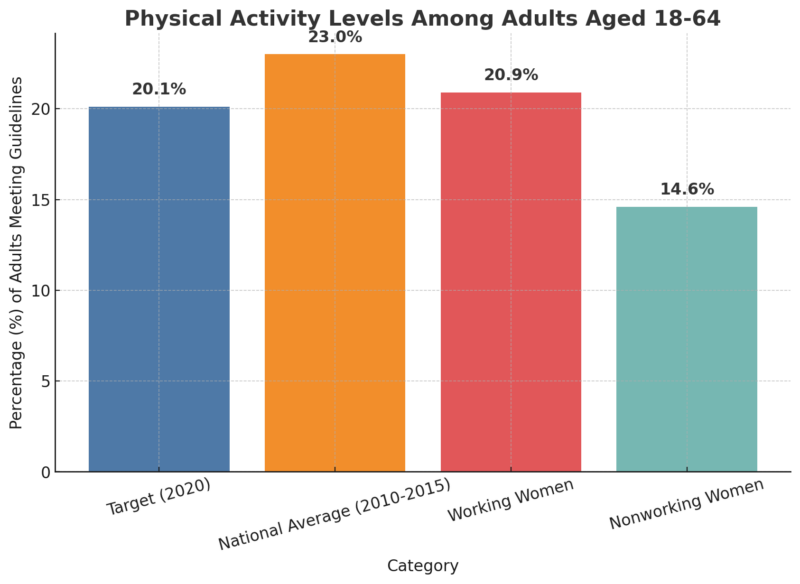
The key takeaway is largely positive. On a national scale, adults aged 18-64 are exceeding the Healthy People 2020 objective for physical activity.
The target was for 20.1% of adults to meet both aerobic and muscle-strengthening guidelines by 2020, and our data shows that nearly 23% were achieving this through leisure-time activities between 2010 and 2015.
However, when we break it down by gender and employment status, some disparities emerge.
While working women generally meet the target (20.9%), nonworking women lag significantly behind at 14.6%. Only five states—Colorado, Idaho, New Hampshire, Utah, and Washington—saw nonworking women meet the guidelines.
What Made This Study on Physical Activity Among Americans?
Our motivation stemmed from a desire to explore state-level differences, building on earlier research that focused on occupational disparities in physical activity among employed adults.
That earlier report looked at individuals rather than states and excluded those not working.
During that analysis, we noticed a clear regional variation in physical activity levels, which prompted us to expand our research to include all adults aged 18-64, regardless of work status.
Differences or Similarities Between or Among Various Demographic Groups in This Analysis?
We mainly focused on differences by gender and employment status, rather than diving deeply into other demographic groups.
Overall, men were more likely to meet the guidelines through leisure-time physical activity compared to women, but there were some exceptions.
In states like Colorado and Massachusetts, men and women had nearly equal rates of meeting the guidelines.
We also saw that working adults generally had higher rates of meeting the guidelines compared to nonworking adults, but this varied across states as well.
There are likely many contributing factors, but we focused on two: occupational distributions among working adults and the health status of nonworking adults.
States with more professionals and managers mostly had higher rates of meeting the guidelines during leisure-time compared to states with more production workers.
For nonworking adults, states with higher percentages of individuals in poor health or with disabilities had lower rates of meeting the guidelines.
These factors only scratch the surface of what influences state-level differences, but they provide a starting point for understanding these disparities.
View this post on Instagram
Various reports from the CDC provide trend data on physical activity levels.
For example, the 2014 Physical Activity State Indicator Report offers insights into how state-specific activities have changed over time.
Additionally, the National Center for Health Statistics (NCHS) provides annual data through the National Health Interview Survey (NHIS), including tables that track the percentage of adults meeting both aerobic and muscle-strengthening guidelines through leisure-time physical activity.
These resources give a broader perspective on how physical activity patterns have evolved and where improvements are still needed.
Is This the Most Recent Data on This Topic?
While we do have access to more recent data, our analysis focused on 2010-2015 NHIS data, as it was the most comprehensive dataset available when we conducted our study.
How Many People Were Surveyed for This Report?
The National Health Interview Survey (NHIS) is conducted annually, with around 35,000 adults participating each year.
For this analysis, we focused on data from 2010 to 2015, examining state-level variation among adults aged 18-64 who met the federal guidelines for both aerobic and muscle-strengthening activities through leisure-time physical activity.
The study included a sample size of 32,942 adults who met both guidelines.
Although the full dataset includes adults who met only one or neither of the guidelines, our analysis centers on those meeting both.
Percentage estimates are based on pooled data from all 50 states and the District of Columbia.
Summary
This study highlights significant differences in how adults across various states meet federal physical activity guidelines through their leisure time.
Despite overall positive trends, some groups and regions still struggle to achieve these goals.
Understanding these differences offers valuable insights for improving public health strategies and encouraging more consistent physical activity across the country.
Sources
- Blackwell DL, Clarke TC. State Variation in Meeting the 2008 Federal Guidelines for Both Aerobic and Muscle-strengthening Activities Through Leisure-time Physical Activity Among Adults Aged 18-64: United States, 2010-2015. Natl Health Stat Report. 2018 Jun;(112):1-22. PMID: 30248007.
- State Variation in Meeting the 2008 Federal Guidelines for Both Aerobic and Muscle-strengthening Activities Through Leisure-time Physical Activity Among Adults Aged 18–64: United States, 2010–2015 Debra L. Blackwell, Ph.D., and Tainya C. Clarke, Ph.D., M.P.H.
- Centers for Disease Control and Prevention. State Indicator Report on Physical Activity, 2014. Atlanta, GA: U.S. Department of Health and Human Services, 2014.
- Tina Norris Ph.D., Jeannine S. Schiller, M.P.H., and Tainya C. Clarke, Ph.D. Division of Health Interview Statistics, National Center for Health Statistics