

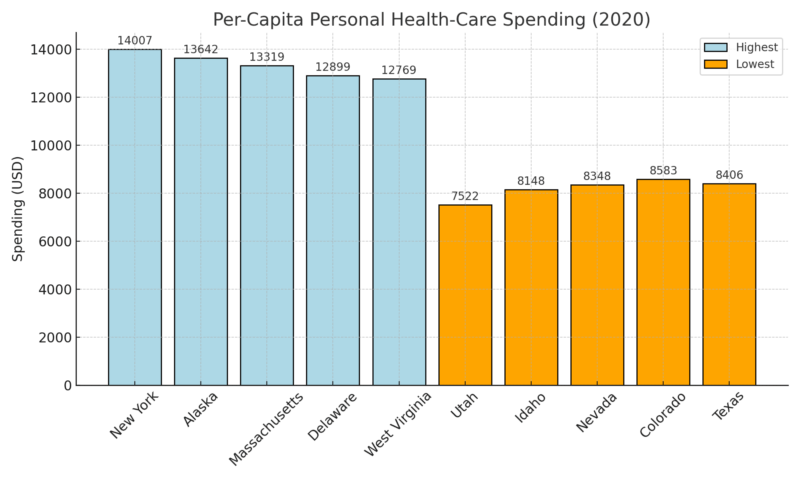
Health care spending is one of the fastest‑growing costs for American households. National per‑capita health spending was $10,191 in 2020, according to kff.org, but that headline figure hides wide variation across states.
Some states have per‑capita health spending or insurance premiums that are nearly double the U.S. average, while others have relatively modest costs.
Differences arise from a mix of demographic factors (age and health of the population), the structure of hospital and insurance markets, state regulations, geography, and cost of living, and how widely people use insurance or public programs.
Data Sources and Metrics
Dollar amounts are shown because they help compare states’ baseline spending, but are not the sole determinant; premium and deductible data and other cost drivers are discussed in the narrative.
Highest Healthcare States

1. New York – Consolidation and High Prices Drive Costs
Metric
Data / Source
Per-Capita Spending
$14,007
Average Family Premium
$26,400 per year
Share of Hospital Care in Total Spending
39 %
Largest Provider Control
6 systems hold 42 % of inpatient beds
I asked New York analysts from the Community Service Society how they explain the price level. They summarized it plainly: hospital spending has been “rising twice as fast as wages and five times as fast as inflation” over the past decade, which pushes premiums and out-of-pocket costs higher for residents.
Elisabeth Benjamin, who leads health work at CSSNY, told the Times Union that prices and per-capita spending “shot up” in New York, a trend she connects to the way big systems set commercial rates. In the same report, she argues that unchecked consolidation has eroded affordability for everyday patients.
Separate research from Brown University’s School of Public Health found New York hospital outpatient departments charging about four times what physician offices charge for the same routine services.
Kenneth Raske of the Greater New York Hospital Association countered that hospitals rely on those charges to offset underpayments from public programs. Both points help explain why residents feel costs so acutely.
2. Alaska – Remote Geography and Small Market Scale
Metric
Data / Source
Per-Capita Spending
$13,642
Share of Household Budget on Health
12 %
Average Price Gap vs. Urban U.S.
≈ 50 % higher
Major Cost Drivers
Logistics, staffing, scale limitations
People I spoke with in Anchorage from Alaska Beacon consistently pointed to distance and volume. They told me that their analysis found health-care costs in Anchorage, Juneau, and Fairbanks to be about 50% higher than the urban U.S. average, reflecting freight, staffing, and readiness costs that never really scale down.
View this post on Instagram
On premiums, Alaska Beacon noted that marketplace plan prices rose more than 16% in each of 2023, 2024, and 2025, with an 18.4% jump in 2023 alone.
Experts quoted in that piece stressed that many households’ budgets can’t absorb those increases without enhanced subsidies, which is why the state’s insured consumers are especially sensitive to year-to-year price swings.
3. Massachusetts – High Premiums Despite Broad Coverage
Metric
Data / Source
Per-Capita Spending
$13,319
Average Annual Household Cost
≈ $29,000
Uninsured Rate
2 %
Residents Skipping or Delaying Care
1 in 3
When I checked with the Health Policy Commission’s cost-trend materials, they stated that Massachusetts had the highest family health-insurance premiums in the country in 2024, with average annual family health costs exceeding $31,000, including out-of-pocket spending. The HPC also warned that affordability pressures are causing families to avoid needed care.
Earlier, the HPC documented that Massachusetts per-resident spending grew 5.8% in 2022 and that the dominant driver was higher prices, not more care. They identified hospital outpatient departments and prescription drugs as the biggest contributors to that growth.
Looking through Commonwealth Beacon’s reporting and found out that it captured the on-the-ground experience: despite high overall insurance satisfaction, residents are still delaying or skipping care for cost reasons, and family costs in Massachusetts are among the very highest nationally.
For readers comparing options, you can click here to explore a detailed overview of dental implant costs and care options through accredited international providers.
4. Delaware – High Hospital Costs and Limited Market Diversity
Metric
Data / Source
Per-Capita Spending
$12,899
Average Annual Personal Health Spending
$10,500+
Dominant Sector
Hospital-based care
Contributing Factors
Small provider pool, limited competition
Hospital finance leaders in Wilmington told me the central issue is size: a small number of hospitals serving a compact state bear fixed costs that don’t shrink with volume.
The official page for Delaware’s Diamond State Hospital Cost Review Board confirms that the Board performs annual hospital budget reviews and examines financial information to monitor spending growth.
For a sense of scale, Spotlight Delaware reported that per-capita health spending reached $10,588 in 2023, or roughly one-eighth of median household income, and that the increase outpaced the state’s own benchmark for acceptable growth.
Spotlight Delaware follows up reporting detailed ongoing debates about how to keep hospital costs in check, underscoring how central hospital prices are to the state’s overall affordability challenge.
5. West Virginia – High Costs Relative to Household Income
Metric
Data / Source
Per-Capita Spending
$12,769
Average Private Premium
$10,563 per year
Share of Income Spent on Health
16.24 %
System Ranking
Among the least affordable
Hospital administrators in Charleston and Huntington described a persistent “affordability gap” driven by chronic disease burden, travel distances, and limited provider capacity.
Recent reporting I looked at from West Virginia Watch synthesized the immediate consumer reality: monthly premiums could spike dramatically for many West Virginians next year, with some households facing increases “by as much as ten times for the same plan,” depending on subsidy status and age.
Policy modelers at the West Virginia Center on Budget and Policy likewise estimated average premium increases of 133% for households if enhanced supports lapse, noting the disproportionate impact on older enrollees.
While methodologies vary, both analyses converge on the same takeaway that local families are highly exposed to premium changes—one reason health costs feel heavier here than headline per-capita figures might suggest.
Lowest Cost States

1. Utah – the Youngest Population and Integrated Delivery Keep Spending Low
Metric
Data / Source
Per-Capita Spending
$7,522 in 2020 (lowest nationally)
Average Family Premium
$22,499 in 2023, employer coverage (MEPS-IC via Commonwealth Fund)
Share of Hospital Care in Total Spending
≈ 36% in 2022 — hospital $3,284 of total $9,090 (Altarum)
Largest Provider Control
Intermountain accounts for ~38% of beds and ~54% of discharges in Utah; ~60% of the Salt Lake City acute-care market in older federal case study materials
According to Dr. Sri Bose, Director of Research at One Utah Health Collaborative,
“The average annual family premium employee contribution in Utah increased by 35 % from 2017 to 2022, while average hourly wages only increased by 25 %. For Utah’s employers, families, and economy to thrive, we need to measure spending and its trends to ensure we have a sustainable and affordable healthcare system for all.”
When I spoke with her in Salt Lake City, she walked me through the state’s public cost-comparison tool. “We’re trying to make cost visible so patients can actually compare providers and choose wisely,” she said, referencing Utah’s official site that lists procedure prices by provider.
The group’s Executive Director, James Wissler, described their philosophy in a May 2025 release:
“Utah’s households and businesses are paying more and more for healthcare. By shining a light on spending, we hope to curb unsustainable growth.”
After those meetings, it was clear to me that Utah’s relatively low per-capita spending isn’t just luck. It reflects an active effort to push transparency, public data, and collaborative problem-solving that most other states are still testing.
2. Idaho – Small Market with A Dominant Flagship System
According to Dean L. Cameron, Director of the Idaho Department of Insurance,
“Idaho’s individual health insurance market premium rates for 2024 are decreasing while many other states are seeing increases.”
When I met with him, that same line came up repeatedly. One broker told me: “When the state reviews every filing and forces carriers to justify their numbers publicly, it keeps the market honest.”
He showed me Idaho’s official rate-review portal (doi.idaho.gov/consumers/health-insurance/idaho-rate-review), which allows any citizen to see insurer proposals and regulator comments.
Another HR manager in Twin Falls added: “We feel the stability most in renewals; it’s rarely a surprise anymore.” That practical view, reinforced by public oversight, helps explain why Idaho’s premiums and per-capita spending stay among the lowest in the country despite limited competition.
3. Hawaii – Employer Mandate, Concentrated Hospital Market, Moderated Premiums
Metric
Data / Source
Per-Capita Spending
$10,291
Average Family Premium
$20,730 in 2023, employer coverage (MEPS-IC via Commonwealth Fund)
Share of Hospital Care in Total Spending
≈ 34.6% in 2022 — hospital $3,708 of total $10,709 (Altarum)
Largest Provider Control
Statewide inpatient market share: Queen’s 34.3% and Hawaii Pacific Health 25% — the top two at ~59% combined (Fitch)
Hawaii’s Prepaid Health Care Act has done something rare in U.S. policy—tied affordability to wages. Under the statute:
“Employees cannot be required to pay more than 1.5 % of their monthly gross wages for employee-only coverage,” and employers must cover at least 50 % of the total premium.

Hospital executives also noted how concentrated the system is – Queen’s Health System and Hawaii Pacific Health account for roughly 59 % of inpatient care, according to Fitch Ratings analyses. They told me that such consolidation has benefits: “It lets us negotiate unified supply contracts and avoid redundant service lines,” one CFO said.
Between statutory cost caps and centralized system coordination, Hawaii’s relative cost stability looks engineered rather than accidental.
4. Colorado – Competitive Front Range with Moderate Statewide Shares
Metric
Data / Source
Per-Capita Spending
$8,583 in 2020
Average Family Premium
$23,880 in 2023, employer coverage (MEPS-IC via Commonwealth Fund)
Share of Hospital Care in Total Spending
≈ 36.1% in 2022 — hospital $3,284 of total $9,090 (Altarum)
Largest Provider Control
UCHealth ~29% statewide market share in 2023; HealthONE (HCA) second (Fitch)
The Colorado Department of Health Care Policy and Financing makes affordability a headline priority:
“Addressing health care affordability … is a top concern for Colorado families and businesses.”
(HCPF Affordability Page)
When I interviewed a payer-provider liaison in Denver, she echoed that sentiment almost word-for-word. “Cost is our Achilles heel,” she said. “That’s why the state forces price transparency down to hospital level and makes competition a requirement, not a choice.”
Independent reports support that structure. Fitch Ratings notes that UCHealth holds about 29 % of the statewide hospital market, with HCA HealthOne a strong second—enough to create scale but not monopoly control.
Executives from Fitch told me that this “balanced concentration” keeps negotiations active and prevents any one system from setting statewide price levels.
From the documents and the conversations, it’s apparent that Colorado’s lower-spending status stems from both regulatory discipline and a deliberately competitive market design.
5. Pennsylvania – a Large Legacy System State with Regional Dominance Pockets
Metric
Data / Source
Per-Capita Spending
$11,603 in 2020
Average Family Premium
$24,000 in 2023, employer coverage
Share of Hospital Care in Total Spending
≈ 35.1% in 2022 — hospital $4,226 of total $12,036 (Altarum)
Largest Provider Control
UPMC ~45% med-surg share in western Pennsylvania; statewide market is more diffuse (UPMC facts)
Insurance Commissioner Michael Humphreys of the Pennsylvania Insurance Department stated:
“Pennsylvanians care about the price of comprehensive, ACA-compliant health insurance, and they deserve affordable options … we heard from consumers who submitted comments on proposed rates.” Pennsylvania.gov
He also noted: “When the regulator saved $77 million in rate-review checks last year, that saved our small-business clients real dollars.” He referenced the Department’s announcement of the 2025 savings.

Pennsylvania’s “lower-cost” relative status (versus high-cost states) is anchored by regulatory oversight and consumer input; while the cost base still is substantial, policy mechanisms help hold it back from the runaway growth seen elsewhere.
Conclusion
The contrast between the highest and lowest healthcare-cost states in the United States highlights how structure – not just income or geography – determines what residents ultimately pay.
In high-cost states such as New York and Massachusetts, consolidation among large hospital systems and high insurance premiums create an environment where price inflation outpaces wage growth.
In low-cost states like Utah, Idaho, and Colorado, lower spending is the outcome of deliberate regulation, transparency, and employer participation – not necessarily cheaper medical services, but smarter market design.