
HRV measures the time variation between consecutive heartbeats in milliseconds. This variation reflects the balance between the parasympathetic (rest-and-digest) and sympathetic (fight-or-flight) nervous systems.
For most reasonably healthy adults, you will often see resting HRV somewhere between 40 and 80 ms. Some studies use 60–100 ms as a reference range, but in reality, the “right” number depends heavily on age, fitness, and how you measure it.
For example, a 25-year-old athlete may regularly see HRV values in the 70s or 80s, while a healthy 55-year-old might average closer to 30–40 ms, and that is still normal for their age group.
What Is Genuinely a Good HRV?
Vera K. Jandackova, in her study, says that a generally healthy HRV ranges from 60 to 100 milliseconds (ms).
If you are looking at your wearable and seeing 32 ms every morning, that might feel “bad” next to someone posting an 80 ms screenshot on Instagram.
In context, for a 55-year-old who sleeps okay and exercises a few times a week, that 32 ms can actually be fine.
Average HRV by Age Group
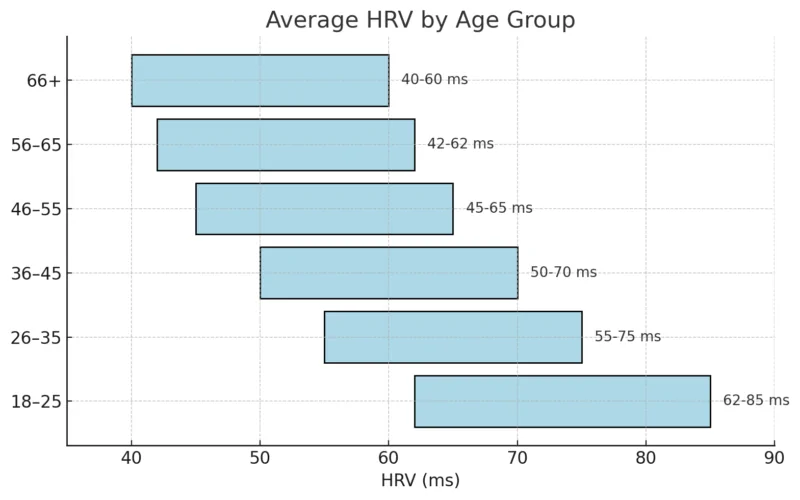
As shown, HRV decreases with age, mainly due to reduced parasympathetic nervous system activity, which is responsible for the body’s relaxation response.
This decline can be more significant in people with chronic conditions or those who lead sedentary lifestyles.
Fitness Level and HRV
View this post on Instagram
Whenever I look at my own HRV history, the biggest jumps almost always line up with periods when I’m training consistently. Fitness really does shape the way your nervous system behaves.
People who exercise several times a week, especially with a mix of cardio, lifting, and the occasional HIIT session, usually end up with steadier and higher HRV numbers over time. The heart becomes more efficient, the recovery system gets sharper, and you simply handle daily stress better.
If you were to scroll through posts from accounts like TrainingPeaks, you would see the same pattern across endurance athletes, weekend runners, and strength-focused lifters. Their HRV often rises as their training routine settles into a rhythm. It is not magic, just physiology responding to regular movement and good recovery.
@dra_says This has made a huge difference to my patients with chronic conditions. It allows me to monitor their important parameters and make micro adjustments to help. Done over a extended period of time the changes can be amazing. Educational purposes only. #heartrate #heartratemonitor #heartratevariability #heartratevariabilitytraining #doctor #privatedoctor #privategp #fibromyalgia #chronicfatigue #chronicpain #fibromyalgiawarrior ♬ original sound – Dr Ahmed
Health issues can push HRV the other direction. People dealing with diabetes, heart disease, chronic inflammation, or even just long-running bad habits like smoking or heavy drinking often see lower readings.
It is basically your nervous system signaling that it is struggling to regulate itself, even if you “feel fine” day to day.
Daily Fluctuations vs Long-Term Trends
HRV is not stable day to day. It can swing 10–20 ms (or more) depending on stress, sleep, alcohol, illness, or even the time of day.
For example, one study found that healthy young adults had HRV variability of up to 30% across a week, even without major lifestyle changes.
Don’t panic if your HRV dips one day. A bad night’s sleep or a hard workout can temporarily lower it, but the key is the overall trend over weeks or months. If your baseline is improving or stable, that’s far more meaningful than a single-day score.
Genetics and HRV Variability
Factor
Influence on HRV
Explanation
Genetic baseline
20–30% of HRV variance
Studies (e.g., Twin Research and Human Genetics, 2020) show HRV has moderate heritability.
Ethnicity
Small but measurable
Research shows slightly higher HRV averages in East Asian populations, possibly due to cultural stress-coping patterns.
Sex hormones
Strong influence
Estrogen supports vagal tone; HRV dips in the luteal phase and post-menopause.
Family cardiac history
Predictive factor
Individuals with family heart disease often have lower HRV under stress.
Whenever people start comparing their HRV scores with friends or coworkers, the same question comes up: How much of this is just the way I’m built?
The answer is, surprisingly, quite a bit. Researchers estimate that somewhere around a quarter of your HRV is tied to your genetic baseline.
Twin studies published in journals like Twin Research and Human Genetics point to moderate heritability, meaning some people simply start life with slightly higher or lower numbers.
There are also small differences across ethnic groups.
A few population studies suggest that East Asian participants tend to show slightly higher average HRV, which some researchers link to cultural patterns around stress, social cohesion, or even breathing practices.
It is subtle, but it shows up often enough to be noted in the literature.
Hormones add another layer. Anyone who tracks HRV across a menstrual cycle can see how estrogen affects vagal tone. HRV is usually higher in the follicular phase and dips during the luteal phase, and the drop becomes more noticeable after menopause.
I have had readers message me saying they thought their wearable was broken until they realized their cycle was driving half the swings.
Family cardiac history also plays a role.
People with parents or siblings who have heart disease often show sharper HRV drops under stress, even before any symptoms appear.
It does not mean something is wrong, but it does mean you might want to pay closer attention to your long-term baseline.
HRV Chart for Men and Women Based on Age
One thing every expert repeats when you ask about HRV is that it is wildly personal. Poonam Desai, M.D., a longevity-focused physician, describes it well: HRV shifts day by day and person to person, so a “healthy” number is always relative.
I have seen the same thing watching my own HRV over the years. Some weeks it feels stable, and other weeks it looks like a cliff chart for no obvious reason.
Below are the commonly cited HRV averages for men and women:
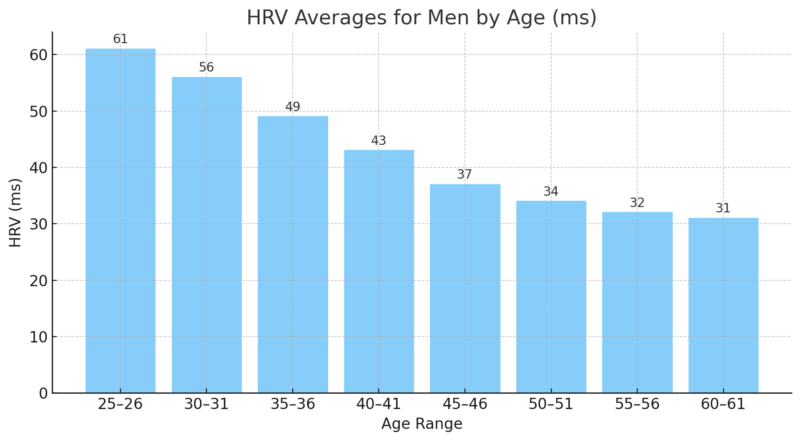
Heart Rate Variability Chart Male
| Age (Years) | Average HRV (ms) |
|---|---|
| 25–26 | 61 |
| 30–31 | 56 |
| 35–36 | 49 |
| 40–41 | 43 |
| 45–46 | 37 |
| 50–51 | 34 |
| 55–56 | 32 |
| 60–61 | 31 |
Looking at the male chart, you can see a steady slide from the early twenties into the early sixties. Most men peak around 25–26 with an average HRV of about 61 ms, then lose roughly five to seven milliseconds every few years.
When I first pulled my own numbers next to this table, the decline from my late twenties into my mid-thirties felt almost identical to the pattern you see here.
A big part of this drop is lifestyle. Many men in their thirties and forties sleep less, train inconsistently, or carry more chronic stress from work and family life.
By the time men reach their fifties, the nervous system is simply less reactive, so HRV naturally sits lower – usually in the low-to-mid 30s.
That said, landing a little above or below these averages does not mean something is wrong. HRV responds to hydration, recovery, illness, and even emotional stress.
If your number fits roughly in this range and your long-term trend is stable, you’re right where most men your age tend to be.
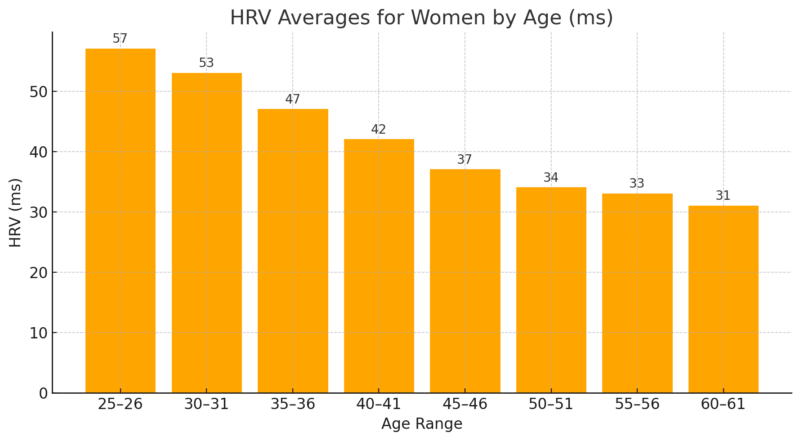
Heart Rate Variability Chart Female
| Age (Years) | Average HRV (ms) |
|---|---|
| 25–26 | 57 |
| 30–31 | 53 |
| 35–36 | 47 |
| 40–41 | 42 |
| 45–46 | 37 |
| 50–51 | 34 |
| 55–56 | 33 |
| 60–61 | 31 |
For women, the age pattern looks similar to the male chart but starts a few points lower in the mid-20s. Average HRV for women tends to begin around 57 ms in the late twenties, then gradually steps downward through the thirties and forties.
When I talked to a few women who track HRV daily, they mentioned seeing subtle monthly swings as well, which lines up with how hormonal changes influence vagal tone.
By the mid-forties and early fifties, women and men converge at almost identical HRV levels. Hormonal shifts leading up to and after menopause play a major role in that leveling-out phase, and it’s one of the reasons many women notice more predictable HRV trends in midlife.
If your HRV falls somewhere near these ranges, you’re well within normal expectations. It’s completely common for women to have week-to-week variation, especially tied to sleep and cycle-related changes. The important piece is not matching the exact number in the table, but watching whether your HRV holds steady or gently improves over time.
Rapid Decline in Early Adulthood
According to NIH, HRV decreases rapidly between the ages of 20 and 40. This decline is more pronounced in men, who typically have higher HRV than women until around age 50. The early decline may be linked to increasing responsibilities, stress, and lifestyle changes that often occur during these years.
This period also coincides with a natural reduction in physical activity and changes in sleep patterns, which can negatively impact HRV.
Leveling Out in Middle Age
After 40, the rate of HRV decline slows down, and differences between men and women diminish. By age 50, both sexes tend to have similar HRV values.
This stabilization might be due to more consistent lifestyle habits and improved stress management strategies as people age.
Additionally, many individuals in this age group become more health-conscious, incorporating regular exercise and better dietary habits into their routines.
Athlete HRV Ranges vs Sedentary Individuals
Elite endurance athletes often have HRV values >100 ms, while sedentary adults of the same age may average around 30–40 ms.
A 2021 review in the Journal of Strength and Conditioning Research showed that athletes not only have higher average HRV but also more stable daily fluctuations, which suggests better adaptability.
Sedentary adults tend to have steeper HRV decline with age and more irregular responses to stress.
Practical point: HRV is one of the clearest markers that training + recovery balance is working. Athletes use it to adjust workouts, while sedentary individuals can use HRV as a warning sign to add more activity.
What Higher HRV Actually Means for Your Body

When you zoom out from the charts and daily readings, the real value of HRV is simple: it shows how flexible and resilient your nervous system is.
A higher HRV usually means your body can shift between “go” mode and “rest” mode without fighting itself.
I’ve noticed this in my own tracking: on weeks when my HRV is higher, I sleep more deeply, digest food better, and feel less rattled by everyday stress.
Your Nervous System Works Smoother
When the parasympathetic (calm) and sympathetic (alert) systems are in balance, everything runs more efficiently. Your heart adjusts quickly, digestion feels easier, and you’re less reactive to stress.
You can see this in real time on days when you wake up refreshed: HRV rises, your body feels lighter, and even small annoyances don’t have the same effect.
A Sign That Fitness and Recovery Are On Track
Higher HRV also tends to show up in people who move regularly and recover well. Athletes see it all the time – when training is balanced, HRV climbs; when sleep drops or recovery is rushed, HRV slips.
Even if you’re not an athlete, staying active and making room for proper rest usually leads to a steadier, higher baseline.
It’s basically your heart’s way of telling you, “I can handle what you’re giving me.”
A Helpful Signal for Long-Term Health
On the flip side, consistently low HRV can be an early hint that your body is under pressure, according to Medical News.
You’ll often see lower numbers in people dealing with chronic stress, inflammation, anxiety, depression, or cardiovascular issues. You might feel “fine,” but HRV can catch subtle strain before symptoms show up.
Resting Heart Rate (RHR) + HRV Correlation
RHR and HRV are closely linked:
Metric
Healthy Range
What It Suggests
Resting HR < 60 bpm
High HRV
Fit cardiovascular system, good recovery
Resting HR 60–75 bpm
Moderate HRV
Average fitness, normal stress balance
Resting HR > 75 bpm
Low HRV
Possible stress, illness, or low fitness
If your RHR goes up and HRV goes down together, it’s usually a sign your body is under stress.
Factors Influencing HRV
Several factors can significantly impact heart rate variability, making it essential to understand what influences these fluctuations to maintain or improve overall health.
Genetics
Important note about HRV from @PeterAttiaMD Be sure to read: https://t.co/ByaQge1RsG
— Andrew D. Huberman, Ph.D. (@hubermanlab) February 27, 2022
Your genetic makeup plays a significant role in determining your HRV. Some people naturally have higher or lower HRV.
Genetic predispositions can influence how your body responds to stress and recovers from it. Understanding your genetic tendencies can help tailor lifestyle choices to optimize HRV.
Age and Sex
As the years go by, HRV naturally trends downward. Most men start a little higher than women in their twenties and thirties, and that gap usually holds until around age 50.
The difference isn’t dramatic, but it shows up consistently in long-term datasets.
Hormones explain a lot of this. Estrogen tends to support higher vagal tone, so women often see more month-to-month fluctuation tied to their cycle.
Men, on the other hand, tend to have steadier patterns earlier in life but steeper declines once stress, work demands, and sleep changes pile up.
After about 50, the numbers begin to converge. Hormonal shifts, especially the transition through menopause, flatten the curve for women, and both groups end up in a similar HRV range. By that stage, lifestyle, sleep quality, and overall health habits play a far bigger role than sex differences.
Health Conditions

Conditions like cardiac arrhythmia can significantly affect HRV. According to government sources of health sources, other chronic illnesses, such as diabetes and hypertension, also negatively impact HRV.
Regular monitoring can help manage these conditions by providing insights into how lifestyle changes impact overall health.
Hormonal Changes
Hormones have a noticeable impact on HRV, especially for women.
Menstruation, pregnancy, and the transition through menopause can all shift HRV up or down from week to week. Anyone who tracks their numbers closely usually sees this firsthand.
HRV often dips in the late luteal phase, rises again after a new cycle starts, and becomes more unpredictable during pregnancy. After menopause, the pattern settles into a steadier rhythm as hormone levels change.
These swings are normal, not a sign that something is “wrong.”
Stress and Mental Health
When you’re stressed, your body’s fight-or-flight response becomes more active, reducing parasympathetic activity and, in turn, lowering HRV according to NCBI.
Practices like mindfulness, meditation, and adequate sleep can help manage stress levels and improve HRV, contributing to better mental and physical well-being.
Best Science-Backed Ways to Improve HRV
You have great bullet points, but you can make it more practical by dividing them into categories.
Category
Evidence-Based Strategy
Example
Physical
Aerobic + resistance training
Improves HRV and reduces inflammation
Stress management
Mindfulness, box breathing
Lowers cortisol and raises HRV in 4 weeks
Sleep hygiene
Consistent bedtime, dark room
Sleep interventions increased HRV by 12–15%
Nutrition
Mediterranean diet, omega-3s
Anti-inflammatory diets raise HRV baseline
Environment
Cold exposure & sauna
Activates vagal tone; HRV boost seen after 10 mins in cold immersion
How to Improve HRV
- Engage in practices like gratitude journaling and mindfulness meditation. These activities help reduce stress and improve HRV.
- Using saunas and ice baths can stimulate your ANS and improve HRV.
- Building strong relationships and a supportive social network enhances your mental and emotional well-being, positively impacting HRV.
- Simple breathing exercises can quickly relieve stress and boost HRV.
- A balanced, whole-food diet supports overall health and helps maintain a good HRV.
- Regular, quality sleep is crucial for recovery and maintaining a high HRV, as stated by NIH.
- Engage in regular physical activity, but be cautious of overtraining, which can negatively impact HRV.
- Proper hydration is essential for maintaining good HRV. Supplement with electrolytes if needed, especially during intense exercise or hot weather.
Best HRV Trackers & Apps
Placement: after “Factors Influencing HRV.”
Not all wearables measure HRV equally. The most cited and reliable options are:
Device/App
HRV Method
Strengths
Notes
Whoop Strap
Photoplethysmography (PPG) during sleep
Very detailed recovery insights
Subscription required
Oura Ring
PPG overnight
Strong sleep + HRV correlation data
Tracks trends, not instant changes
Apple Watch (Series 4+)
PPG via Health app
Easy, accessible
Best for spot checks, not deep trends
Garmin (HRV Stress test)
ECG-like chest strap or optical HR
Great for athletes, training integration
More accurate with the chest strap
Elite HRV app
Chest strap required
Research-grade accuracy
Best for serious tracking
Looking at the options side by side, the main difference comes down to how serious you are about long-term tracking. Devices like the Oura Ring and Whoop Strap pull HRV from your entire sleep window, which tends to give the most stable and meaningful baseline.
When I compared my own overnight numbers to daytime spot checks from an Apple Watch, the gap was obvious; overnight data is simply smoother and less affected by noise.
View this post on Instagram
Garmin is a strong middle ground, especially for people who already train with a Garmin watch. Paired with a chest strap, its HRV readings can get surprisingly close to research-grade accuracy. It’s not as “hands-off” as Oura or Whoop, but athletes usually like the extra control.
Apple Watch is great for casual checks, but not ideal if you want a clear, long-term trend. It measures HRV in short bursts so that you can see quick changes, but you don’t get the full overnight picture that coaches and researchers rely on.
Elite HRV is the technical option, a chest-strap app that appeals to people who prioritize accuracy over convenience. It’s the kind of tool you use when you’re dialing in stress testing or training blocks, not just checking recovery after a tough week.
Final Words
@drjeremylondon What is HRV and what does it say about your health? #doctor #surgeon #fitness #hrv #fypシ ♬ original sound – Dr. Jeremy London, MD
Heart Rate Variability (HRV) is a reliable metric for assessing your stress levels, recovery, and overall autonomic nervous system balance.
A higher HRV is generally a sign of better cardiovascular health, resilience, and fitness, while a consistently low HRV may indicate chronic stress, poor recovery, or underlying health issues.
If you’re aiming to improve your HRV, focus on the following actions:
- Get 7–9 hours of high-quality sleep consistently
- Incorporate regular aerobic and strength-based exercise, avoiding overtraining
- Practice daily stress-reduction techniques like deep breathing or meditation
- Eat a balanced diet rich in whole foods and low in processed sugars
- Limit alcohol, caffeine, and nicotine intake
- Stay hydrated and ensure proper electrolyte balance
- Build and maintain supportive social connections
Track HRV trends over time rather than focusing on daily fluctuations. Use it as one part of a broader health strategy, alongside other indicators like sleep quality, energy levels, and resting heart rate.
Making small, consistent adjustments to your lifestyle can lead to measurable improvements in HRV – and more importantly, in long-term health.
References:
- Kim HG, Cheon EJ, Bai DS, Lee YH, Koo BH. Stress and Heart Rate Variability: A Meta-Analysis and Review of the Literature. Psychiatry Investig. 2018 Mar;15(3):235-245. doi: 10.30773/pi.. 2017.08.17. Epub 2018 Feb 28. PMID: 29486547; PMCID: PMC5900369.
-
Chalmers T, Hickey BA, Newton P, Lin CT, Sibbritt D, McLachlan CS, Clifton-Bligh R, Morley JW, Lal S. Associations between Sleep Quality and Heart Rate Variability: Implications for a Biological Model of Stress Detection Using Wearable Technology. Int J Environ Res Public Health. 2022 May 9;19(9):5770. doi: 10.3390/ijerph19095770. PMID: 35565165; PMCID: PMC9103972.
-
Jandackova VK, Scholes S, Britton A, Steptoe A. Are Changes in Heart Rate Variability in Middle-Aged and Older People Normative or Caused by Pathological Conditions? Findings From a Large Population-Based Longitudinal Cohort Study. J Am Heart Assoc. 2016 Feb 12;5(2):e002365. doi: 10.1161/JAHA.115.002365. PMID: 26873682; PMCID: PMC4802439.
-
Bonnemeier H, Richardt G, Potratz J, Wiegand UK, Brandes A, Kluge N, Katus HA. Circadian profile of cardiac autonomic nervous modulation in healthy subjects: differing effects of aging and gender on heart rate variability. J Cardiovasc Electrophysiol. 2003 Aug;14(8):791-9. doi: 10.1046/j.1540-8167.2003.03078.x. PMID: 12890036.
- DHSS – Healthy Living – Health Conditions & Diseases