The Fourth of July is more than a national holiday—it’s a $15+ billion economic juggernaut that brings Americans together for food, fireworks, and travel on a scale unmatched by any other summer event.
In 2024, Americans spent an estimated $15.5 billion preparing for Independence Day, with almost 300 million people celebrating, according to Capital One Shopping.
Food, alcohol, and fireworks dominate the shopping lists, while travel numbers are reaching record highs in 2025.
As we head into July 4th, 2025, most Americans will shop in advance, spend between $25 and $100 per person, and—more than ever—take to the roads and skies for extended getaways
Metric
2024 Number/Stat
2025 Forecast / Note
Total Spending
$15.5 billion
Expected to rise
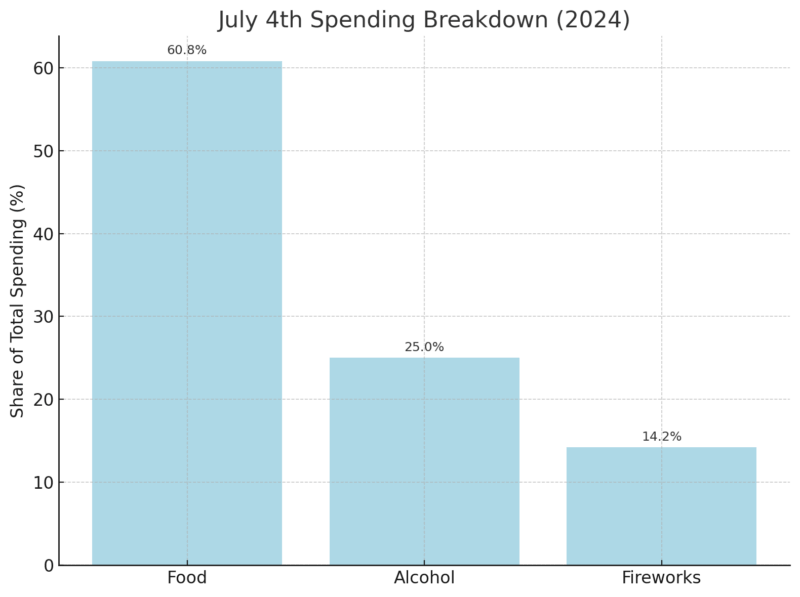
Spending on Food
$9.4 billion
The majority of spend
Spending on Alcohol
$3.87 billion
Beer dominates
Spending on Fireworks
$2.2 billion
27.5% bought fireworks
Share Celebrating
87% (2024)
70% plan to celebrate (2025)
Share Shopping
91% of celebrators (2024)
95% of celebrators (2025)
Avg. Food Spend/Person (2024)
$90.42
$2.92 less than 2023
Avg. Cookout for 10 People
$71.22
$7.12 per person, food only
Share Buying Food (2025)
83% of celebrators
Share Buying Alcohol (2025)
44% of celebrators
Share Shopping Online
13% (2024)
14% (2025)
Travelers (2025 AAA projection)
72.2 million (record)
July 4th Population (2024 est.)
340.1 million
—
Travel: July 4th 2025, Sets a New Record
View this post on Instagram
Metric
2024
2025 Forecast
Total Travelers (50+ miles)
~70 million
72.2 million (record)
Road Travelers (car)
61.6 million
Up 2.2% YoY
Air Travelers
5.74 million
5.84 million (record)
Bus/Train/Cruise Travelers
4.62 million
4.78 million (record)
- Road trips are king: 90% of West Virginians and most Americans drive.
- Airfares: Average round-trip is $810, up 4% YoY.
- Top US destinations: Orlando, Seattle, New York, Anchorage
- Top international: Vancouver, Rome, Paris
- Best travel times: Mornings, especially to avoid peak congestion July 2 and July 6
Fourth of July Food Spending, 2014–2024 (Billions)
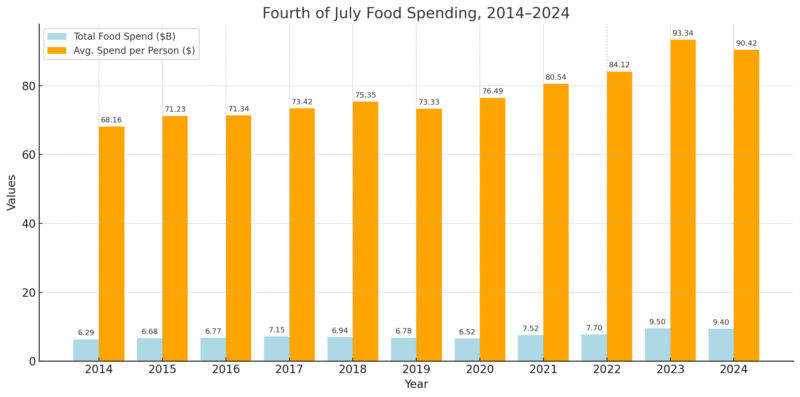
Over the last decade, July 4th food spending has increased by nearly 50%, rising from $6.29 billion in 2014 to $9.4 billion in 2024. This growth outpaced population increases, reflecting both inflation and Americans’ growing enthusiasm for holiday celebrations, even during years of economic uncertainty.
Notably, the average spend per person climbed from $68.16 to $90.42 in that same span, a jump of more than $22 per person (or +32.7%), according to National Retail Federation data.
There was a significant leap between 2022 and 2023, likely driven by post-pandemic “revenge spending” and inflation, with average per-person food spending jumping by over $9 in one year. Despite a minor dip from $9.5 billion in 2023 to $9.4 billion in 2024, costs remained high, and the price of a basic cookout rose 5.15% year-over-year.
This persistent upward trend demonstrates that Independence Day remains America’s favorite summer occasion for gathering and grilling, with millions willing to absorb higher prices rather than cut back on traditional foods.
Expected July 4th Spending per Person, 2025 (Numerator)
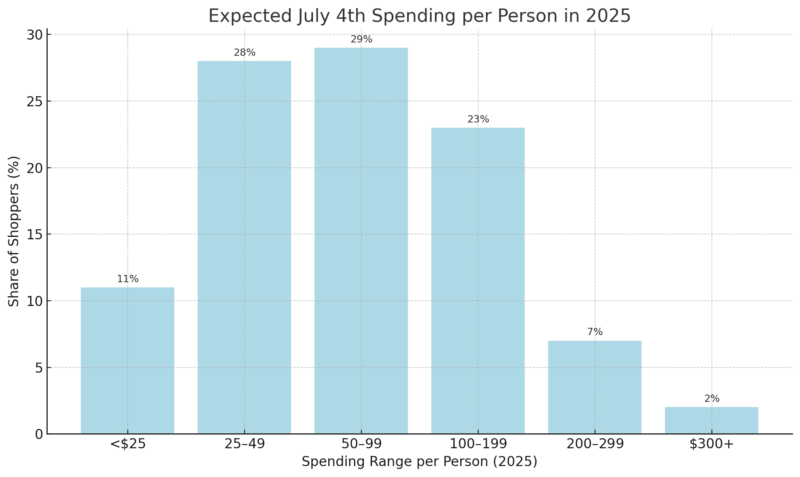
Spending intentions for July 4th in 2025 show just how broad the holiday’s economic reach has become.
According to Numerator survey data, only 11% of Americans plan to spend less than $25 on the holiday, highlighting that budget celebrations are a minority. The largest group of shoppers—29%—intend to spend between $50 and $99, while a further 28% expect to spend $25–$49.
Notably, almost one in three shoppers (32%) are budgeting at least $100 for the festivities, with 7% setting aside $200–$299 and another 2% planning to splurge $300 or more. This distribution underscores that the Fourth of July is not just a day for backyard BBQs but a serious retail event, driven by a mix of tradition, inflation, and the desire to entertain family and friends in style.
The fact that nearly one-third of Americans are prepared to spend $100 or more—despite higher food prices and cost-of-living concerns—speaks to the enduring appeal and importance of Independence Day in American culture.
What’s in the Shopping Cart?
Most Popular Purchases
Average Cost of July 4th Cookout Items (2024)
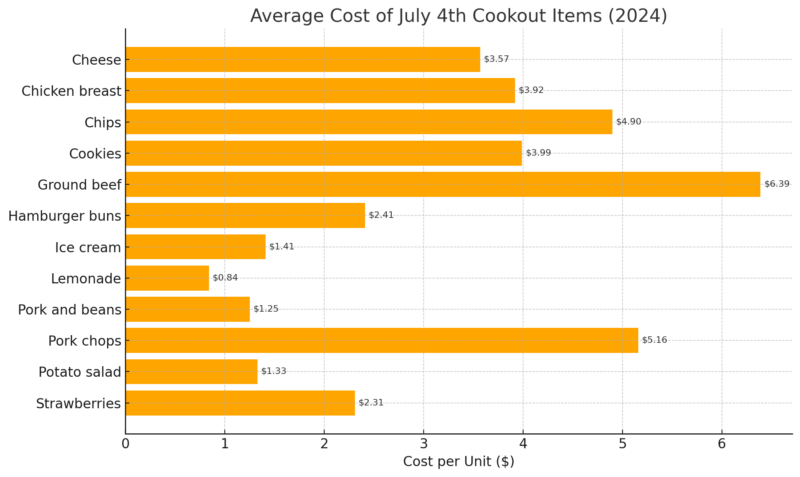
Alcohol: A Billion-Dollar Holiday Staple
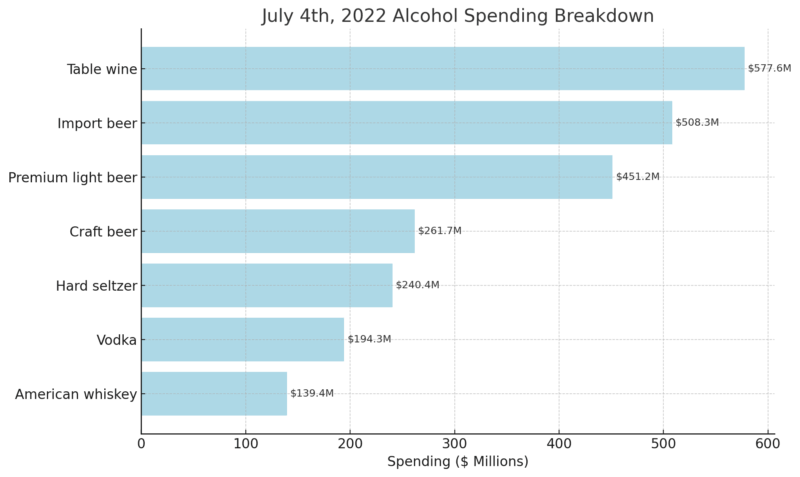
Alcohol spending is a major part of the July 4th:
- $3.87 billion spent in 2024 on alcohol for Independence Day.
- Beer, cider, and flavored malt beverages (FMBs) accounted for 62.9% of sales.
- $2.4 billion spent on beer, cider, and FMBs.
- $536 million on wine.
- $900 million on spirits (whiskey, vodka, etc.).
- Hard seltzer and ready-to-drink cocktails are growing rapidly.
July 4th, 2022 Alcohol Spending Breakdown
Generational Split (Numerator)
- Beer: 69% Millennials, 73% Gen-X, 79% Boomers
- Wine: 37% Millennials, 32% Gen-X, 55% Boomers
- Spirits: 39% Millennials, 35% Gen-X, 31% Boomers
- Hard Seltzer: 46% Millennials, 32% Gen-X, 11% Boomers
July 4th Fireworks Costs by Year
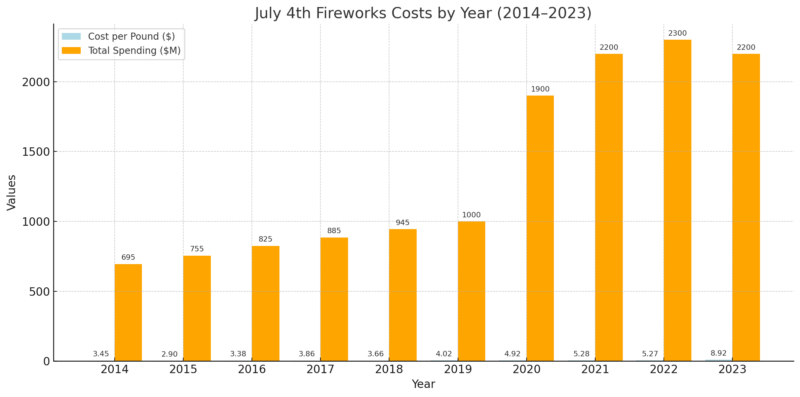
Fireworks have become one of the most explosive categories in July 4th spending—literally and financially. In 2024, Americans spent a staggering $2.2 billion on fireworks, continuing a decade-long upward trend both in terms of total outlay and the cost per pound, as noted by Fire Cash Buyers.
Prices per pound have nearly doubled since 2014, climbing from $3.45 to $8.92 in 2023 before holding steady at high levels in 2024.
The surge is partly attributed to supply chain disruptions, higher demand post-pandemic, and inflation affecting import costs—$470 million worth of fireworks were imported into the US in 2024 alone.
While total spending dipped slightly from the all-time high of $2.3 billion in 2022, consumer enthusiasm remains strong: the average fireworks buyer in 2024 spent about $27 and took home roughly three pounds of pyrotechnics.
Participation rates are high, with nearly one in three July 4th celebrants purchasing fireworks last year. With fireworks prices and popularity both surging, it’s clear that lighting up the night sky remains a cherished and growing tradition in America’s Independence Day celebrations, contributing a significant share to the overall July 4th economy.
Where and When Americans Shop for July 4th
Shopping Location/Timing
2024 (%)
2025 (%) (forecast)
Grocery stores
63
59
Big box/mass retailers
54
49
Liquor stores
26
—
Discount stores
20
—
Local small businesses
15
—
Online
13
14
Begin shopping ≥1 week early
74
77
When it comes to July 4th preparations, Americans overwhelmingly prefer to shop in person, with grocery stores remaining the cornerstone of holiday spending. In 2024, 63% of consumers shopped at grocery stores for their July 4th supplies, and while this figure is projected to dip slightly to 59% in 2025, supermarkets remain by far the most common destination.
Big box and mass retailers, such as Walmart and Target, follow closely behind, attracting 54% of shoppers in 2024 and an expected 49% in 2025. Liquor stores (26%), discount outlets (20%), and local small businesses (15%) also see significant foot traffic during the lead-up to Independence Day, but these categories lag well behind the big retail players.
Despite the ongoing growth of e-commerce, online shopping is still a minority choice for July 4th. Only 13% of consumers shopped online in 2024, with a slight increase to 14% forecast for 2025.
This trend shows that most shoppers want to pick out their food, beverages, and party supplies in person—perhaps to ensure freshness, compare prices, and take advantage of last-minute sales or in-store deals.
Timing is another crucial aspect of July 4th shopping behavior. Most consumers plan well ahead, with 74% starting their holiday shopping at least one week in advance in 2024, and an even higher 77% expected to do so in 2025.
This advance planning is likely driven by the desire to avoid crowded stores, secure the best product selection, and ensure nothing is forgotten for the big day.
With the Fourth of July being one of the peak grocery and party supply shopping weeks of the year, early and in-person shopping remains the norm, highlighting the enduring value of traditional retail in the age of digital commerce.
Who Celebrates and How Much They Spend
- 2024: 87% of Americans planned to celebrate; 33% spent over $100, and just 9% spent under $25, according to WSAZ.
- 2025: 70% say they’ll celebrate; 95% of celebrators will make a purchase.
Spending Breakdown (2024)
The Historical Perspective: From 13 Colonies to 340 Million
- July 1776: 2.5 million people lived in the 13 colonies.
- July 2024: 340.1 million Americans—nearly 140x growth.
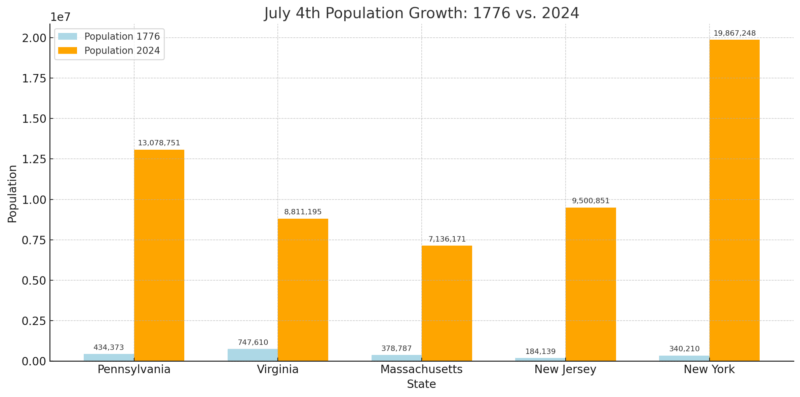
Independence Day then and now: 56 signers, a committee of five drafted the Declaration, and the celebration has grown from parades and speeches to cookouts, block parties, and billion-dollar shopping sprees.
Fun Facts and Oddities
- Hot dog stats: 150 million dogs consumed each July 4th; $73.1 million spent just on hot dogs according to NHDSC.
- Fireworks imports (2024): $470 million
- US flags imports: $4.7 million; exports: $2 million
- Number of businesses (2022): 183 BBQ appliance makers, 266 paper plate/cup makers, 751 snack food manufacturers
Dealing with Inflation: 2023–2024
- 52% of shoppers sought more sale items in 2023.
- 31% picked more budget meals/snacks.
- 27% used coupons; 20% shopped at dollar/discount stores.
- 16% bought more generics; 11% downsized purchases.
Conclusion
Americans expected to spend less on the Fourth of July this year https://t.co/8XGtXoLAh0
— WAVE (@wave3news) July 1, 2024
The Fourth of July is far more than a symbolic day of American independence—it’s an annual economic powerhouse that radiates through almost every aspect of consumer life.
With more than $15 billion in holiday-related spending, Independence Day demonstrates the strength, resilience, and evolving habits of the American consumer.
What’s Good?
The data makes it clear that July 4th continues to bring people together on a grand scale. Despite inflation, the vast majority of Americans refuse to cut back on celebrations or traditions. From backyard barbecues to dazzling fireworks displays, people are still willing to spend for the sake of community, family, and national pride.
Retailers, especially grocery stores and mass merchandisers, see some of their biggest surges of the year, driving not only food sales but also increases in seasonal items, alcohol, decorations, and party supplies.
The holiday’s effect ripples well beyond retail. Record-breaking travel numbers for 2025 signal strong consumer confidence and pent-up demand for experiences, with over 72 million Americans expected to hit the roads or take to the skies. The travel industry, including airlines, car rentals, hotels, and even cruise lines, reaps major rewards from this brief but powerful surge.
What’s Challenging?
Of course, there’s a flip side. Rapidly rising costs—especially for food and fireworks—mean that many families must budget more carefully. While most Americans still participate, the share planning to celebrate has dipped a bit from 2024 to 2025, and the focus on sales, discounts, coupons, and store brands is stronger than ever.
For some, the cost of traditional foods and supplies may put a damper on celebrations or force adjustments in what and how they buy. Inflation-driven price increases in fireworks, cookout items, and travel mean a higher overall bill, even for those trying to keep spending modest.
Economic Overview and Broader Effects
@abcnewslive A record of 72 million people are excepted to travel for the July 4th holiday within the U.S., AAA predicts, but severe weather is complicating travel plans for many. #news #july4th #travel #severeweather #fourthofjuly ♬ original sound – ABC News Live
What stands out is how Independence Day acts as a real-world barometer for the U.S. economy. When Americans are buying more, traveling further, and spending on experiences, it’s a sign of relative economic optimism.
The spike in July 4th spending supports millions of jobs—not only in retail and food production, but in logistics, travel, entertainment, and local businesses from small-town butchers to fireworks vendors.
Even with inflationary pressures, Americans’ willingness to spend (and adapt how they spend) reflects a blend of tradition, resilience, and the pursuit of shared experiences. For brands and retailers, July 4th is a crucial period to showcase value, innovation, and community engagement.
For the country, it’s a moment when economic energy meets national identity, proving year after year that the spirit of celebration remains as strong as ever.