

Illegal immigration remains one of the most debated issues in U.S. policy. By 2025, the U.S. had an estimated 14 million illegal immigrants, reversing a long decline that followed the 2007 peak of 12.2 million.
According to the Pew Research Center (2025 release), six states, California, Texas, Florida, New York, New Jersey, and Illinois, continue to host the majority of these residents.
Meanwhile, the U.S. Customs and Border Protection (CBP) recorded more than 11 million border encounters between October 2019 and June 2024, a figure roughly equal to the entire population of Georgia, highlighting the scale of migration pressures.
Key Takeaways
Border Encounters and Enforcement
When looking at illegal immigration, it’s impossible to separate the conversation from border encounters, the closest proxy the U.S. has to measuring migration flows.
Between 2019 and 2024, U.S. border officials recorded about 11 million encounters with illegal migrants. To put that into perspective, that figure is nearly the size of the entire population of Georgia.
The surge reached its most dramatic point in December 2023, when officials reported 370,000 encounters in a single month. That equals an average of 12,000 people per day attempting to cross into the country.
The numbers underscore the scale of migration pressures facing U.S. authorities during this period, shaped by global displacement crises, U.S. economic demand for workers, and shifting asylum dynamics.
But history shows this isn’t the first time the U.S. has experienced such waves, only the patterns have changed.
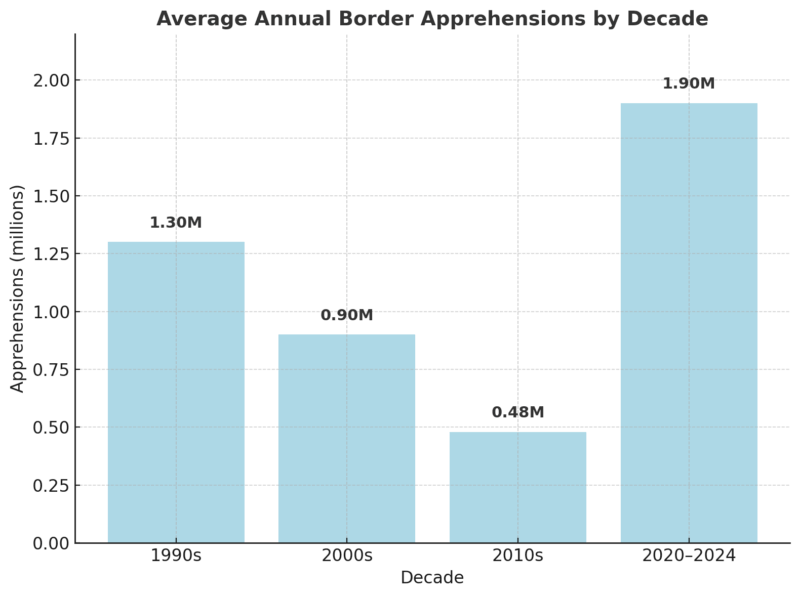
During the 1990s, annual apprehensions averaged 1.3 million, fueled largely by Mexican migration. By the 2010s, that number dropped below half a million as Mexican migration slowed and enforcement strategies improved.
But from 2020 to 2024, the average more than tripled again, hitting nearly 1.9 million encounters annually, reflecting broader global migration flows, not just Mexico.
Enforcement efficiency has also changed. According to CBP, the apprehension rate, the share of attempted crossings stopped at the border, improved dramatically, from about 35% in the early 2000s to nearly 78% between 2018 and 2020.
In practical terms, this means far fewer successful entries compared to earlier decades, even as total attempts surged. Stricter technology, expanded surveillance, and more agents along the border all contributed to this tighter control.
1. California
View this post on Instagram
California remains the single largest host, with 2.3 million illegal residents. However, the state is notable because its numbers have actually declined, down by about 120,000 since 2019.
Several factors drive this: slower job growth in agriculture compared to earlier decades, rising housing costs that push migrants elsewhere, and established legal migration pathways that reduce illegal flows.
Despite the decline, California continues to be a hub because of its long history of immigration networks, particularly in Los Angeles and the Central Valley.
2. Texas
Texas has 2.1 million illegal immigrants, and its numbers are still climbing, about 85,000 more since 2019. Proximity to the border makes Texas a first entry point, and its rapidly growing economy creates strong demand for labor.
Construction, hospitality, and energy-related industries provide steady job opportunities. Border cities like El Paso and larger metros like Houston and Dallas both contribute to the state’s growth in illegal populations.
3. Florida
Florida is one of the biggest stories of the last five years. Its illegal immigrant population jumped by an estimated 400,000 between 2019 and 2024, reaching 1.6 million in 2023.
Unlike Texas and California, Florida’s increase is tied not just to proximity or historical migration, but to newer flows from the Caribbean and South America.
Venezuelan and Haitian migrants, in particular, have driven much of this growth, settling heavily in South Florida communities like Miami-Dade and Broward County. Florida is now considered the fastest-growing hub for illegal immigrants in the U.S.
4. New York
New York holds about 830,000 illegal residents, a relatively stable figure in recent years. Unlike states in the South, New York’s immigrant population is shaped by long-standing diversity, with large communities from Latin America, Asia, and Africa.
Economic opportunities in service industries, healthcare, and construction still attract migrants, but the city’s high cost of living limits additional growth compared to states like Florida or Texas.
5. New Jersey

New Jersey, with 600,000 illegal immigrants, has also seen stability rather than growth. Its immigrant population is tied closely to New York City’s metropolitan labor market, with strong representation in service jobs, warehousing, and logistics along the I-95 corridor.
The state benefits from established networks that support both lawful and illegal immigrants, though housing costs and tighter job markets may have capped new inflows.
6. Illinois
Illinois rounds out the top six, with 550,000 illegal immigrants. Like New Jersey, its numbers have remained stable. Most of the state’s population is concentrated in Chicago, where immigrants are deeply embedded in the hospitality, construction, and manufacturing sectors.
The state has not seen major new inflows in recent years, partly because economic growth has been slower compared to southern states.
Where Illegal Immigrants Live in 2025
Although every state hosts illegal residents, the distribution is heavily concentrated.
State
Illegal Immigrant Population (millions, 2023 est.)
Trend (2019–2024)
California
2.3
Decline of ~120,000
Texas
2.1
+85,000
Florida
1.6
+400,000
New York
0.83
Stable
New Jersey
0.60
Stable
Illinois
0.55
Stable
Together, these six states account for 56% of the total illegal immigrant population. That’s down from 80% in 1990, suggesting that immigrants are spreading into new regions such as Georgia, North Carolina, Massachusetts, Pennsylvania, Maryland, and Ohio, all of which experienced growth.
When Numbers Meet Human Stories
While digging through reports and statistics about unauthorized immigration, it’s easy to get lost in the data tables, millions of encounters, percentages of the workforce, and shifts in demographics. But every so often, you come across something that shakes you out of the numbers.
One example that stayed with me was reading about cases of sexual abuse inside youth detention facilities, where some undocumented or vulnerable young people were placed.
Imagine fleeing hardship in your home country, only to find yourself in a supposedly “rehabilitative” U.S. institution, where the very people tasked with protecting you turn into the source of harm.
Survivors have described abuse that was ignored, mocked, or covered up, leaving scars that go far beyond the time they spent in detention. It’s one of those moments that forces you to remember that behind every immigration statistic is a human being, often a young person, carrying trauma that can’t be captured in percentages.
That’s also why legal advocacy matters so much in this context. Survivors of abuse in detention, whether they were immigrants, juveniles, or simply caught in a system that failed them, deserve real avenues for justice.
Groups like Injury Lawyer Team work with victims of sexual abuse in detention facilities, ensuring their voices are heard and responsible parties are held accountable. Reading about their cases reminded me that immigration policy is not just about border enforcement, but also about what happens once people are already inside the system, often invisible and powerless.
Shifting Demographics: Beyond Mexico
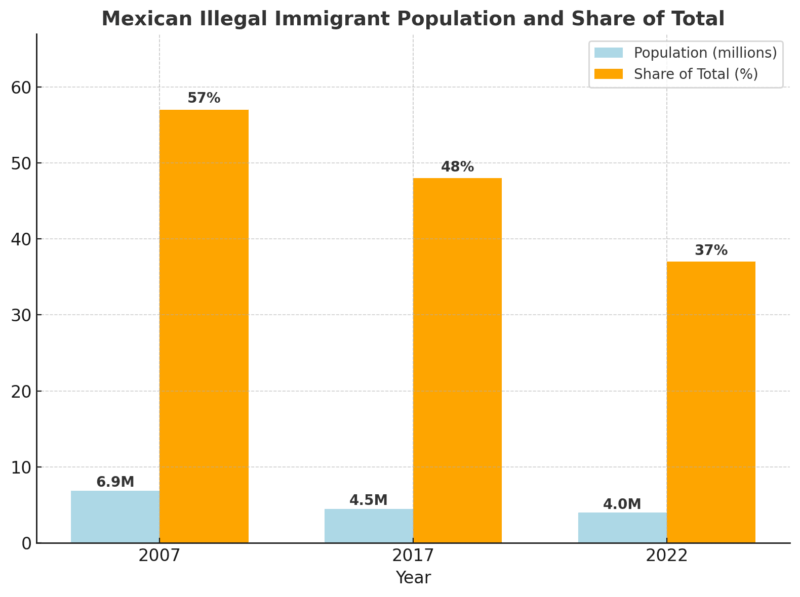
And for good reason, back in 2007, nearly 7 million Mexicans were living in the U.S. without legal status, representing 57% of the entire illegal population, according to Pew. But that picture has changed dramatically.
By 2017, the number had dropped to about 4.5 million, and by 2022 it declined further to just 4.0 million, making up only 37% of the total. That is the smallest share on record.
This shift is not the result of a single factor. On one hand, fewer people are leaving Mexico for the U.S., partly due to demographic changes; Mexico’s population is aging, and birth rates have fallen. On the other hand, there has been a steady flow of return migration, as some Mexican families choose to go back.
And importantly, the U.S. has expanded legal channels for Mexican workers, especially in seasonal agricultural and service-sector jobs, reducing the incentive to cross without authorization.
At the same time, other regions of the world have filled the gap. Migration from Venezuela, Brazil, India, and the Caribbean has surged in the past decade. The rise of Venezuela, in particular, is tied to its ongoing political and economic collapse, which has displaced millions of people regionally.
Similarly, instability and poverty in parts of Central America have continued to push people north. By 2022, the so-called Northern Triangle countries, El Salvador, Guatemala, and Honduras, contributed about 1.9 million illegal immigrants, making up 18% of the total.
What was once a Mexico-centered issue is now a global story, with South America, Asia, and the Caribbean increasingly part of the picture.
Labor Force Participation
According to Pew (2024), they make up around 8.3 million workers, or 5% of the entire U.S. workforce. That may sound modest at first, but the impact is outsized in certain sectors.
In agriculture, construction, food service, hospitality, and some parts of manufacturing, illegal workers make up a far greater share. These are industries that rely on steady, often physically demanding labor, where domestic worker shortages have been persistent.
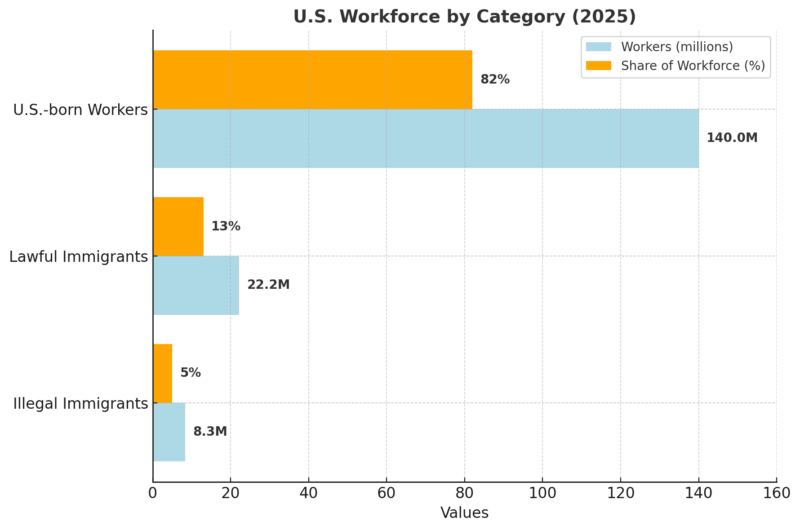
The long-term trend shows some interesting contrasts. Back in 2007, illegal immigrants made up 5.4% of the workforce, compared to 4.8% in 2022. That decline in share might suggest they are less important today, but in absolute numbers, they have held steady at around 8.3 million workers.
The decline in percentage terms is largely because the U.S. workforce as a whole has grown, not because illegal labor has vanished.
This stability highlights a critical point: despite heated political debate, illegal workers are deeply embedded in the U.S. economy. Employers depend on them, particularly in jobs where domestic recruitment struggles.
And because many illegal immigrants have been in the U.S. for years, sometimes decades, they are not simply “temporary” presences; they are part of long-term community and economic structures.
Policy Impacts: Title 42 and Beyond
@theageaustralia Migrants are flocking to the US-Mexico border after Title 42 lifted. But what is Title 42 and what happens to the people who cross the border illegally? Farrah Tomazin breaks it down from El Paso. #title42 #USimmigration #USMexicoborder #title42termination #usa #usa🇺🇸 #politics ♬ original sound – The Age
One of the clearest examples was Title 42, a public health order first invoked in March 2020 under the Trump administration at the onset of the COVID-19 pandemic. It allowed border officials to expel migrants quickly without processing asylum claims. At first, this caused border encounters to drop, especially during the early months of the pandemic.
But the story did not end there. Because migrants expelled under Title 42 faced no formal immigration penalties, many tried to cross again. This fueled a dramatic rise in repeat crossings.
The numbers recorded by CB, therefore, became inflated: one person might appear multiple times in the data. By the time Title 42 ended in May 2023, recidivism had become a defining feature of the statistics, making it harder to know how many unique individuals had actually attempted entry.
Event
Date
Title 42 Invoked
March 20, 2020
Title 42 Ended
May 11, 2023
When Title 42 ended, many predicted a massive surge. What actually happened was more complicated. There was indeed a spike in unique crossings in late 2023, but it was followed by signs of stabilization in mid-2024.
This shows how tightly migration patterns are linked to policy choices. Change the rules of the system, even temporarily, and the behavior of migrants adapts quickly.
In broader terms, Title 42 demonstrates how short-term policies can leave long-term marks on the data. Policymakers looking only at “encounter” numbers might assume migration exploded, but the reality was far more nuanced: repeat crossings drove much of the increase.
For analysts, separating those patterns is essential for understanding what’s really happening on the ground.
Methodology
This article draws on official data from the Pew Research Center (2025 release), U.S. Customs and Border Protection (CBP), and USAFacts to analyze trends in illegal immigration.
Population estimates were taken from Pew’s state-level reports through 2023. Border encounter statistics were sourced from CBP records covering October 2019 to June 2024.
Workforce participation data comes from Pew’s 2024 labor force study. Additional demographic insights were cross-referenced with studies from the Rand Corporation and Migration Policy Institute. All figures were reviewed for consistency across multiple sources to ensure accuracy and reliability.