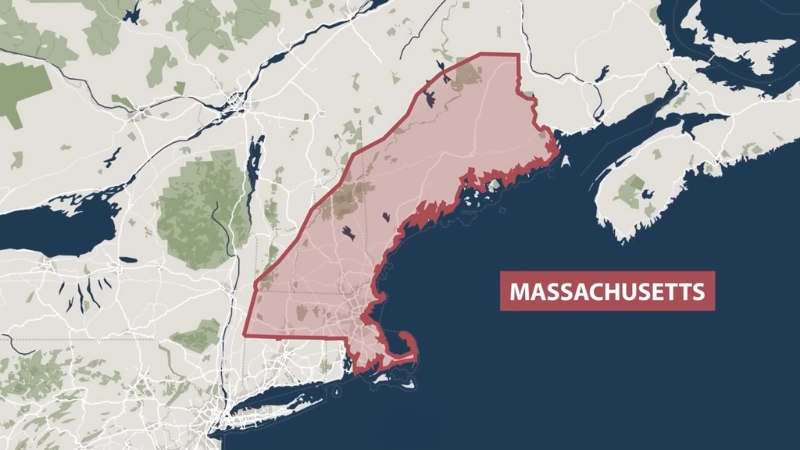
As of 2025, the population of Massachusetts stands at approximately 7,020,060, making it the third most densely populated state in the country, despite being the seventh smallest in land area according to the World Population Review.
The state has a steady annual population growth rate of about 0.75%, ranking it 28th in growth nationwide.
Massachusetts is bordered by New Hampshire to the north, Vermont to the northwest, New York to the west, Connecticut and Rhode Island to the south, and the Atlantic Ocean to the east.
Table of Contents
ToggleKey Takeaways
Age Distribution
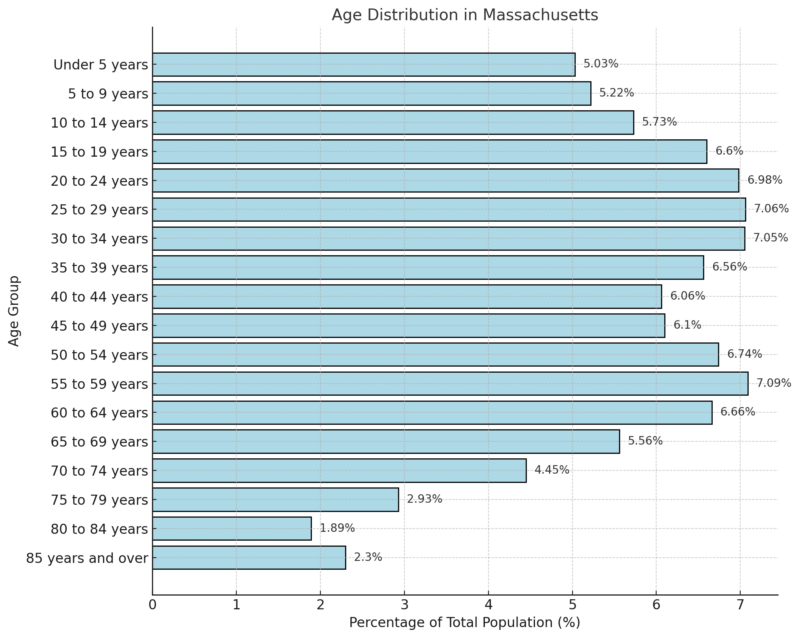
According to the 2018-2022 ACS 5-Year Estimates, the median age in Massachusetts is 39.8 years.
Of the total population, 15.98% are under the age of 15, 20.64% are between 15 and 29 years old, 46.26% fall within the 30 to 64 age group, 14.83% are aged 65 to 84, and 2.30% are 85 years or older.
Massachusetts, making up just over 2% of the United States’ 346 million population, highlights the aging challenges seen nationwide, with a dependency ratio of 49.5 reflecting a shift in generational support.
Dependency Ratios and Support Ratios
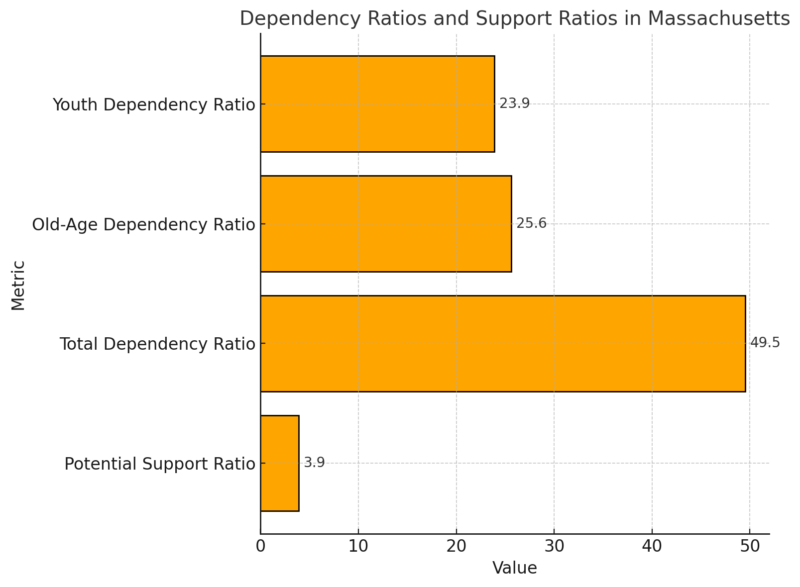
Massachusetts has a total dependency ratio of 49.5, meaning nearly half the working-age population supports dependents.
The youth dependency ratio is 23.9, reflecting a moderate burden from children, while the old-age dependency ratio of 25.6 highlights a significant aging population.
A potential support ratio of 3.9 indicates fewer working-age individuals available per elderly person, suggesting challenges in sustaining support systems.
Gender Composition
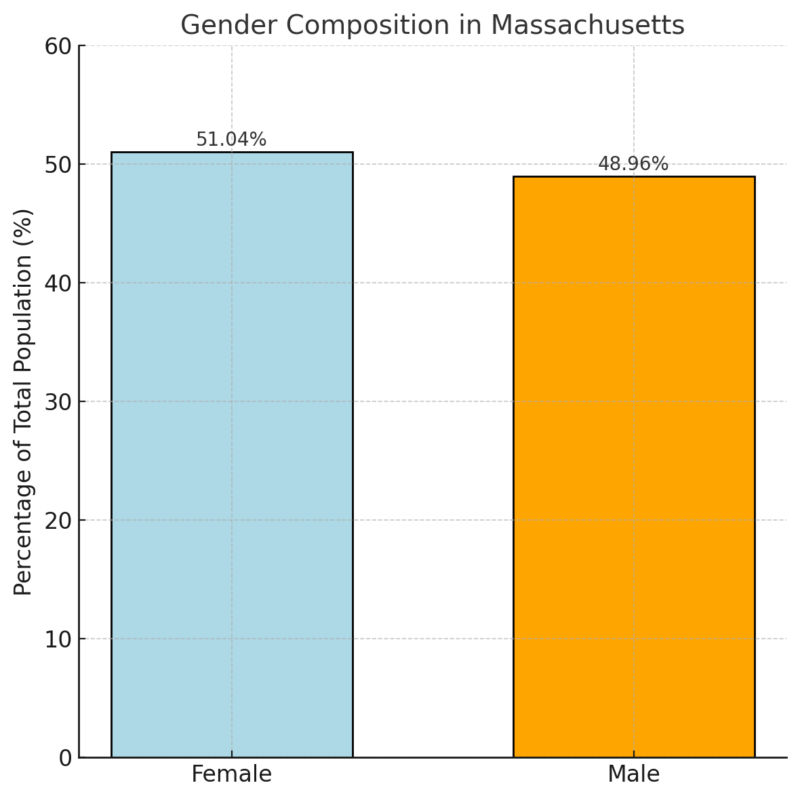
The population of Massachusetts is slightly skewed toward females, who make up 51.04% of the total population, compared to males at 48.96%.
This gender distribution is typical, with a slight majority of females, often attributed to higher life expectancy among women.
Racial Composition
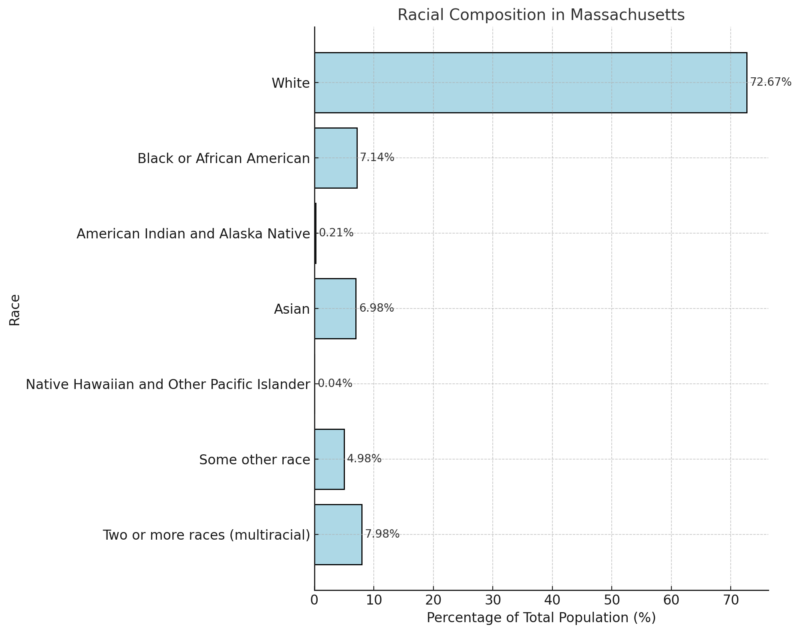
The majority of Massachusetts’s population is White, accounting for 72.67%, followed by multiracial individuals at 7.98%, and Black or African American at 7.14% according to the Neilsbergs article.
Asians comprise 6.98%, while smaller groups include “Some other race” at 4.98%, American Indian and Alaska Native at 0.21%, and Native Hawaiian and Other Pacific Islander at 0.04%, reflecting the state’s diverse racial composition.
Massachuset Counties Population 2025
County
Population
% Population Change
Area (sq. miles)
Population Density (per sq. mile)
Middlesex County
1,631,110
0.18%
316
1,994
Worcester County
870,859
1.30%
583
576
Essex County
813,679
0.73%
190
1,650
Suffolk County
768,038
-3.66%
22
13,242
Norfolk County
729,477
0.68%
153
1,842
Bristol County
583,938
1.24%
213
1,056
Plymouth County
537,368
1.35%
254
815
Hampden County
459,824
-0.97%
238
745
Barnstable County
231,392
1.48%
152
587
Hampshire County
162,486
10.82%
203
308
Berkshire County
126,089
-1.97%
358
136
Franklin County
70,677
-0.35%
270
101
Dukes County
20,676
0.40%
40
201
Nantucket County
14,445
1.46%
18
314
Massachusetts has 14 counties, with Middlesex County being the most populous, housing 1,614,614 residents in 2019, a 7.1% increase since 2010 as per WPR notes.
Worcester (830,839), Suffolk (807,252), Essex (790,638), and Norfolk (705,388) follow as the largest counties.
Suffolk County experienced the highest growth among these, at 11.22%.
Nantucket County, the smallest, grew fastest at 11.41%, reaching 11,327 residents in 2019.
Other sparsely populated counties include Dukes (17,352), Franklin (70,963), and Berkshire (126,348), with Berkshire seeing the largest decline, at -3.79%.
Rapid growth counties include Suffolk (11.22%), Middlesex (7.1%), and Essex (6.06%).
Income Levels
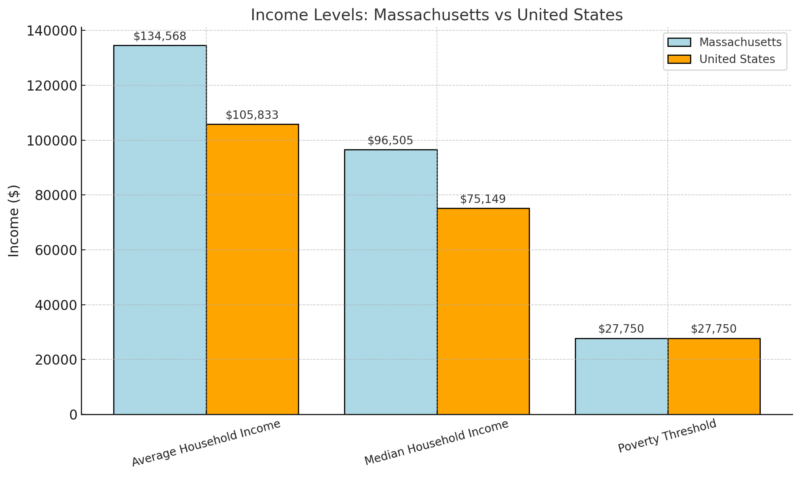
Household incomes in Massachusetts are significantly higher than the national average, with the average being 27% higher and the median 28% higher, reflecting the state’s overall affluence according to the Income By Zip Code.
Richest Zip Codes in Massachusetts
Rank
Zip Code
Population
Mean Income
Median Income
1
02030
5,886
$436,767
$250,001
2
02481
17,100
$414,379
$250,001
3
02468
5,589
$382,509
$250,001
4
02493
11,759
$365,202
$250,001
5
01770
4,404
$315,170
$242,688
6
02482
11,004
$314,233
$230,625
7
02108
4,218
$310,976
$170,379
8
02420
16,356
$304,158
$221,458
9
01741
5,209
$302,154
$247,656
10
01773
5,216
$301,905
$185,288
Massachusetts’s wealthiest zip code is 02030 (Dover) with an average household income of $436,767. The top 10 richest zip codes all exceed a mean income of $300,000, reflecting significant concentrations of wealth.
Salary Data
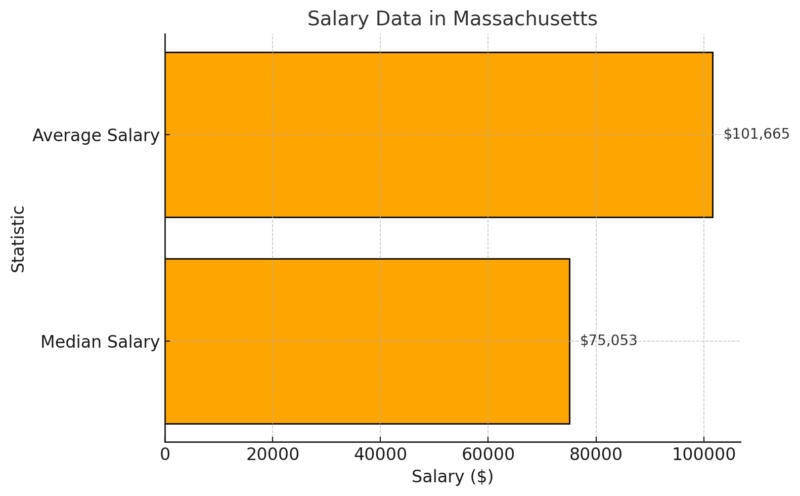
Salaries in Massachusetts are high, with the average salary surpassing $100,000. This reflects a robust economy, high demand for skilled labor, and the inclusion of self-employed individuals in the dataset.
Individual Incomes
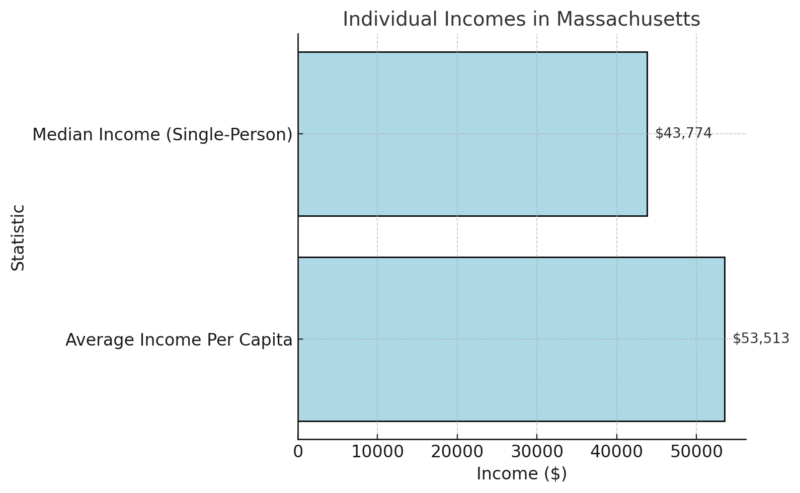
The median income for single-person households is $43,774, while the per capita income of $53,513 highlights disparities as it includes non-earning individuals.
Family Income
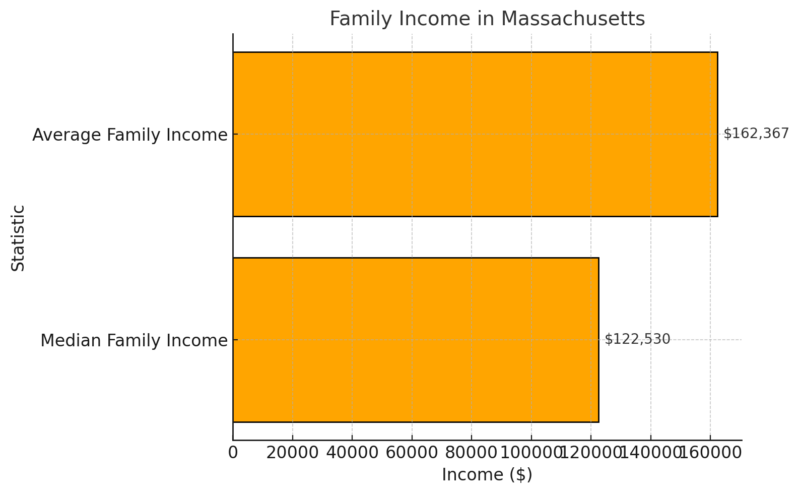
Families in Massachusetts enjoy high incomes, with the average surpassing $160,000, indicating a strong economic environment for households with multiple earners.
Educational Attainment
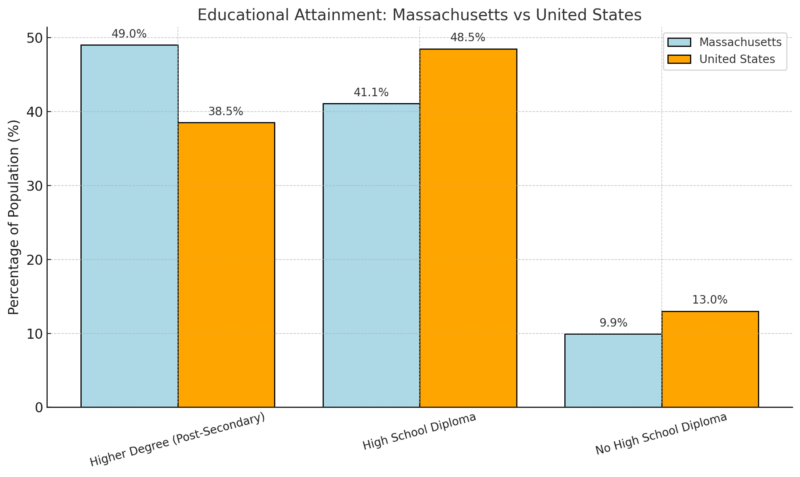
Massachusetts has a significantly higher percentage of individuals with post-secondary degrees (+27.2%) compared to the national average.
The state also has fewer individuals without a high school diploma (-23.6%), reflecting higher educational attainment levels overall.
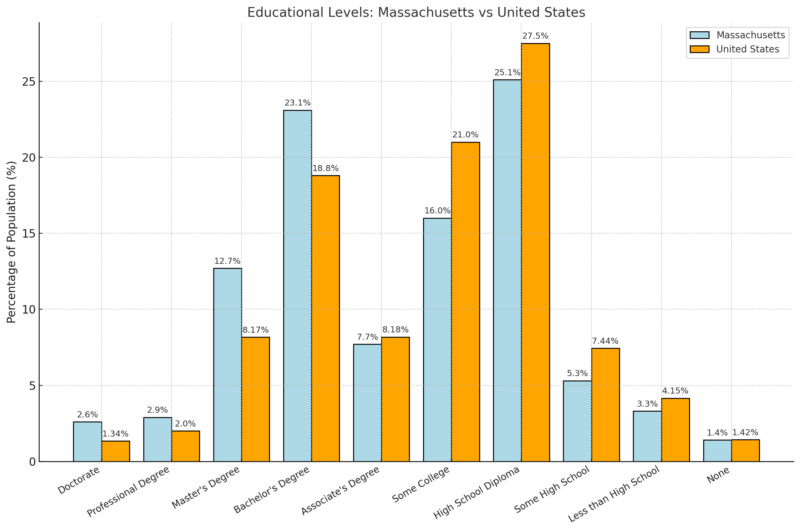
Massachusetts outperforms the national average in advanced degrees, with 90.7% more doctorates, 55.9% more master’s degrees, and 22.6% more bachelor’s degrees according to the Statistical Atlas.
The state also has fewer residents in lower educational categories, such as those with only “Some High School” (-29.0%) or “Less than High School” (-21.0%), emphasizing its strong educational infrastructure and focus on higher education.
Employment Statistics
Data Series
May 2024
June 2024
July 2024
August 2024
September 2024
October 2024 (p)
Civilian Labor Force (1)
3,782.8
3,806.6
3,828.7
3,844.0
3,850.6
3,853.6
Employment (1)
3,667.5
3,683.7
3,695.8
3,701.0
3,703.7
3,704.0
Unemployment (1)
115.3
122.9
132.8
143.1
146.8
149.7
Unemployment Rate (2)
3.0%
3.2%
3.5%
3.7%
3.8%
3.9%
From May 2024 to October 2024, Massachusetts’s labor force and employment showed steady growth, with the civilian labor force increasing from 3,782.8k to 3,853.6k and employment rising from 3,667.5k to 3,704.0k according to the BLS.
However, unemployment also rose during this period, from 115.3k to 149.7k, pushing the unemployment rate up from 3.0% to 3.9%.
This indicates a mixed trend of workforce expansion alongside growing unemployment, possibly reflecting broader economic shifts or labor market adjustments.
Massachusetts unemployment claims declined last week https://t.co/Y1cD9NeqQj
— The Herald News (@HNNow) November 25, 2024
Housing Market
Metric
Value
Year-over-Year Growth
Median Sale Price
$630,600
+3.3%
Number of Homes Sold
5,699
+10.1%
Median Days on Market
22 days
+2 days
The median home sale price in Massachusetts rose by 3.3%, reaching $630,600, reflecting a moderately strengthening housing market as per Redfin notes.
The number of homes sold increased significantly by 10.1%, while the median time on the market rose slightly by 2 days, indicating balanced buyer and seller activity.
Top 10 Massachusetts Metros with Fastest-Growing Sales Prices
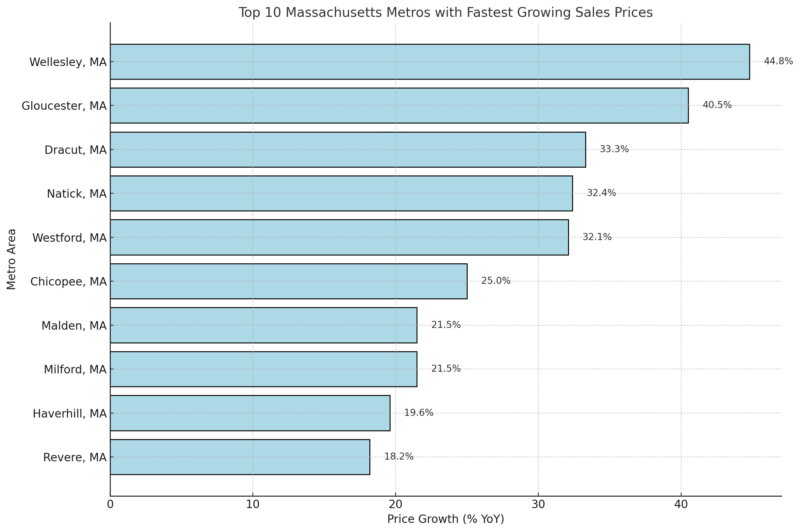
Wellesley leads Massachusetts metros with a 44.8% surge in home prices, followed by Gloucester at 40.5%. Other fast-growing areas, such as Dracut, Natick, and Westford, show price increases exceeding 30%, reflecting high demand and competitive markets in these regions.
Housing Supply Metrics
Metric
Value
Year-over-Year Growth
Number of Homes for Sale
19,227
+18.6%
Newly Listed Homes
7,257
+14.2%
Months of Supply
2
No change
The number of homes for sale in Massachusetts increased by 18.6%, and newly listed homes grew by 14.2%, suggesting improving housing supply. Despite this growth, the months of supply remained at 2 months, indicating a market still favoring sellers.
Birth and Death Rates
Indicator
Value
Fertility Rate
48.7 (births per 1,000 women aged 15-44)
Teen Birth Rate
5.8 (births per 1,000 females aged 15-19)
Infant Mortality Rate
3.32 (deaths per 1,000 live births)
Life Expectancy (at Birth)
79.6 years (2021)
Marriage Rate
5.1 (per 1,000)
Divorce Rate
1.4 (per 1,000)
Leading Cause of Death
Cancer
Drug Overdose Death Rate
37.4 (per 100,000)
Firearm Injury Death Rate
3.7 (per 100,000)
Homicide Rate
2.5 (per 100,000)
Massachusetts exhibits a low teen birth rate (5.8) and a high life expectancy (79.6 years), reflecting strong public health outcomes.
The infant mortality rate (3.32) is below the national average, indicating effective neonatal care.
However, the drug overdose death rate (37.4) highlights a significant public health concern, while rates for firearm injuries and homicides remain low compared to national averages.
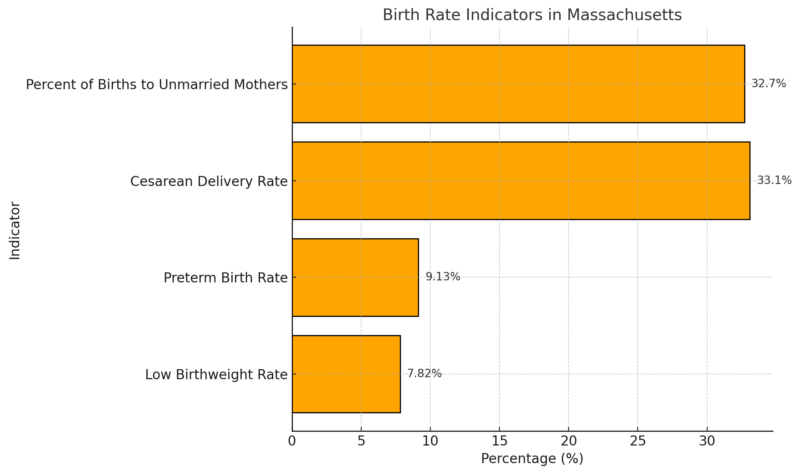
Birth data show a high Cesarean delivery rate (33.1%) and a moderate preterm birth rate (9.13%), emphasizing areas for maternal health improvement.
Migration Patterns
Metric
Value
Immigrant Share of Population
18.1%
Immigrant Residents
1,266,300
Immigrant Spending Power
$48.1B
Immigrant Taxes Paid
$18.4B
Share of Population with Immigrant Parent
8.8%
Immigrants make up 18.1% of Massachusetts’s population, contributing significantly to the state’s economy with $48.1 billion in spending power and $18.4 billion in taxes as per the American Immigration Council.
Additionally, 8.8% of the U.S.-born population lives with at least one immigrant parent, indicating the broader social and economic influence of immigrants in the state.
Demographics
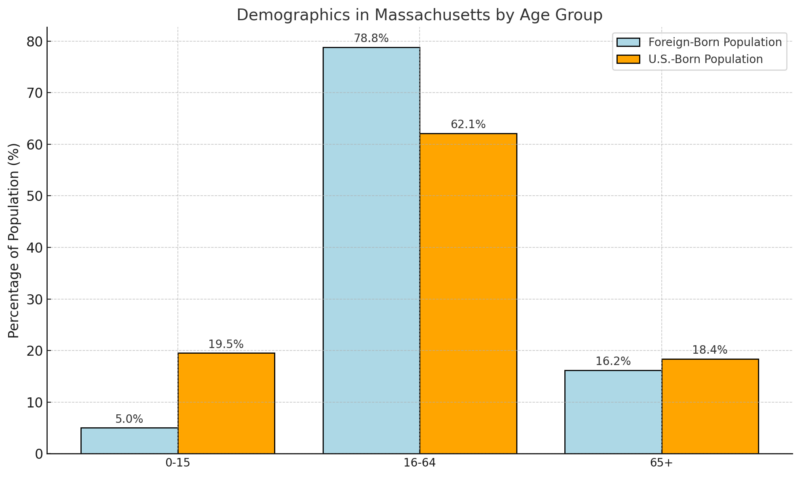
They are predominantly of working age (78.8%), much higher than the U.S.-born population (62.1%), which highlights their active contribution to the labor force. The proportion of immigrant children (5.0%) and elderly (16.2%) is lower compared to their U.S.-born counterparts, reflecting the critical role immigrants play in sustaining the state’s workforce.
Metric
Value
Immigrant Women
51.0%
Immigrant Men
49.0%
Immigrant Children
76,000
U.S.-Born with Immigrant Parent
502,100
Foreign-Born Proficient in English
76.3%
The immigrant population in Massachusetts is gender-balanced, with 51.0% women and 49.0% men. A significant portion (76.3%) is proficient in English, enabling greater social and economic integration. With 502,100 U.S.-born residents living with an immigrant parent, immigrants influence the broader demographic fabric.
Top Countries of Origin
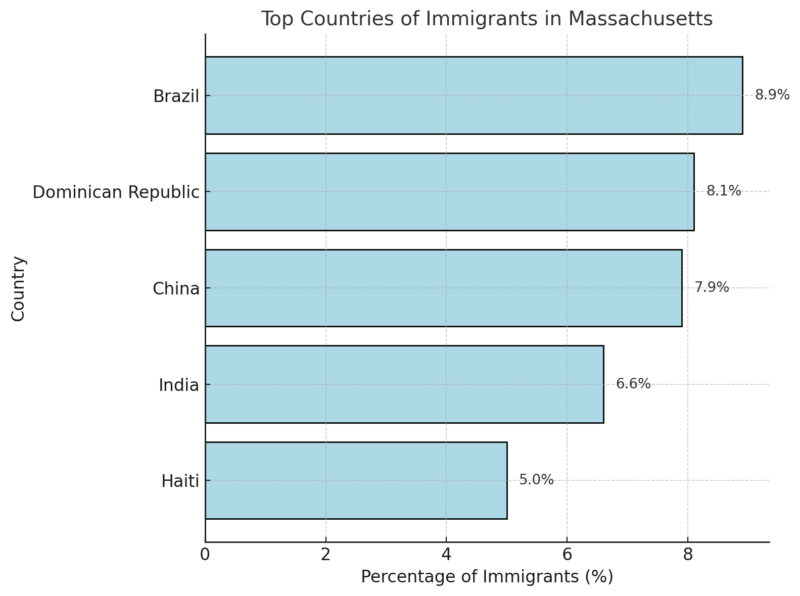
Immigrants in Massachusetts come from diverse backgrounds, with Brazil (8.9%) and the Dominican Republic (8.1%) being the top origins. These diverse communities contribute significantly to the state’s cultural and economic landscape.
Economic Contributions
Metric
Value
Share of Entrepreneurs Who Are Immigrants
25.5%
Number of Immigrant Entrepreneurs
83,500
Total Business Income of Immigrant Entrepreneurs
$2.6B
Immigrants play a critical role in entrepreneurship in Massachusetts, comprising 25.5% of all entrepreneurs and generating $2.6 billion in business income. This highlights their importance in job creation and economic growth, with 83,500 immigrant entrepreneurs driving innovation and development across the state.
Healthcare Stats
Metric
Massachusetts
United States
Disabled Population (%)
12.8% ± 0.2%
13.6% ± 0.1%
Census reports that Massachusetts has a slightly lower disabled population (12.8%) compared to the national average (13.6%), suggesting marginally better health outcomes or services supporting residents with disabilities.
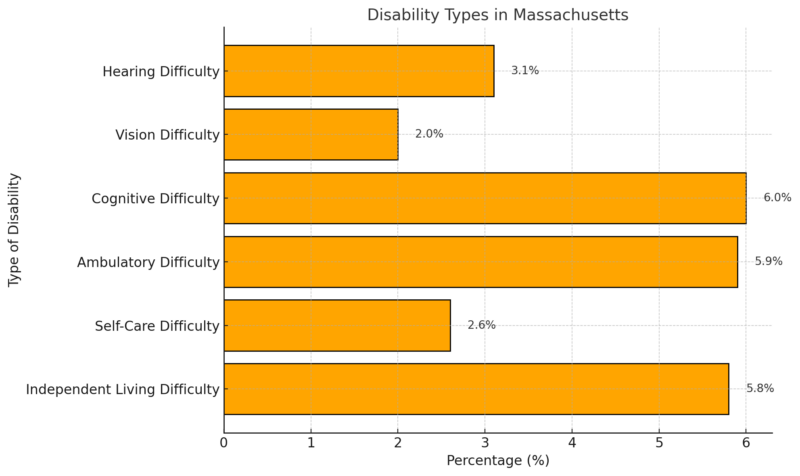
Cognitive difficulties (6.0%) and ambulatory difficulties (5.9%) are the most common types of disabilities in Massachusetts, reflecting challenges in mobility and mental health.
Hearing and vision difficulties are less prevalent, affecting 3.1% and 2.0% of the population, respectively, while self-care difficulties remain relatively low at 2.6%.
Fertility Statistics
Metric
Massachusetts
United States
Women Aged 15-50
1,662,871 ± 4,960
77,984,030 ± 34,163
Women with Births (Past 12 Months)
15-19 Years
477
20-34 Years
44,785
35-50 Years
28,511
The majority of births in Massachusetts occur in women aged 20-34 years (44,785), followed by those aged 35-50 years (28,511), with minimal contributions from teens aged 15-19 years (477).
This distribution aligns with national trends where childbearing peaks in the 20-34 age group.
Health Insurance Statistics
Metric
Massachusetts
United States
Without Health Care Coverage (%)
2.6% ± 0.2%
7.9% ± 0.1%
Massachusetts has one of the lowest rates of uninsured residents (2.6%) compared to the national average (7.9%).
This reflects the state’s strong healthcare policies and widespread insurance coverage.
Crime Data 2025
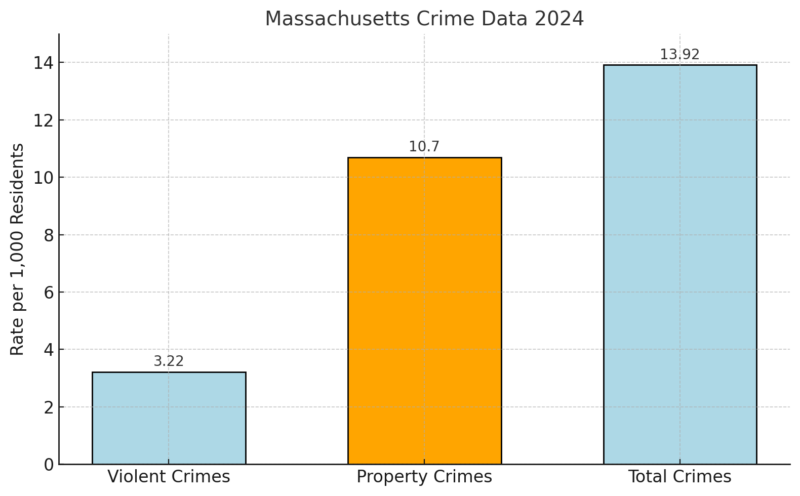
Massachusetts has a total crime rate of 13.92 per 1,000 residents, with property crimes being significantly more common (10.70 per 1,000) than violent crimes (3.22 per 1,000) as per Neighborhood Scout.
The overall rate is below the national average, reflecting relatively safer conditions in the state.
Violent Crime Breakdown
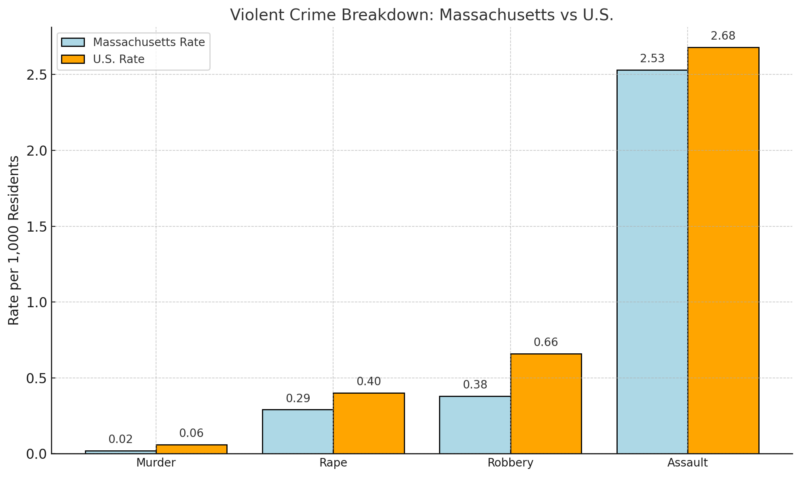
Massachusetts has lower rates of murder (0.02), rape (0.29), and robbery (0.38) compared to national averages, and a slightly lower rate of assault (2.53 vs. 2.68 per 1,000 residents).
This places Massachusetts among states with relatively low violent crime rates.
Property Crime Breakdown
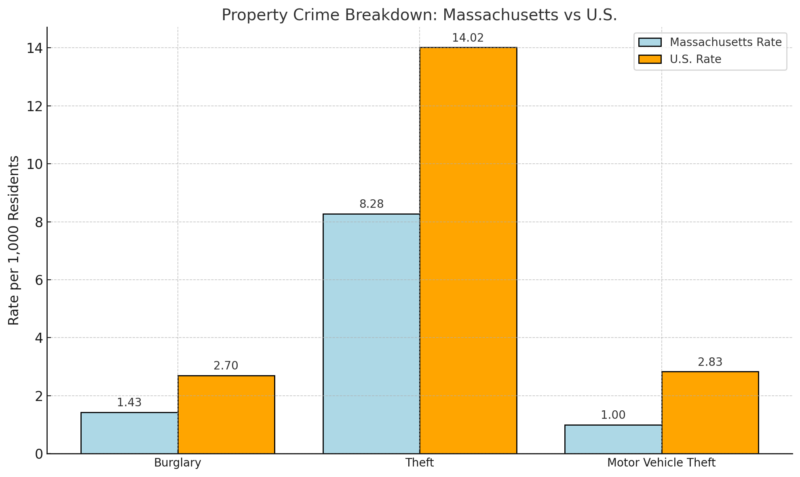
Massachusetts shows significantly lower property crime rates across all categories when compared to the national averages.
Theft (8.28 per 1,000) is the most common property crime in the state, followed by burglary (1.43) and motor vehicle theft (1.00).
Key Crime Odds
Category
Chances of Becoming a Victim
Violent Crime
1 in 311
Property Crime
1 in 93
Residents in Massachusetts have a 1 in 311 chance of being a victim of violent crime and a 1 in 93 chance of experiencing property crime.
These odds are favorable compared to many other states, emphasizing Massachusetts’s relative safety.
Methodology
This article was crafted using the latest 2023-2025 data from the U.S. Census Bureau, ACS, Redfin, and NeighborhoodScout.
Demographic insights were drawn from state and national comparisons to provide context. Labor, income, and educational statistics were analyzed for accuracy and relevance.
Crime data was compared to national averages to highlight Massachusetts’s safety.
The economic contributions of immigrants were calculated from verified sources, emphasizing their impact.
Housing trends were evaluated for clarity using real estate market reports.
Public health metrics and dependency ratios were synthesized for a comprehensive overview.
References
- World Population Review – Massachusetts Population 2024
- Neighborhood Scout – Massachusetts Crime Rates
- American Immigration Council – Immigrants in Massachusetts
- U.S. Census Bureau – Massachusetts Profile
- Statistical Atlas – Massachusetts Educational Attainment
- Income by Zip Code – Massachusetts Income Data
- Redfin – Massachusetts Housing Market
- Bureau of Labor Statistics (BLS) – Massachusetts Economy
- Neilsberg – Massachusetts Population by Age and Gender


