
Maui County, Hawaii, holds a significant place in the state with an estimated population of 164,007 in 2025 according to World Population Review.
Despite this dip, Maui continues to be the third-largest county in Hawaii.
Over the past decade, the population has generally seen moderate growth, reaching around 166,000 residents at one point.
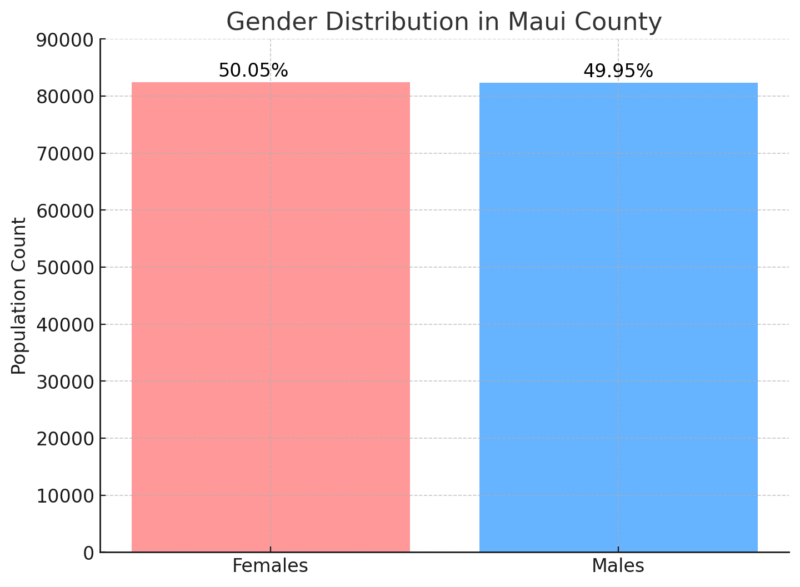
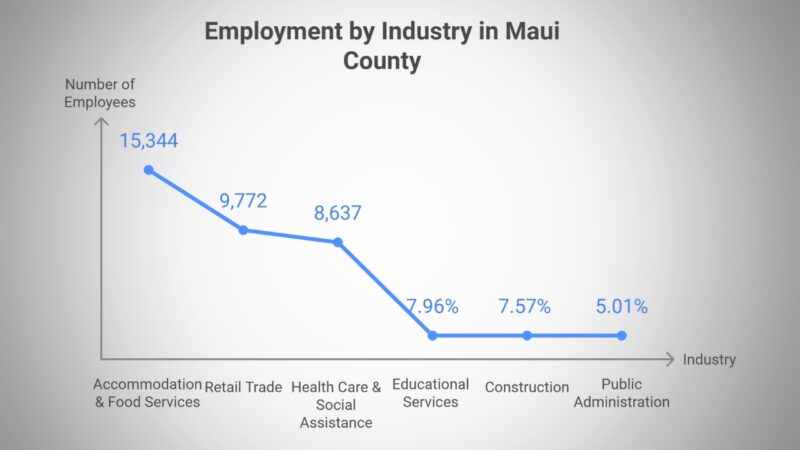
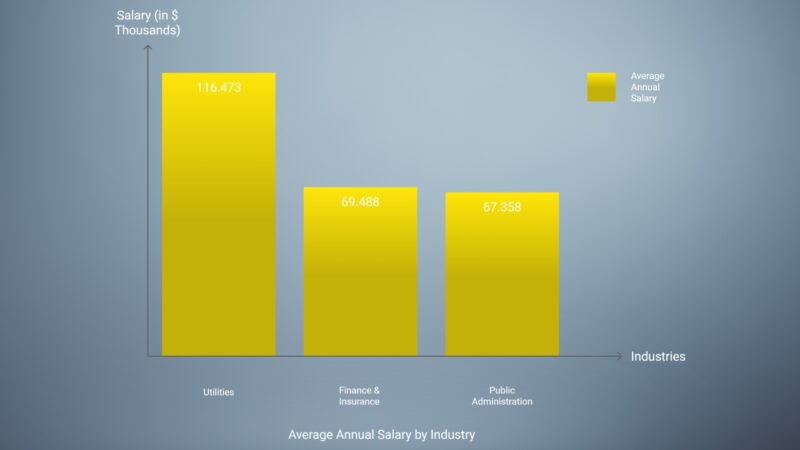
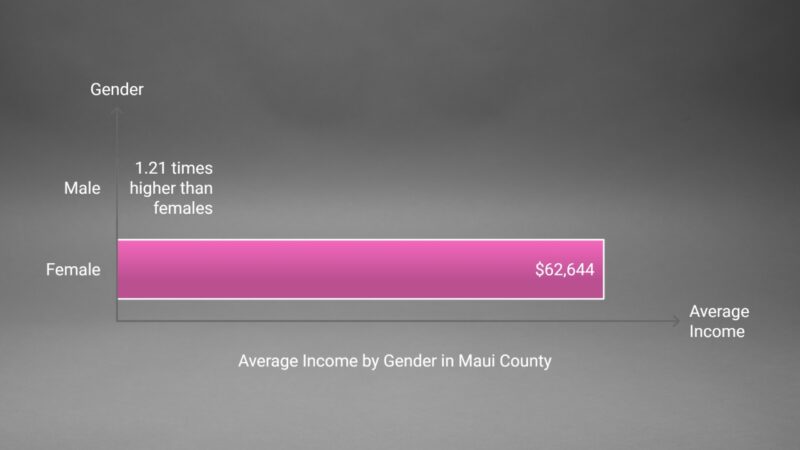
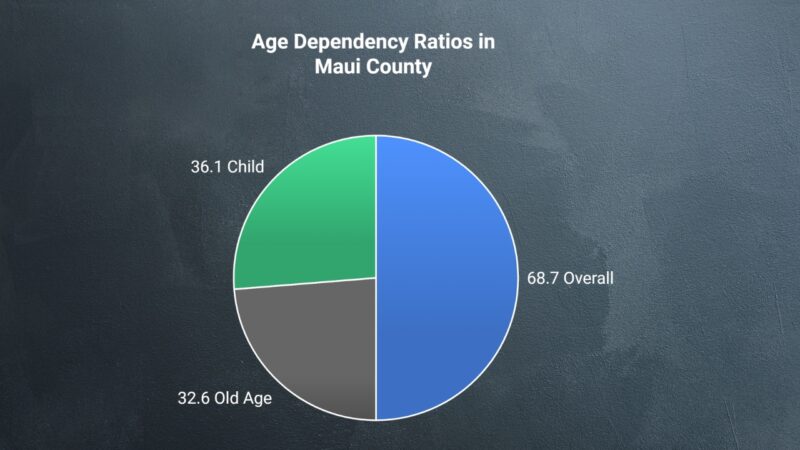
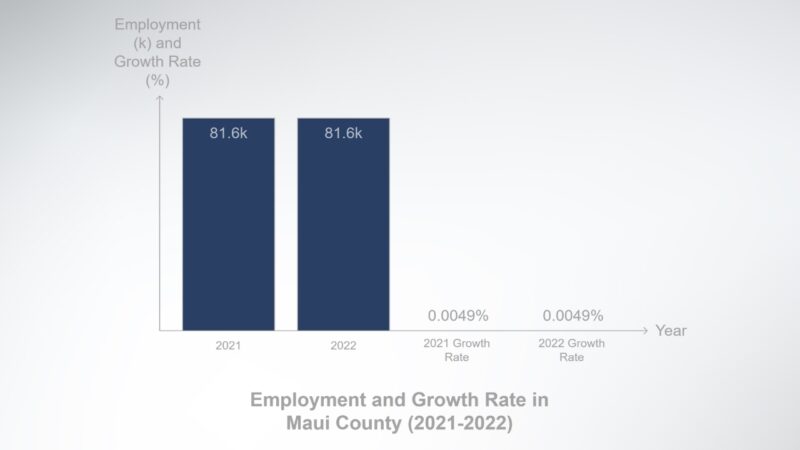
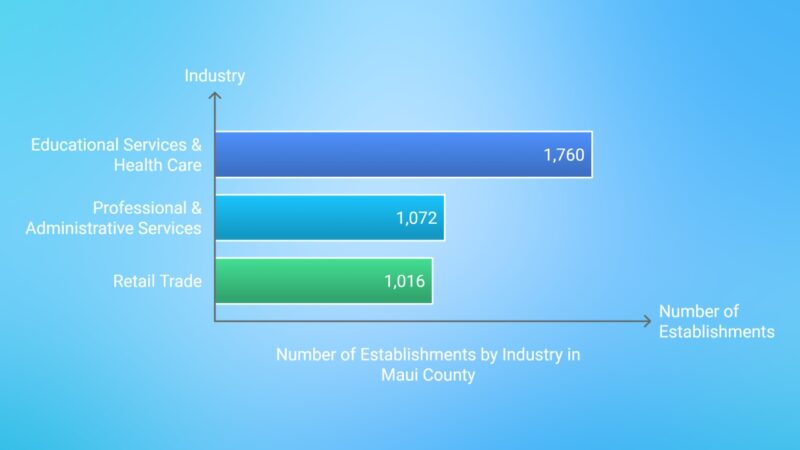
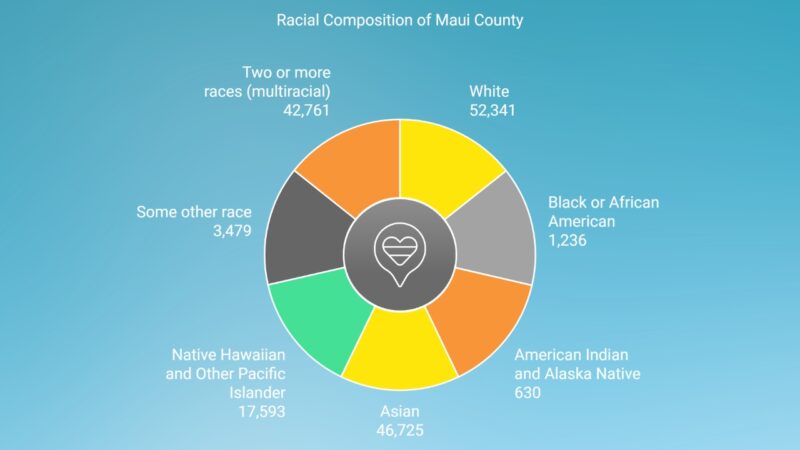
Maui is the third-largest county in Hawaii. While its growth rate has slightly declined by 0.11% over the past year, the county has experienced a 5.79% increase since 2010. Maui County experienced notable population changes between 2010 and 2022. The county’s population increased significantly, spurred by several years of consistent growth. The largest annual increase of 1.3% occurred between 2012 and 2013. The data reflects an average growth rate of about 0.5% per year during this period. Historical census data indicates a total growth of approximately 6.4% since 2010, underlining Maui’s appeal as a growing community. Maui Island’s resident population is expected to grow from 129,471 in 2005 to 186,254 in 2030. This is a 1.68% annual growth rate, for a total of approximately 42% increase in population over the 25 year period. Maui County’s population is almost evenly split between males and females. Females make up 50.05% of the population (82,461 individuals), while males account for 49.95% (82,304 individuals). This balanced ratio indicates a nearly equal gender distribution. The median age of the total population is 42.2 years, with females having a slightly higher median age of 42.9 years, compared to 41.5 years for males. This reflects a relatively older population compared to many regions, with a significant proportion of residents in middle or older age groups. The total adult population in Maui County is 129,494, and of these, 31,837 are seniors, indicating that nearly 24.6% of the adult population is aged 65 or older. This highlights a significant aging population that may influence healthcare and senior services needs. The economy of Maui County, HI employs approximately 81,600 people. The major industries driving the economy include Accommodation & Food Services, Retail Trade, and Health Care & Social Assistance according to our research. These industries employ the largest number of people, but the highest-paying sectors differ slightly, with Utilities, Finance & Insurance, and Public Administration topping the list for the best-paying industries. These figures highlight that while industries like Accommodation & Food Services employ the most people, sectors such as Utilities and Finance & Insurance offer much higher compensation. Maui County has a workforce of 81,600 employees, and the most common occupations are related to administrative support, sales, and management. Below is a breakdown of the major occupational groups by their representation in the workforce: These three sectors (Administrative Support, Sales, and Management) account for a significant portion of the workforce, highlighting their importance in the local economy. There is a noticeable income gap between males and females in Maui County. On average, males earn 1.21 times more than females, who have an average income of $62,644 according to Hawaii University. Additionally, the income inequality in Hawaii, as measured by the Gini Index, is 0.434, which is slightly lower than the national average. The gender wage gap and income inequality measures are important indicators of economic disparities in the county. Maui County has 129,494 adults, of which 31,837 are seniors. This influences the Age Dependency Ratio, which is a significant metric to determine how many dependents (elderly and children) rely on the working-age population. These ratios indicate that for every 100 working-age individuals, there are approximately 69 dependents (children and elderly combined). The old-age dependency ratio is 32.6, indicating a considerable proportion of elderly dependents in the county. The earnings data for various industries in Maui County show that certain industries have high earnings, particularly for men and women employed in public administration, wholesale trade, and construction. This table shows that men and women in Public Administration and Wholesale Trade have some of the highest median earnings in the county, although disparities remain between industries. From 2021 to 2022, employment in Maui County grew at a rate of 0.0049%, indicating stability rather than rapid growth. The total workforce remained consistent at around 81,600 employees over this period. However, the impact of COVID-19 led to significant drops in employment across various sectors in 2020, with a general employment decline of 22.4% during the early pandemic period. The pandemic impact is still visible in the employment recovery data, but the economy shows resilience in key sectors such as Accommodation & Food Services and Retail. Unemployment insurance claims spiked significantly during the early stages of the COVID-19 pandemic. While data specific to Maui County isn’t readily available, Hawaii as a state showed a considerable number of claims during the economic downturn caused by the pandemic. In Maui County, certain industries have a high concentration of business establishments, particularly those related to educational services, health care, professional services, and retail trade. These industries provide the backbone for employment opportunities and economic activity within the county. As of August 2024, the housing market in Maui County, HI has experienced significant price increases and a slowdown in the number of homes sold. Here’s a detailed breakdown of the key metrics related to home sales and market trends in the area: Is now a good time to buy Maui Real Estate? Historically, real estate cycles typically run 6 – 8 years in Hawaii. We were in the midst of a down market after 9/11, and again after the big crash of 2008. However, for the past 14 years or so, the market has only gone up, which… — MauiPropertyExpert.com (@JonathanMizel) June 5, 2024 The 38.0% increase in median home prices in Maui County far outpaces the national average, which shows a much slower rate of home price growth in most other regions of the United States. This table presents a breakdown of a population based on racial categories and their respective percentages of the total population. The group with the largest population is “White,” representing 31.77% of the total population with 52,341 individuals. The second-largest group is “Asian,” comprising 28.36% of the population, followed closely by those who identify as “Two or more races (multiracial)” at 25.95%. Other racial groups, such as “Native Hawaiian and Other Pacific Islander” (10.68%) and “Some other race” (2.11%), have smaller populations. Meanwhile, “Black or African American” and “American Indian and Alaska Native” make up the smallest percentages, accounting for 0.75% and 0.38% of the population, respectively. The data suggests a relatively diverse population, with significant representation of different racial groups and a notable proportion identifying as multiracial. The relatively large percentage of “Two or more races” indicates a high level of racial mixing in this population. Nearly 33% of the population in Lahaina is foreign-born, highlighting how immigration enriches the island’s diversity and contributes to its social fabric foreign-born population. Maui County, Hawaii, has an overall score of 60/100, slightly below both the state average (63) and the peer group average (61). The county is categorized as Urban, High-Performing and performs relatively well in areas like Population Health and Food & Nutrition, but struggles in sectors such as Housing and Education. Below is a breakdown of the key metrics across various categories according to US news research: Maui County performs exceptionally well in Population Health with a score of 84. Health conditions and outcomes are favorable, with low uninsured rates and long life expectancy. These metrics demonstrate that Maui County has a relatively healthy population with high life expectancy and low mortality rates compared to national and peer averages. The Equity category, with a score of 48, evaluates disparities in education, income, and social factors across different demographic groups. While Maui County performs decently in Income Equity, its scores for Educational Equity and Health Equity are lower. These scores indicate that Maui County faces challenges in providing equitable educational outcomes and health opportunities across its diverse population.Key Takeaways
Demographic Overview
Age Demographics
Category
Value
Total Population (Female)
82,461 (50.05%)
Total Population (Male)
82,304 (49.95%)
Median Age (Total)
42.2 years
Median Age (Male)
41.5 years
Median Age (Female)
42.9 years
Adult Population
129,494
Senior Population
31,837
Age Dependency Ratio
68.7
Old Age Dependency Ratio
32.6
Child Dependency Ratio
36.1
Gender Distribution
Median Age
Adult and Senior Population

Age Dependency Ratios
Economic Impact of Population Changes
Employment by Industry
Highest-Paying Industries
Employment by Occupations
Major Occupational Groups
Occupation
Number of People
% of Workforce
Office & Administrative Support Occupations
8,835
10.8%
Sales & Related Occupations
8,773
10.8%
Management Occupations
8,514
10.4%
Construction & Extraction Occupations
N/A
5.57%
Food Preparation & Serving Related Occupations
N/A
9.27%
Building & Grounds Cleaning & Maintenance Occupations
N/A
7.91%
Income and Wage Disparities
Age and Employment Dependency
Age Dependency Ratios
Median Earnings by Industry and Gender
Median Earnings by Industry
Industry
Median Earnings (Men)
Median Earnings (Women)
Public Administration
$67,739
$65,968
Wholesale Trade
$57,941
$78,444
Construction
$62,518
N/A
Employment Growth and Trends
Unemployment Insurance Claims
Establishments by Industry
Housing Market Trends
Maui County Housing Market Trends (August 2024)
Metric
Value
Change Year-Over-Year
Median Sale Price
$1,297,500
+38.0%
Median Sale Price per Sq. Ft.
$956
+10.8%
Number of Homes Sold
134
-12.4%
Median Days on Market
85 days
+20 days
Housing Prices in Maui County
Homes Sold and Days on Market
Year-Over-Year Growth in Maui County vs. National Trends
Comparison of Median Sale Prices (August 2024)
Location
Median Sale Price
Growth % YoY
Maui County, HI
$1,297,500
+38.0%
United States
N/A
Slower growth
Cultural Diversity
Infrastructures Effect on Population
Population Health
Population Health Metrics
Metric
County Value
National Average
Peer Group Average
State Average
Population with No Health Insurance
5.1%
11.5%
8.9%
4.4%
Smoking Rate
12.6%
19.0%
15.6%
11.8%
Life Expectancy
82.0 years
75.8 years
78.1 years
81.8 years
Heart Disease Prevalence
4.5%
5.9%
5.2%
4.1%
COVID-19, Influenza, and Pneumonia Mortality per 100k
27.8
98.0
67.1
43.7
Equity
Equity Metrics
Metric
County Value
National Average
Peer Group Average
State Average
Racial Disparity in Educational Attainment
0.20
0.18
0.23
0.15
Segregation Index Score
0.24
0.39
0.30
0.25
Premature Death Disparity Index Score
0.110
0.238
0.088
0.097
Neighborhood Disparity in Poverty
6.78
7.10
7.65
9.01
Education
The Education score of 43 highlights challenges in Educational Achievement and Education Infrastructure. Although the county’s high school graduation rate is slightly below the national average, there is a significant percentage of the population with advanced degrees.
Education Metrics
Metric
County Value
National Average
Peer Group Average
State Average
High School Graduation Rate
86.0%
88.0%
83.2%
86.0%
Population with Advanced Degree
39.8%
33.1%
43.5%
45.8%
Preschool Enrollment
36.2%
41.8%
45.2%
46.2%
Low preschool enrollment and underinvestment in educational infrastructure are areas that require improvement to boost overall education performance.
Environmental Protection Efforts
View this post on Instagram
The Kahikolu Project targets the axis deer population, which has been causing significant environmental damage. These non-native deer have disrupted local ecosystems by overgrazing, leading to soil erosion and habitat loss.
In parallel, legislation is being advanced to enhance air and water quality monitoring across the island.
New bills propose funding for specialists who will track environmental health, providing essential data to inform policy. These proactive measures are designed to mitigate ongoing environmental degradation and improve the resilience of Maui’s natural habitats.
Population vs. Sustainability

The demand for resources such as water has prompted debates over long-term planning.
Recently, the Maui Mayor influenced the state to modify a long-term water plan, which would have primarily benefited private interests.
Balancing increased population with ecosystem protection involves regulating development and resource use. Emphasis is placed on renewable energy initiatives and sustainable agriculture practices.
By prioritizing these strategies, Maui seeks to model a sustainable future that can accommodate its growing population without compromising environmental integrity. This delicate balance requires continuous assessment and adaptation to ensure sustainability goals align with the community’s needs.


