Montana has seen notable demographic shifts as its population continues to grow, contributing to significant changes in its societal landscape.
In 2025, Montana’s population reached approximately 1,142,750, highlighting a steady increase over the past years according to World Population Review.
This growth is particularly impressive given Montana’s vast open spaces and largely rural composition.
However, according to the US latest census in 2020, it had a population of 1,084,225.
The driving factors behind this population growth are varied, with increased in-migration playing a central role in entire country.
Many are drawn to Montana for its scenic beauty and quality of life, creating demographic changes that impact everything from local economies to infrastructure needs.
This growth pattern mirrors trends across the country, where rural states are witnessing new opportunities and challenges.
Key Takeaways
1. Population Growth Rate
Year
Population (Millions)
Yearly Growth
2000
0.903
–
2002
~0.920
~17,000
2004
~0.940
~20,000
2006
~0.960
~20,000
2008
~0.980
~20,000
2010
0.990
87,425 (9.68%)
2012
~1.020
~30,000
2014
1.020
~30,000
2016
~1.060
~40,000
2018
~1.080
~20,000
2020
1.084
96,481 (9.74%)
2022
1.120
16,512
2023
1.130
9,934 (0.88%)
From 2000 to 2023, Montana population saw consistent growth, with no years of decline during this period. In 2000, the state’s population was at its lowest for the 23-year period, with 903,305 residents. By the end of 2023, Montana’s population had reached its peak of 1.13 million, reflecting a total growth of 25.41% over the entire span according to Neiilsberg.
From 2000 to 2010, the population grew by 87,425 people, an increase of 9.68%, slightly outpacing the national growth rate of 9.63% during that period. Between 2010 and 2020, the population continued to rise, adding 96,481 residents (9.74%), which also exceeded the national rate of 7.18%.
After the COVID-19 pandemic, between 2020 and 2023, Montana’s population grew by 45,601 (4.19%), a rate significantly higher than the national growth rate of 1.02% during the same time.
New census data show Montana’s population grew 1.6% between July 2020 and July 2021. The population went from 1,086,193 to 1,104,271. Only a handful of states grew by more than 1% – almost all in the western U.S. #mtnews pic.twitter.com/COkIEpEQVy
— Montana Public Radio (@mtpublicradio) January 3, 2022
The state’s fastest population growth occurred between 2020 and 2021, with an increase of 19,155 residents, reflecting a 1.76% year-on-year growth. Between 2021 and 2023, Montana’s population grew by 26,446, with 16,512 people added from 2021 to 2022, and 9,934 added between 2022 and 2023 (a 0.88% increase).
Over the past decade (2013 to 2023), Montana’s population grew by 118,654, a growth rate of 11.70%. The lowest population during this period was recorded in 2014 at 1.02 million, while the highest was in 2023 at 1.13 million. The average growth rate for this period was 1.11%.
2. Age Distribution
Montana population age distribution reveals a median age of 40.1, indicating a slightly older population compared to the national average. This demographic breakdown, according to the 2018-2022 American Community Survey (ACS) 5-Year Estimates, shows a balanced mix across various age groups, reflecting both younger and older cohorts as per Neilsberg research.
Montana Population by Age Breakdown
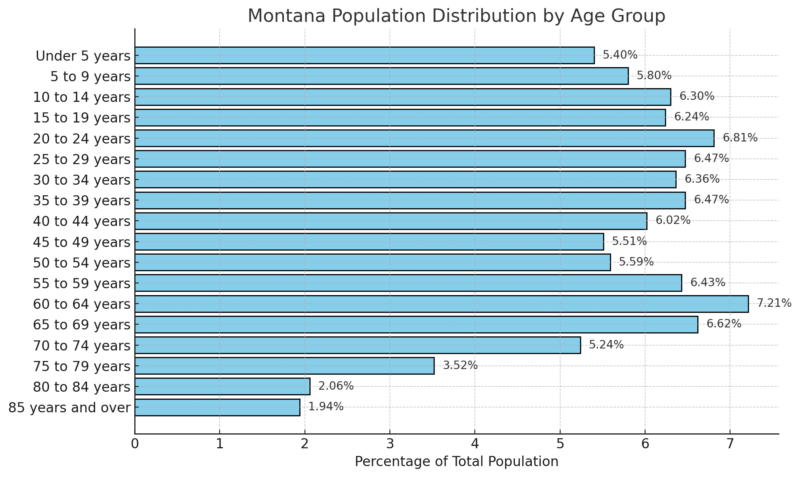
- Aging Population: The high percentage of individuals in the 60+ age group (close to 25% of the total population) indicates a growing demand for healthcare, retirement services, and age-friendly infrastructure.
- Young and Middle-Aged Workers: With more than 43% of the population between the ages of 30 and 64, Montana has a robust working-age group. However, a notable trend of out-migration among younger adults could impact long-term labor market sustainability.
- Children and Teens: The sizable population under the age of 15 suggests a continued need for investments in education and family services to support this young generation.
3. Gender Distribution
As of 2022, Montana had a population of 1,091,840, with a near-even gender distribution: 50.8% male and 49.2% female. This gender ratio aligns with broader trends in the United States.
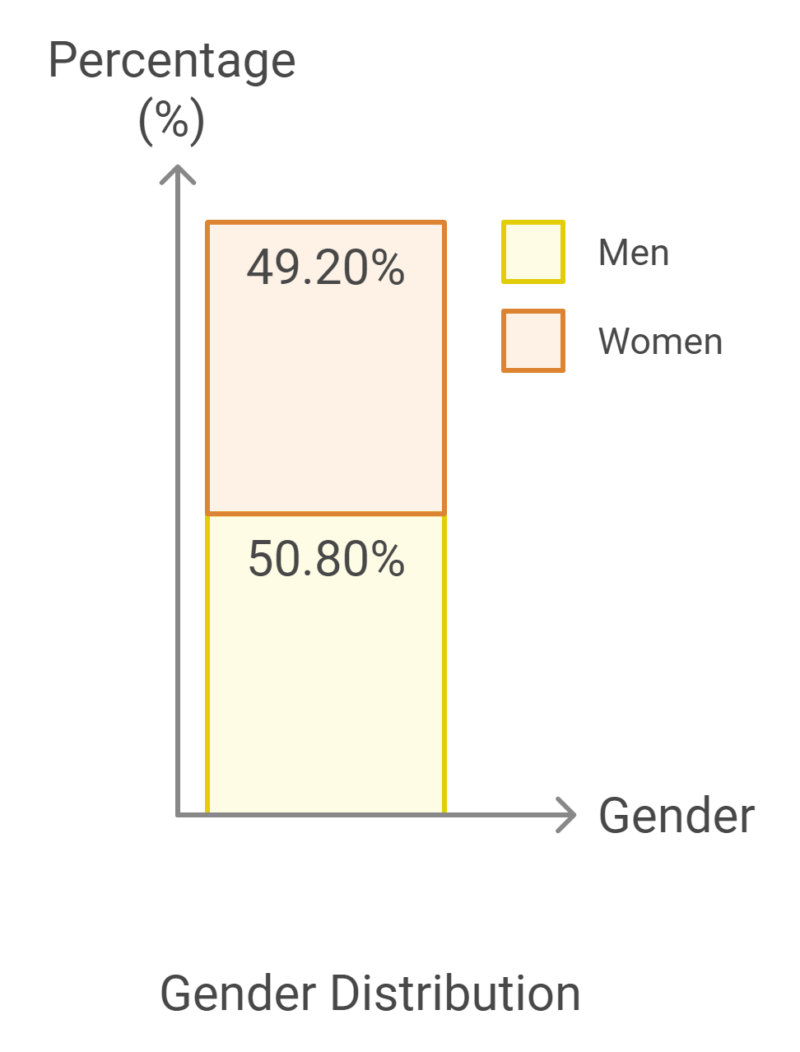
This data is based on the 2022 Census Bureau’s American Community Survey (ACS) 5-Year Estimates, which provides insights into population structure by gender and age. These figures also reflect the distribution trends over time, showing a relatively stable balance between men and women in the state.
4. Population by Race
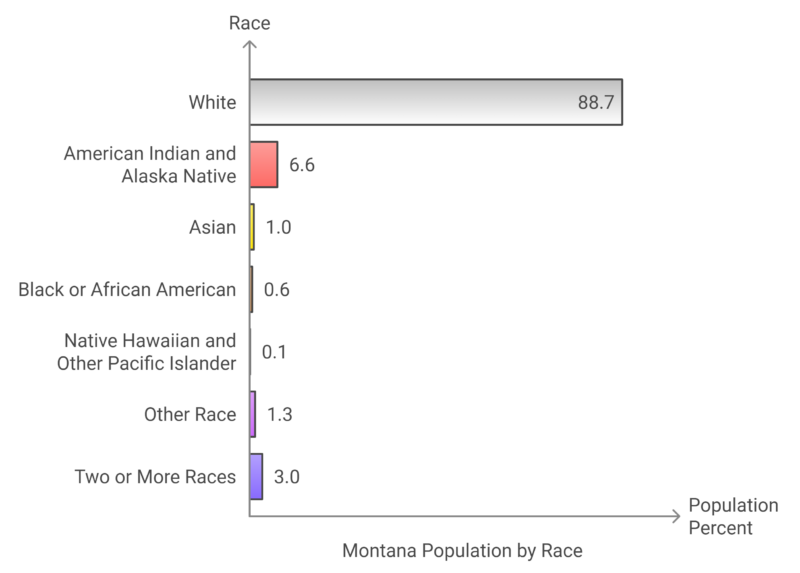
According to the ACS 2017-2021 estimates, Montana population is predominantly White, making up 88.7% of the state’s residents.
American Indian and Alaska Native individuals account for 6.6%, while other racial groups such as Asian (1.0%), Black or African American (0.6%), and Native Hawaiian and Other Pacific Islander (0.1%) represent smaller portions.
Those identifying as Two or More Races make up 3.0% of the population, and Other Race contributes 1.3%. This reflects Montana’s relatively homogeneous racial makeup with some diversity.
5. Economic Impact
In 2024, Montana’s economy showed robust growth across several key metrics, reflecting a thriving business environment and strong population growth.
Here’s a breakdown of the key economic indicators according to IBISWorld:
Key Economic Metrics (2019-2024)
Indicator
2024 Value
Growth Rate (2019-2024)
State Growth Rank
Gross State Product (GSP)
$57.3 billion
2.6%
15th
Population
1,146,085
1.4%
3rd
Number of Businesses
182,956
3.7%
7th
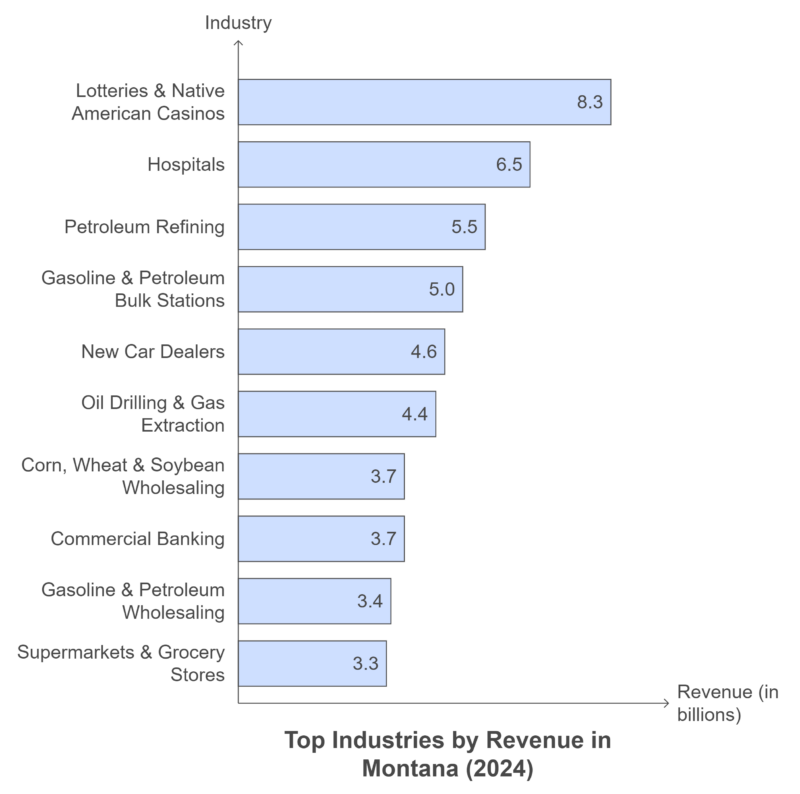
Top Industries by Revenue in Montana (2024)
Montana’s economy is significantly influenced by industries ranging from gaming and healthcare to petroleum refining and retail. The largest sectors by revenue in 2024 are shown in the table below:
Population and Economic Growth
Montana has demonstrated strong population growth (1.4% annually), ranking 3rd in the U.S. for population growth from 2019 to 2024. This growing population supports local markets and workforce expansion, which fuels economic activity in key industries such as real estate, healthcare, and retail.
Industry Performance
The Lotteries & Native American Casinos industry is Montana’s top revenue generator in 2024, pulling in $8.3 billion, followed by Hospitals ($6.5 billion) and Petroleum Refining ($5.5 billion). This illustrates Montana’s economic diversity, with industries ranging from gaming and healthcare to energy and retail playing crucial roles in its growth.
Business Expansion
The number of businesses in the state grew by 3.7% between 2019 and 2024, indicating a vibrant business climate. As more enterprises open and expand, employment opportunities grow, further driving economic output.
6. Employment
Month
Civilian Labor Force (in thousands)
Employment (in thousands)
Unemployment (in thousands)
Unemployment Rate (%)
March 2024
577.5
558.7
18.8
3.3
April 2024
577.8
559.7
18.0
3.1
May 2024
577.6
560.0
17.7
3.1
June 2024
578.4
560.7
17.7
3.1
July 2024
580.1
562.0
18.1
3.1
August 2024
581.2 (p)
562.6 (p)
18.6 (p)
3.2 (p)
The civilian labor force increased steadily from 577.5 thousand in March 2024 to 581.2 thousand in August 2024, reflecting growing participation in the job market.
Employment numbers followed a similar upward trend, rising from 558.7 thousand in March to 562.6 thousand in August, indicating continued job creation during this period.
Despite the rise in employment, the number of unemployed individuals fluctuated slightly, with a decrease from 18.8 thousand in March to 17.7 thousand in June, followed by a modest increase to 18.6 thousand by August.
The unemployment rate remained relatively stable, hovering around 3.1% to 3.3%, showing that Montana continues to have a relatively low unemployment rate. However, there was a slight uptick to 3.2% in August according to BLS.
7. Montana Income Statistics for 2024

In 2024, Montana’s income levels show a notable gap compared to the national averages.
Below is a detailed breakdown of income data:
Household Income
- Average Household Income: In 2024, the average household income in Montana is $90,142, which is 15% lower than the U.S. average of $105,833 according to Incomebyzipcode.
- Median Household Income: Montana’s median household income stands at $66,341, which is 12% lower than the U.S. median of $75,149.
The poverty threshold in Montana, similar to the national figure, is $27,750.
Richest Zip Codes in Montana (2024)
The table below highlights the 10 richest zip codes in Montana based on average household income from the latest Census data:
Rank
Zip Code
Population
Mean Household Income
Median Household Income
1
59106
19,057
$169,582
$114,911
2
59344
525
$142,093
$78,750
3
59803
17,109
$138,111
$98,233
4
59468
634
$134,129
$76,000
5
59001
1,337
$131,792
$76,120
6
59634
5,255
$131,535
$110,375
7
59716
2,144
$130,376
$98,207
8
59430
593
$127,598
$88,750
9
59715
39,061
$125,796
$76,708
10
59718
42,538
$119,487
$92,054
8. Migration Patterns

In-State vs. Out-of-State Arrivals
According to recent data, Montana ranked 13th in the nation for domestic migration in 2022. The latest figures from the U.S. Census Bureau indicate that the state experienced a population growth of 1.5%, with 16,003 new residents moving to the Treasure State.
Missoula realtor Paulette McMannis highlighted the appeal of Montana, noting,
“There are many opportunities here—great for raising families, numerous job prospects, and endless options for recreation, whether it’s enjoying the lakes, skiing, or hiking. Montana truly has a lot to offer.”
International Immigration
Category
Value
Immigrant Share of Population
2.4%
Immigrant Residents
27,000
Immigrant Spending Power
$828.6 million
Immigrant Taxes Paid
$244.5 million
Share of U.S.-Born Residents with at Least One Immigrant Parent
1.2%
Share of Foreign-Born Proficient in English
96.0%
Share of Immigrant Women
61.2%
Share of Immigrant Men
38.8%
Immigrants make up 2.4% of Montana population, contributing extensively to the state’s economy with $828.6 million in spending power and paying $244.5 million in taxes in 2022. This highlights their role as essential contributors to the state’s fiscal health and economy as per American Immigration Council.
Immigrants constitute 3.2% of Montana’s labor force, with the majority (80.7%) in the working-age group (16-64). This is significantly higher than the working-age percentage of the U.S.-born population (60.8%), emphasizing that immigrants are more likely to be active in the labor force, supporting economic growth and funding social programs.
A striking 96% of the foreign-born population is proficient in English, indicating high levels of integration into the state’s communities and labor market.
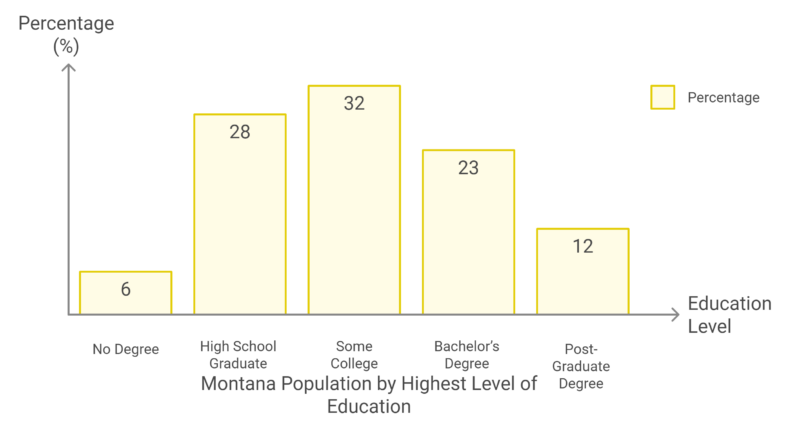
9. Educational Landscape
- High School Graduation Rate: 94.1% of Montana’s population has graduated high school or attained a higher level of education, slightly higher than the U.S. national average of 89.6% as per Census Reporter.
- Bachelor’s Degree or Higher: 34.6% of Montana residents hold a bachelor’s degree or higher, which is just below the national rate of 35.7%.
- Post-Graduate Degree: 12% of Montana’s population has obtained a post-graduate degree, approximately 80% of the national average of 14%.
Population by Highest Level of Education
10. Health Indicators
Health Indicator
Rate/Value
Fertility Rate
53.2 (births per 1,000 women aged 15-44)
Teen Birth Rate
12.2 (births per 1,000 females aged 15-19)
Infant Mortality Rate
4.65 (infant deaths per 1,000 live births)
Life Expectancy (at Birth)
75.8 years (2021)
Marriage Rate
9.9 (marriages per 1,000 people)
Divorce Rate
2.0 (divorces per 1,000 people)
Leading Cause of Death
Heart Disease
Drug Overdose Death Rate
19.4 (per 100,000 people)
Firearm Injury Death Rate
23.9 (per 100,000 people)
Montana’s fertility rate stands at 53.2 births per 1,000 women aged 15-44, reflecting a moderate rate of childbearing compared to national averages. Among younger females, the teen birth rate is 12.2 births per 1,000 females aged 15-19, which highlights ongoing challenges related to teenage pregnancies as per the CDC report.
The state’s infant mortality rate is 4.65 deaths per 1,000 live births, which aligns closely with the national average, demonstrating a moderate level of healthcare access for mothers and infants.
Meanwhile, life expectancy at birth in Montana is 75.8 years (as of 2021), slightly lower than the national average, suggesting potential areas for improvement in overall public health and healthcare delivery.

In terms of family dynamics, the marriage rate in Montana is 9.9 marriages per 1,000 people, indicating a relatively high rate of marital unions. The divorce rate, however, is comparatively low at 2.0 divorces per 1,000 people, which may suggest longer-lasting marriages in the state.
Health challenges persist, with heart disease identified as the leading cause of death in Montana, emphasizing the need for continued efforts in cardiovascular health awareness and prevention.
Other concerning trends include the drug overdose death rate of 19.4 per 100,000 people and the firearm injury death rate of 23.9 per 100,000 people, which reflect public health and safety issues, particularly related to substance abuse and gun violence.
11. Housing Market 2024 in Montana
Category
Value
Median Home Sales Price
$519,900
Increase in Median Sales Price (YoY)
$4,600 (0.9%)
National Median Home Sales Price
$426,601
Homes Sold in August
1,177 (up 0.9% from 2023)
Homes for Sale in August
5,777 (up 22.4% from 2023)
Median Days on Market
65 days (up 9 days from 2023)
Months of Housing Supply
4.9 months (up 48.5% from 2023)
Mortgage Rates
6.5%
Average Monthly House Payment
$3,429 (down $277 from 2023)
Comparison to National Median Home Value
17.9% higher than the national median
Home Price Comparison to Idaho
7.2% more expensive than Idaho
The median home sales price in Montana reached $519,900 in August 2024, which is 17.9% higher than the national median. Although prices have increased 0.9% year-over-year, this moderate growth reflects a market that is stabilizing after prior years of rapid appreciation.
Homes in Montana are taking longer to sell, with the median days on market rising from 56 days in 2023 to 65 days in 2024, signaling a slower market. This is likely due to increased inventory, as the number of homes for sale rose by 22.4% in the same period according to Bankrate.
Despite slower home sales, the market remains a seller’s market. The months of housing supply increased to 4.9 months, approaching the 5-6 month threshold typically indicative of a balanced market. However, demand is still high enough to favor sellers, particularly in desirable areas.
The average monthly mortgage payment in Montana dropped by $277 compared to 2023 due to fluctuating mortgage rates, currently at 6.5%. For buyers, a 10% down payment on the median home price would require $51,990, plus additional funds for closing costs and reserves, making homeownership in Montana a substantial financial commitment.
Montana homes are 7.2% more expensive than homes in neighboring Idaho, and significantly higher than the national average, indicating that housing costs in the state are on the upper end, especially in comparison to regional markets.
The number of homes available for sale has increased, reflecting a less constrained supply. The 22.4% increase in inventory suggests that while demand remains strong, buyers have more options, which could help stabilize prices in the future.
12. Future Projections
Montana population is projected to continue growing over the next few years. By 2025, the state’s population is expected to reach 1,116,868, representing a 5.2% increase since 2020. Looking further ahead to 2030, Montana’s population is projected to rise to 1,167,852, marking a 4.6% increase from 2025.
This growth trend is driven by factors such as in-migration, a growing economy, and Montana’s appeal as a destination for those seeking a high quality of life. Industries like tourism, agriculture, and energy continue to support this population expansion.
Over the longer term, projections suggest that Montana’s population will grow by about 15% from 2020 to 2040, with an estimated population of 1.24 million by 2040.
This steady growth reflects broader national trends, where states with strong economic opportunities and quality of life factors continue to attract new residents, even as other states experience slower growth or population decline as per Aterio.
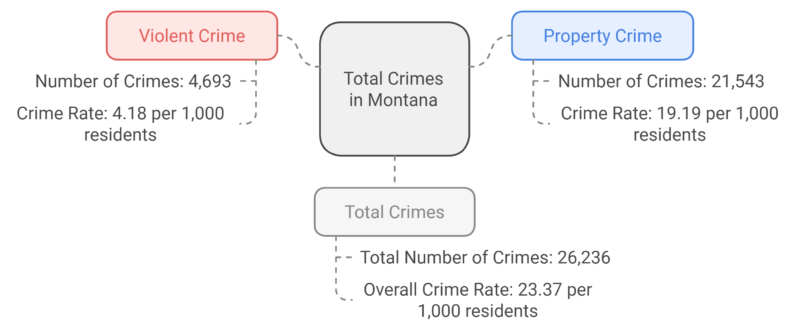
13. Montana Annual Crimes (2025)
Total Number of Crimes
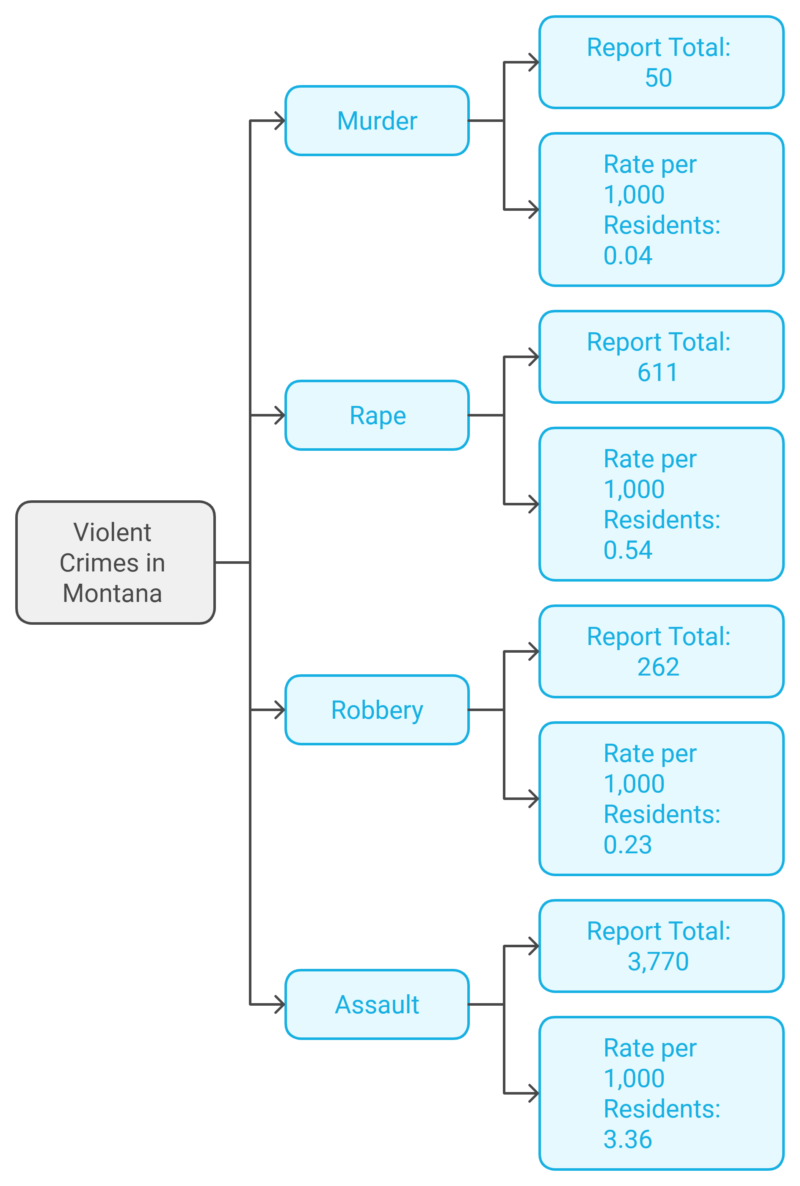
Violent Crimes Breakdown
Violent Crime Comparison (United States)
Property Crimes Breakdown
Property Crime Comparison (United States)
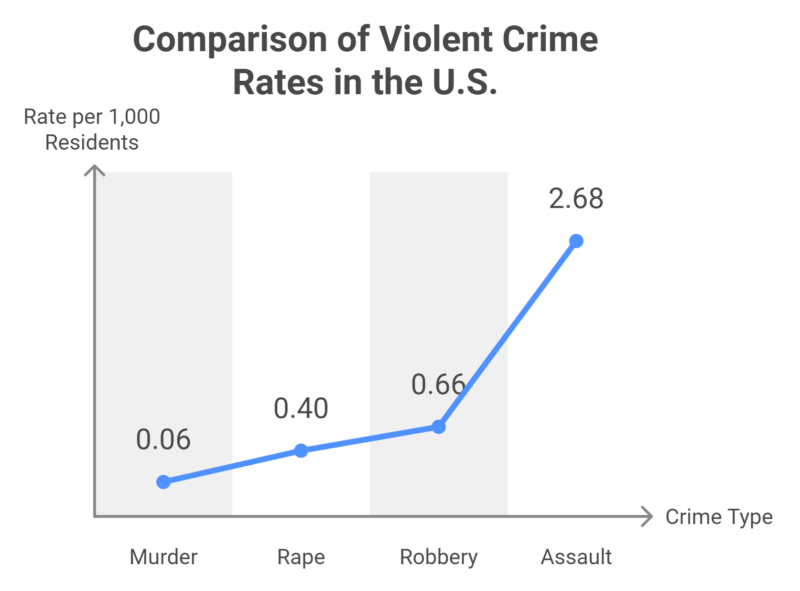
According to Neighborhood Scout, Montana has a total crime rate of 23.37 crimes per 1,000 residents, which includes both violent and property crimes. The state’s violent crime rate is 4.18 per 1,000 residents, with assault being the most common violent crime, representing 3.36 per 1,000 residents.
Compared to national averages, Montana’s violent crime rate is slightly higher for rape but lower for robbery and murder.
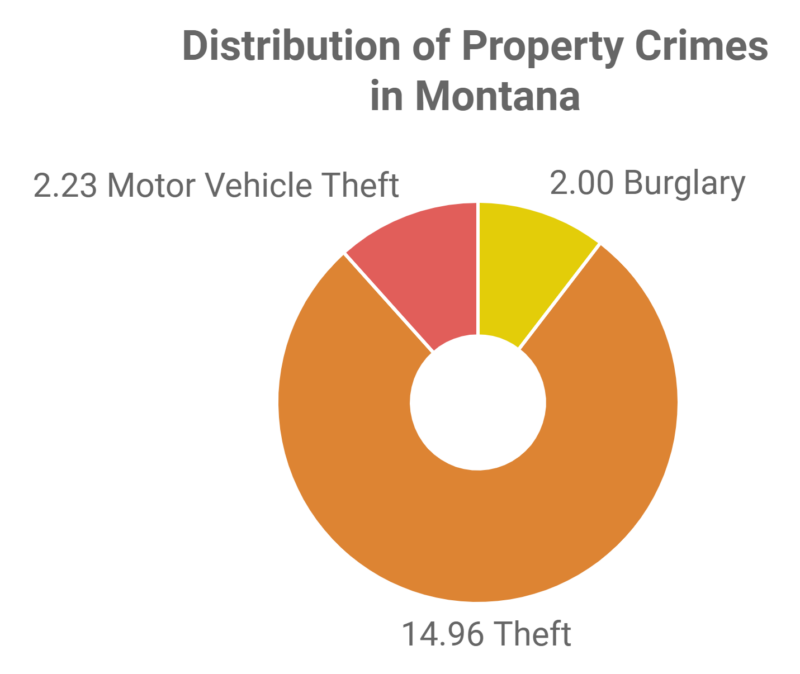
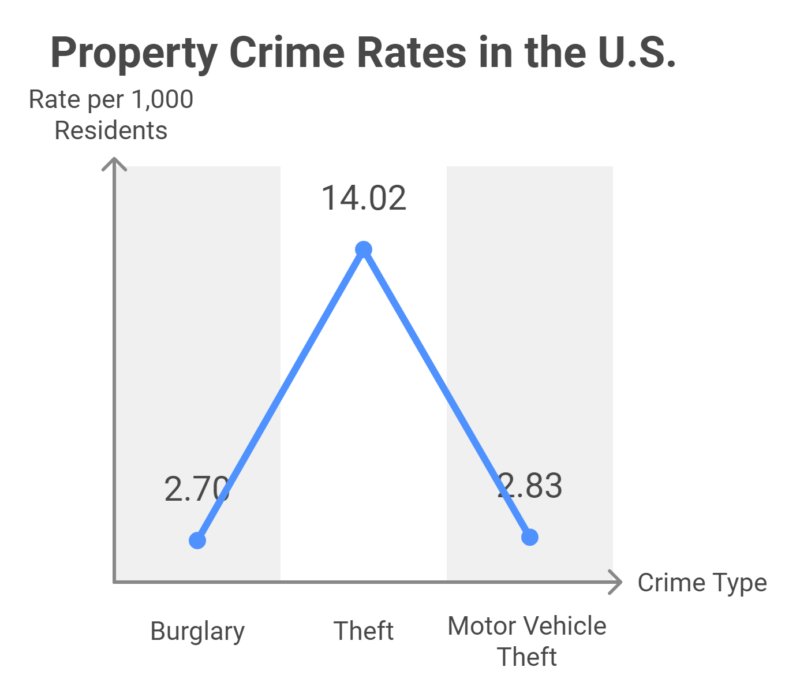
In terms of property crimes, Montana’s rate of 19.19 per 1,000 residents is largely driven by theft, with a 14.96 per 1,000 residents rate. The burglary rate is slightly lower than the national average, but motor vehicle theft remains relatively similar.
Methodology
To write this article, we collected demographic and economic data from reputable sources, including the U.S. Census Bureau, World Population Review, and IBISWorld.
We analyzed trends in Montana population growth, age distribution, economic performance, and housing market based on these datasets.
The article highlights key metrics from 2000 to 2025, contextualizing them within national averages and regional trends.
We ensured clarity by summarizing complex statistics into understandable insights, using year-on-year changes and long-term projections to inform readers.
Finally, we integrated migration patterns and income distribution to give a comprehensive view of Montana’s evolving demographics and economy.
Sources
- World Population Review – Montana Population 2024
- Neilsberg – Montana Population By Year
- Neilsberg – Montana Population By Age
- Census.gov – QuickFacts Montana
- Health Resources and Services Administration.gov – III.B. Overview of the State – Montana – 2024
- IBISWorld – Montana State Economic Profile
- BLS – Economy At Glance
- NBC Montana – Montana ranks in the top 15 for domestic migration
- American Immigration Council – Immigrants in Montana
- Census Reporter – Montana
- CDC – Montana
- Bankrate – Montana Housing Market
- Aterio – Montana projected population growth from 2025 through 2030
- Neighborhood Scout – Montana Crime Rate
- Census.gov – Montana