Nebraska population has continued to evolve in 2026, reflecting broader trends seen across urban and rural areas in the United States. The state has an estimated population of close to 1,988,700, with cities like Omaha and Lincoln showing significant growth according to World Population Review.
Omaha, the largest city, boasts a population of approximately 480,194, indicating strong urban development.
A closer look at demographic trends reveals that while the cities are flourishing, many rural counties are experiencing population declines.
More than half of Nebraska’s 93 counties have seen decreasing numbers over the past few decades.
This shift highlights the growing appeal and economic opportunities of urban centers like Omaha and Lincoln, where the population growth is markedly higher than in rural areas.
Key Takeaways
Population Size and Growth
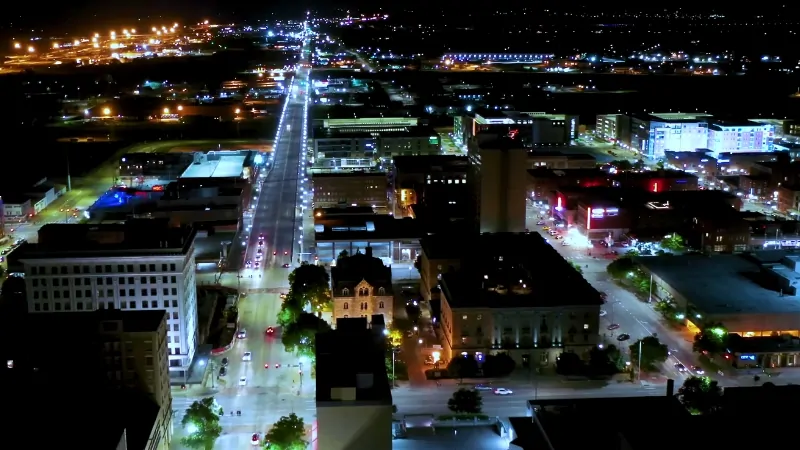
Urban areas, notably Omaha that is close to Iowa and Lincoln, have experienced faster growth rates than rural regions.
While the state’s overall growth rate is around 1.2% annually, urban areas show a higher rate of 1.8%, contrasting with rural areas that struggle with stagnation or even slight decline.
This urban-rural divide highlights ongoing trends of urbanization, driven by economic opportunities and amenities concentrated in cities.
Population by Race and Ethnicity
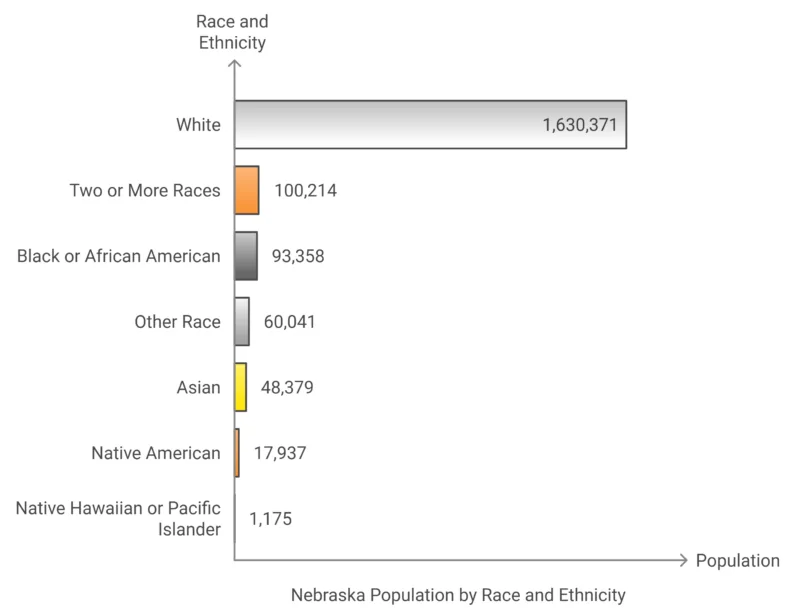
- White residents make up the overwhelming majority of Chicago’s population at 83.55%, representing 1,630,371 people.
- The next largest group is residents of Two or More Races, at 5.14%, which indicates a growing number of individuals identifying with more than one racial background.
- Black or African American individuals constitute 4.78% of the population, followed by Other Races at 3.08%, and Asian residents at 2.48%.
- Native American individuals make up 0.92% of the population, while Native Hawaiian or Pacific Islander residents are the smallest group, accounting for only 0.06%.
Age Distribution
The age distribution in Nebraska presents a population pyramid indicative of an aging society.
Age Group
Population
% of Total Population
Under 5 years
130,400
6.68%
5 to 9 years
134,936
6.91%
10 to 14 years
139,102
7.13%
15 to 19 years
136,774
7.01%
20 to 24 years
134,953
6.92%
25 to 29 years
127,489
6.53%
30 to 34 years
127,618
6.54%
35 to 39 years
132,373
6.78%
40 to 44 years
115,576
5.92%
45 to 49 years
109,824
5.63%
50 to 54 years
111,687
5.72%
55 to 59 years
122,330
6.27%
60 to 64 years
122,647
6.28%
65 to 69 years
103,470
5.30%
70 to 74 years
76,528
3.92%
75 to 79 years
49,580
2.54%
80 to 84 years
34,965
1.79%
85 years and over
41,228
2.11%
The largest age cohorts are between 35-54, reflecting a mature working population. However, there’s a noticeable growth in the 65+ age group, suggesting an aging population trend.
Conversely, younger age groups (under 18) have seen a slower growth rate, indicating potential challenges for future workforce replenishment.
These trends underline the need for policies addressing the aging population and encouraging youth retention.
County Population of Nebraska
Rank
County
Population
1
Douglas County
589,540
2
Lancaster County
326,716
3
Sarpy County
199,886
4
Hall County
62,197
5
Buffalo County
50,697
6
Dodge County
37,187
7
Scotts Bluff County
35,699
8
Madison County
35,627
9
Platte County
34,609
10
Lincoln County
33,365
11
Adams County
30,899
12
Cass County
27,446
13
Dawson County
24,085
14
Saunders County
23,463
15
Gage County
21,634
16
Dakota County
21,268
17
Washington County
21,152
18
Seward County
17,671
19
Otoe County
16,335
20
Saline County
14,555
21
York County
14,356
22
Box Butte County
10,692
23
Custer County
10,581
24
Colfax County
10,566
25
Red Willow County
10,457
26
Holt County
10,093
27
Wayne County
9,874
28
Cheyenne County
9,541
29
Hamilton County
9,537
30
Phelps County
9,057
31
Cuming County
8,918
32
Butler County
8,459
33
Knox County
8,298
34
Cedar County
8,262
35
Dawes County
8,133
36
Keith County
8,113
37
Merrick County
7,755
38
Richardson County
7,689
39
Pierce County
7,299
40
Nemaha County
7,076
41
Jefferson County
7,054
42
Kearney County
6,770
43
Burt County
6,727
44
Thurston County
6,557
45
Howard County
6,527
46
Antelope County
6,302
47
Clay County
6,116
48
Stanton County
5,856
49
Fillmore County
5,548
50
Cherry County
5,492
51
Dixon County
5,491
52
Boone County
5,310
53
Polk County
5,228
54
Johnson County
5,198
55
Sheridan County
4,928
56
Thayer County
4,829
57
Furnas County
4,556
58
Morrill County
4,504
59
Nuckolls County
4,095
60
Valley County
4,012
61
Chase County
3,724
62
Webster County
3,351
63
Kimball County
3,289
64
Nance County
3,274
65
Harlan County
3,045
66
Sherman County
2,983
67
Brown County
2,853
68
Franklin County
2,825
69
Perkins County
2,795
70
Frontier County
2,585
71
Hitchcock County
2,552
72
Pawnee County
2,512
73
Greeley County
2,219
74
Deuel County
1,871
75
Gosper County
1,847
76
Garden County
1,794
77
Garfield County
1,763
78
Boyd County
1,725
79
Dundy County
1,561
80
Rock County
1,271
81
Sioux County
1,154
82
Hayes County
846
83
Keya Paha County
805
84
Wheeler County
775
85
Hooker County
679
86
Thomas County
677
87
Banner County
674
88
Logan County
655
89
Loup County
592
90
Grant County
565
91
Blaine County
436
92
Arthur County
412
93
McPherson County
383
Source: Nebraska-Demographics
Employment and Labor Force
View this post on Instagram
Job Openings and Labor Turnover for Nebraska (Seasonally Adjusted)
Estimate
June 2023
March 2024
April 2024
May 2024
June 2024 (p)
Change from May to June 2024 (p)
Openings (thousands)
63
54
46
49
49
0
Hires (thousands)
40
38
37
38
38
0
Total Separations (thousands)
35
37
38
37
31
-6
Quits (thousands)
23
22
24
24
21
-3
Layoffs & Discharges (thousands)
9
13
10
10
9
-1
Key Observations
- Job Openings: The number of job openings in Nebraska remained stable at 49,000 in both May and June 2024, indicating a consistent demand for labor.
- Hires: Hires also remained stable at 38,000, consistent with the labor market’s need for new employees.
- Total Separations: There was a notable decrease in total separations, dropping from 37,000 in May to 31,000 in June, indicating fewer employees left their positions.
- Quits: The number of quits decreased from 24,000 in May to 21,000 in June, reflecting a decline in voluntary separations.
- Layoffs and Discharges: Layoffs and discharges decreased from 10,000 to 9,000 during the same period, signaling fewer involuntary job losses.
Job Openings and Labor Turnover Rates for Nebraska (Seasonally Adjusted)
Estimate
June 2023
March 2024
April 2024
May 2024
June 2024 (p)
Change from May to June 2024 (p)
Openings Rate (%)
5.6
4.8
4.1
4.4
4.4
0.0
Hires Rate (%)
3.8
3.6
3.5
3.6
3.6
0.0
Total Separations Rate (%)
3.3
3.5
3.6
3.5
2.9
-0.6
Quits Rate (%)
2.2
2.1
2.3
2.2
2.0
-0.2
Layoffs & Discharges Rate (%)
0.9
1.2
0.9
0.9
0.8
-0.1
Key Observations
- The job openings rate in Nebraska was 4.4% in June 2024, unchanged from May, indicating steady labor demand in the state.
- The hiring rate also remained stable at 3.6%.
- The total separations rate fell to 2.9% in June from 3.5% in May, reflecting fewer workers leaving employment.
- The quits rate decreased from 2.2% to 2.0%, showing a reduction in voluntary resignations.
- The layoffs and discharges rate also dropped slightly to 0.8%.
Job Openings and Labor Turnover Rates for the United States (Seasonally Adjusted)
Estimate
June 2023
March 2024
April 2024
May 2024
June 2024 (p)
Change from May to June 2024 (p)
Openings Rate (%)
5.5
5.0
4.8
4.9
4.9
0.0
Hires Rate (%)
3.8
3.6
3.5
3.6
3.4
-0.2
Total Separations Rate (%)
3.6
3.4
3.4
3.4
3.2
-0.2
Quits Rate (%)
2.4
2.2
2.2
2.1
2.1
0.0
Layoffs & Discharges Rate (%)
1.0
1.0
1.0
1.1
0.9
-0.2
National Comparisons
- The job openings rate at the national level was 4.9% in June 2024, unchanged from May, which is slightly higher than Nebraska’s rate of 4.4%.
- The hiring rate for the U.S. decreased to 3.4% in June, slightly below Nebraska’s rate of 3.6%, indicating a relatively stable hiring market in Nebraska.
- The total separations rate at the national level also declined to 3.2% in June, which was higher than Nebraska’s 2.9%.
- The quits rate at the national level was 2.1%, just above Nebraska’s rate of 2.0%, suggesting that fewer workers in Nebraska chose to leave their jobs compared to the national average.
- The layoffs and discharges rate dropped to 0.9% nationally, similar to Nebraska’s 0.8%, indicating a slight reduction in involuntary separations.
In June 2024, Nebraska’s labor market remained relatively stable, with job openings and hires unchanged from May at 49,000 and 38,000, respectively. Separations, including quits and layoffs, showed a decrease, reflecting a reduction in workforce movement.
Nebraska’s job openings rate stood at 4.4%, slightly lower than the national average of 4.9%, suggesting a somewhat tighter labor market compared to other states. Overall, the data points to a steady job market in Nebraska, with fewer job separations and consistent hiring activity according to BLS.
Income Levels
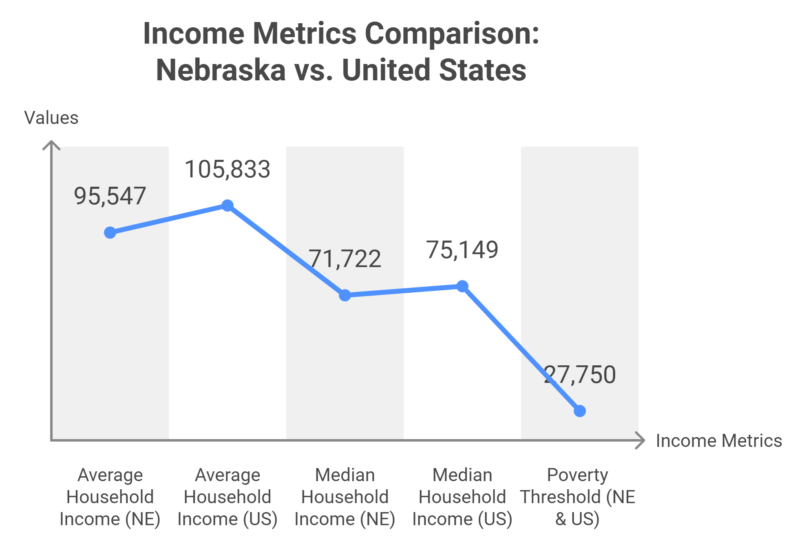
- Average Household Income: The average income for households in Nebraska is $95,547, which is 10% lower than the national average income of $105,833. This indicates a noticeable gap between Nebraska’s household earnings and the broader U.S. income levels as per IncomeByZipCode.
- Median Household Income: The median household income in Nebraska is $71,722, which is 5% lower than the U.S. median of $75,149. This difference points to slightly lower earnings at the median level, reflecting the income disparity between Nebraska households and those across the country.
- Poverty Threshold: The poverty threshold for both Nebraska and the U.S. is $27,750, showing consistency in the defined minimum income level required to meet basic living standards.
Education Attainment
Key Observations
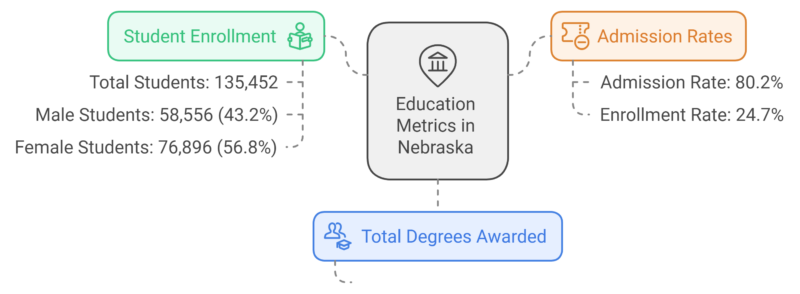
- Degree Awards: In 2022, universities in Nebraska awarded 33,026 degrees, reflecting a significant output of graduates across the state.
- Student Demographics: The student population is skewed towards women, with 76,896 female students (56.8%) compared to 58,556 male students (43.2%). This suggests that a higher proportion of college students in Nebraska are women.
- Admissions: The admission rate in Nebraska for 2022 was 80.2%, meaning a large majority of applicants were accepted. However, only 24.7% of those admitted enrolled, indicating that many accepted students chose not to attend.
Degree Demographics
Key Observations
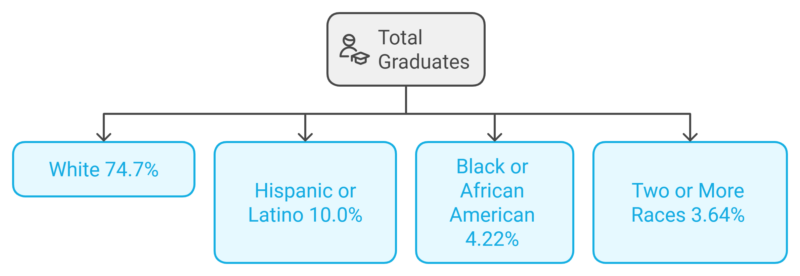
- Most Graduates are White: The majority of students graduating from universities in Nebraska were White (74.7%), followed by Hispanic or Latino students (10.0%).
- Minority Representation: Black or African American students made up 4.22%, and students identifying with Two or More Races accounted for 3.64% of graduates.
Largest Universities by Degrees Awarded
Key Observations
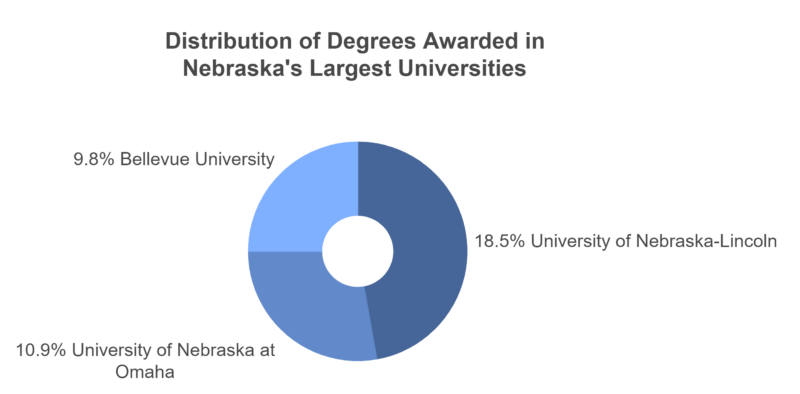
- University of Nebraska-Lincoln awarded the highest number of degrees, accounting for 18.5% of all degrees awarded in the state.
- University of Nebraska at Omaha and Bellevue University followed, contributing 10.9% and 9.8% respectively.
Popular Majors in Nebraska
Key Observations
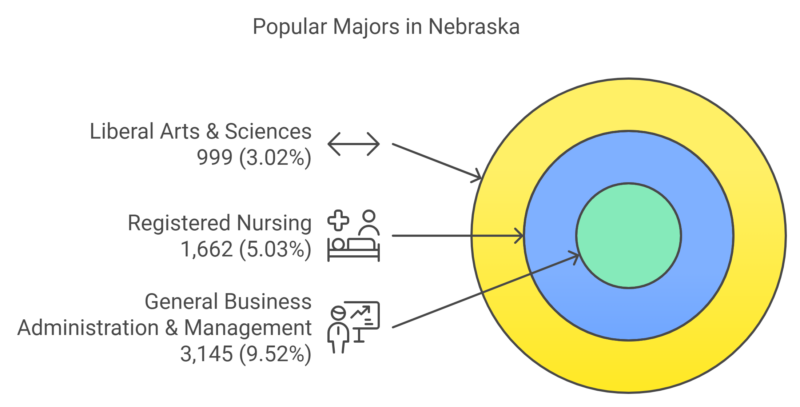
- General Business Administration & Management is the most popular major, accounting for 9.52% of all graduates.
- Other popular fields include Registered Nursing (5.03%) and Liberal Arts & Sciences (3.02%), showing a balanced interest in both healthcare and general education pathways.
Tuition Costs
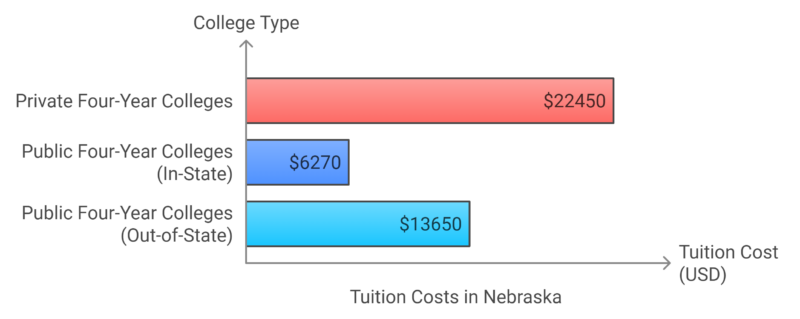
Key Observations
- Private college tuition is significantly higher, with a median cost of $22,450 for a four-year education.
- Public colleges are more affordable for in-state students ($6,270), while out-of-state tuition rises to $13,650.
In 2022, Nebraska’s higher education landscape awarded 33,026 degrees, with a predominantly female student population (56.8%). Most graduates were White (74.7%), with the largest universities being the University of Nebraska-Lincoln and Bellevue University.
Popular majors included Business Administration, Nursing, and Liberal Arts. Tuition costs in Nebraska varied widely, with private college tuition significantly higher than public in-state rates. Admission rates were high (80.2%), but only about a quarter of those admitted chose to enroll, reflecting various factors impacting student decisions to attend higher education institutions in the state as per DATAUSA.IO.
Housing Market and Living Conditions
Metric
Value
Change (Year-Over-Year)
Median Sale Price
$294,600
+2.5%
Number of Homes Sold
1,997
-3.8%
Median Days on Market
20 days
+5 days
The Nebraska housing market in August 2024 saw an increase in median home prices by 2.5%, reaching $294,600, indicating a continued rise in home value according to Redfin.
However, there was a 3.8% decline in the number of homes sold, and homes were staying on the market for longer, with a median of 20 days, 5 days more than last year.
This trend points to a market where buyers are perhaps more hesitant, or where higher prices are limiting the number of transactions, contributing to longer sales cycles.
In this kind of environment, exterior upkeep can become even more important, as curb appeal and visible property maintenance often shape a buyer’s first impression and may influence perceived home value.
Well-maintained trees and landscaping can also improve safety and help preserve the overall condition of the property. For homeowners in Lincoln, Tree Wise Men can be a practical resource for exterior tree care and maintenance.
Migration and Mobility
| Metric | Value |
|---|---|
| Immigrant Share of Population | 7.1% |
| Total Immigrant Residents | 140,000 |
| Immigrant Spending Power | $3.9 billion |
| Immigrant Taxes Paid | $1.3 billion |
| Data Year | 2022 |
| Share of U.S.-Born Population with Immigrant Parent | 4.4% |
| Immigrant Workforce Contribution | 8.5% of the labor force |
| Immigrant Share in STEM Jobs | 12.1% |
| Immigrant Share in Manufacturing Workforce | 21.4% |
Age Distribution
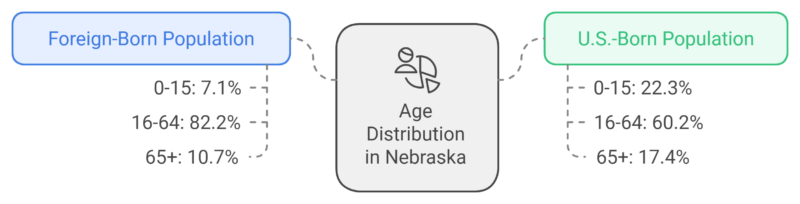
Key Observations
- Population Share: 7.1% of Nebraska’s residents are foreign-born, totaling 140,000 immigrants.
- Children and Families: 4.4% of the state’s residents are U.S.-born individuals living with at least one immigrant parent, accounting for 81,100 residents.
- Economic Contributions: Immigrants have a spending power of $3.9 billion and contribute $1.3 billion in taxes, playing a significant role in the state’s economy.
- Labor Force Impact: Immigrants make up 8.5% of Nebraska’s labor force, significantly contributing to key sectors:
- They account for 12.1% of STEM workers.
- They represent 21.4% of the manufacturing workforce, highlighting their essential role in Nebraska’s industrial sectors.
Gender and Proficiency
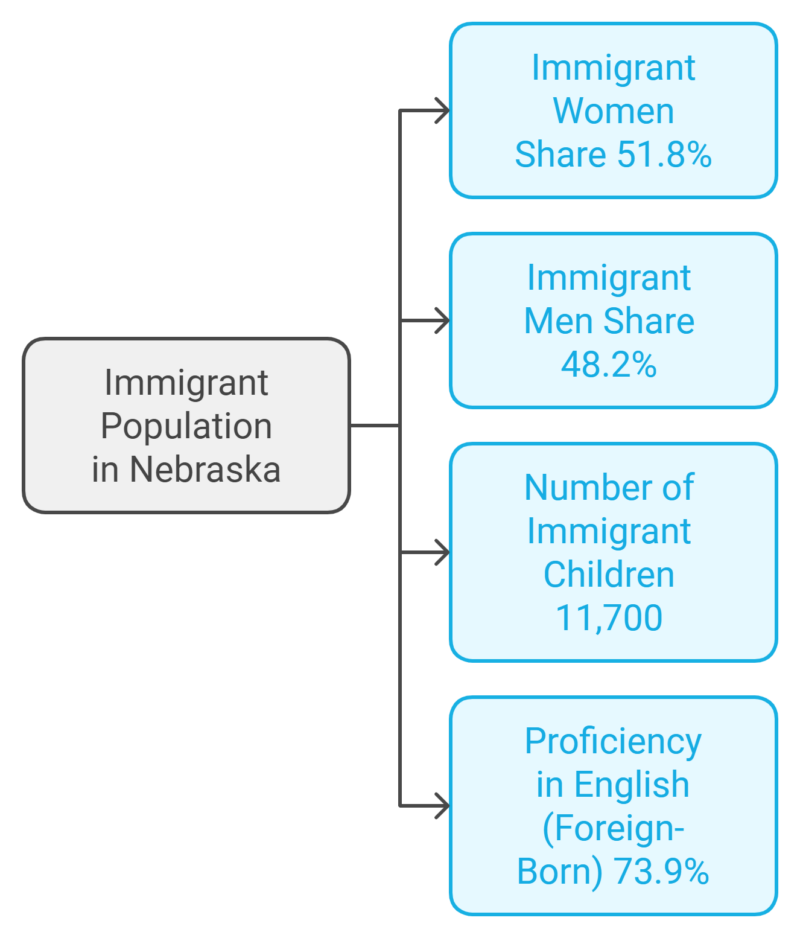
Key Observations
- Gender Balance: The immigrant community is almost evenly split by gender, with 51.8% women and 48.2% men.
- English Proficiency: Approximately 73.9% of foreign-born residents are proficient in English, which facilitates greater integration into the workforce and community life.
Nebraska’s immigrant community plays a crucial role in the state’s demographic and economic fabric. They comprise 7.1% of the population and make significant contributions across sectors, especially in STEM and manufacturing, where they hold 12.1% and 21.4% of jobs, respectively.
With a spending power of $3.9 billion and $1.3 billion in taxes paid, immigrants are pivotal as consumers and taxpayers according to the American Immigration Council.
They are generally of working age, enhancing their active role in Nebraska’s labor market, while a majority (73.9%) are proficient in English, aiding in social and economic participation.
Methodology
This article was developed using data from credible sources, including World Population Review, U.S. Census Bureau, and Bureau of Labor Statistics.
We integrated information on population trends, labor force dynamics, housing, and immigration, with a focus on year-over-year changes and demographic breakdowns.
Data was seasonally adjusted and interpreted to highlight key challenges, such as the urban-rural divide, income disparity, and housing trends.
Emphasis was placed on providing actionable insights to understand how these trends impact Nebraska’s socio-economic landscape.
References:
- World Population Review – Nebraska Population Statistics
- Nebraska Demographics – County Population in Nebraska
- Redfin – Nebraska Housing Market
- Income By Zip Code – Income Levels in Nebraska
- DATAUSA.IO – Nebraska Education and Employment Trends
- Bureau of Labor Statistics – Nebraska Job Openings and Labor Turnover
- American Immigration Council – Nebraska Immigrant Statistics
- Nebraska Housing Market Data – Real Estate Trends
- University Data – Degrees and Majors in Nebraska
- Migration Trends Video – YouTube