Philadelphia is a lovely city located in Delaware County Pennsylvania. According to recent data, Philly population in 2025 is estimated at 1,533,828 according to World Population Review.
This represents a decline of 4.18% since the 2020 census, which recorded a population of 1,603,797.
This decrease represents a shift from the city’s previous growth pattern.
Between 2000 and 2020, Philadelphia saw a modest increase in its population. However, the onset of the COVID-19 pandemic in 2020 marked a turning point, with the city losing over 53,000 residents in the following years.
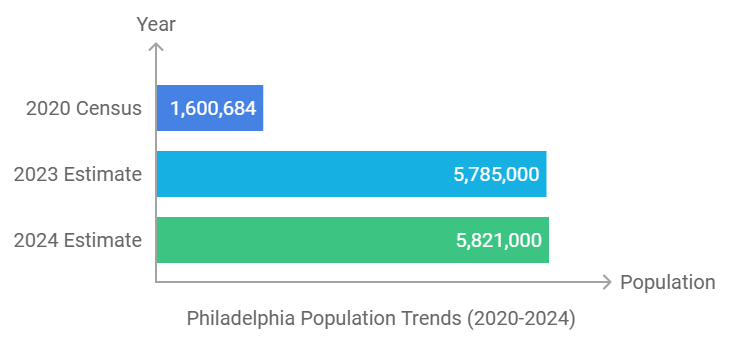
Despite the city proper’s declining numbers, the Philadelphia metropolitan area continues to grow, reaching a population of 5,821,000 in 2025.
Key Takeaways
Population Growth Patterns

Philadelphia population grew rapidly from its founding until the mid-20th century. The city reached its peak population of 2,071,605 in 1950, ranking as the 3rd largest city in the US at that time as per biggestuscitties.com.
After 1950, Philadelphia experienced a significant population decline. This was due to suburbanization and deindustrialization trends affecting many American cities.
In recent decades, the population has stabilized. The city has seen modest growth and decline periods, with the current trend showing a slight decrease.
Census Data Analysis
The city is currently experiencing an annual population decline rate of 1.08%. This trend reflects ongoing challenges in retaining residents and attracting new ones.
Despite the overall decline, Philadelphia’s metro area population continues to grow. In 2025, the metro area population is estimated at 5,821,000, showing a 0.62% increase from 2023.
Philadelphia’s population has declined in recent years.
This represents a decrease of 4.18% since the 2020 census, which recorded 1,600,684 inhabitants.
The annual rate of population decline is approximately 1.08%. This trend marks a reversal from the slow but steady population growth observed in the previous decade.
Demographic Breakdown
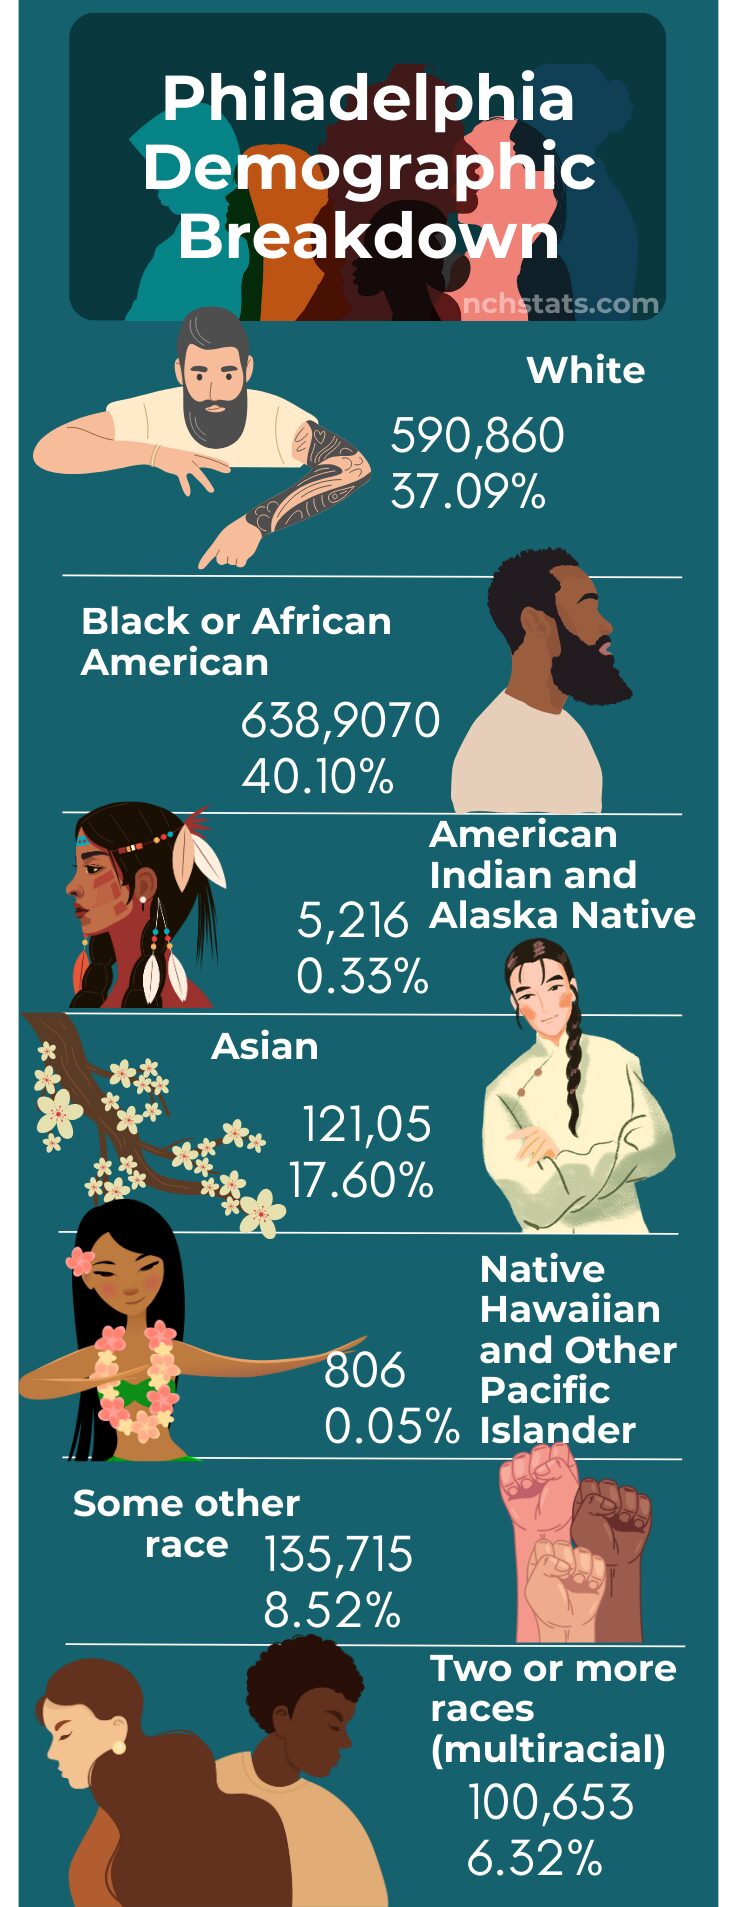
Philadelphia’s racial and ethnic composition remains diverse. The city’s population includes significant African American, White, Hispanic, and Asian communities.
While exact percentages for 2025 are not provided, historical data indicates a plurality of African American residents, followed by White non-Hispanic residents. The Hispanic population has shown growth trends in recent years according to neilsberg.com.
Race
Population
% of Total Population
White
590,860
37.09%
Black or African American
638,907
40.10%
American Indian and Alaska Native
5,216
0.33%
Asian
121,051
7.60%
Native Hawaiian and Other Pacific Islander
806
0.05%
Some other race
135,715
8.52%
Two or more races (multiracial)
100,653
6.32%
Household and Family Structures
Philadelphia’s household composition varies across different neighborhoods. The average household income in Philadelphia is $84,435, indicating a range of economic situations among residents according to Point2Homes.
Family households, including married couples with and without children, make up a significant portion of the population. Single-parent households are also common in certain areas of the city.
Non-family households, including single individuals and unrelated roommates, are prevalent, especially in areas popular with young professionals and students.

The per capita income in Philadelphia is $35,553, which is significantly lower than the national average of $41,261, indicating that individuals in the city earn about $5,708 less annually compared to the average American. This income gap highlights potential issues related to the types of industries prevalent in Philadelphia, educational attainment levels, and the availability of high-paying job opportunities.
Additionally, the median household income in Philadelphia stands at $57,537, which falls short of the national median of $75,149 by $17,612.
This substantial difference suggests that Philadelphia households generally have less disposable income, potentially impacting their ability to afford housing, healthcare, education, and other essential needs, thereby influencing the overall quality of life in the city.
Compounding these economic challenges, 22.7% of individuals in Philadelphia live below the poverty level, a rate significantly higher than the national average.
In comparison, households in Atlanta have a median income that is more closely aligned with the national average, suggesting a stronger economic base in that city.
Total Population by Neighborhood
| Rank | Neighborhood | Population |
|---|---|---|
| 1 | Oxford Circle | 48,860 |
| 2 | Olney | 39,150 |
| 3 | West Oak Lane | 38,700 |
| 4 | Mayfair | 36,390 |
| 5 | Cobbs Creek | 33,370 |
| 6 | Somerton | 33,250 |
| 7 | Bustleton | 32,660 |
| 8 | Overbrook | 32,180 |
| 9 | Holmesburg | 28,050 |
| 10 | Richmond | 27,550 |
| 11 | Rhawnhurst | 25,580 |
| 12 | Lawndale | 24,130 |
| 13 | Upper Kensington | 23,880 |
| 14 | Frankford | 23,500 |
| 15 | Logan | 21,930 |
| 16 | Rittenhouse | 21,580 |
| 17 | Wissinoming | 21,450 |
| 18 | Haddington | 20,070 |
| 19 | Hartranft | 19,750 |
| 20 | Fox Chase | 19,730 |
| 21 | Kingesessing | 19,690 |
| 22 | Mt Airy E | 18,520 |
| 23 | Tacony | 17,850 |
| 24 | Hunting Park | 17,680 |
| 25 | Juniata Park | 17,640 |
| 26 | Univ City | 17,580 |
| 27 | Feltonville | 17,310 |
| 28 | Elmwood | 16,990 |
| 29 | Point Breeze | 16,980 |
| 30 | Parkwood Mnr | 16,790 |
| 31 | Lower Moyamensing | 16,480 |
| 32 | Fishtown | 16,310 |
| 33 | Strawberry Mansion | 15,780 |
| 34 | North Central | 15,450 |
| 35 | Grays Ferry | 14,840 |
| 36 | Ogontz | 14,740 |
| 37 | Allegheny W | 14,250 |
| 38 | Wynnefield | 14,180 |
| 39 | Roxborough | 14,130 |
| 40 | Harrowgate | 13,990 |
| 41 | Washington Sq | 13,440 |
| 42 | Mt Airy W | 12,640 |
| 43 | Stanton | 12,460 |
| 44 | Paschall | 12,450 |
| 45 | Cedarbrook | 12,220 |
| 46 | Carroll Park | 11,770 |
| 47 | W Kensington | 11,530 |
| 48 | Tioga | 11,420 |
| 49 | Girard Ests | 11,260 |
| 50 | Graduate Hospital | 11,230 |
Economic Impacts of Population Changes
Housing Market Trends

In 2022, the median property value in Philadelphia, PA, stood at $215,500, making it about 76.4% of the national median property value of $281,900. This represents a significant increase from the previous year, with property values rising from $184,100 in 2021 to $215,500 in 2022, marking a 17.1% growth.
The homeownership rate in Philadelphia is 52.2%, which is fairly close to the national average of 64.8%.
The Philadelphia population has an average commute time of 32.8 minutes, with most people driving alone to work. Car ownership in the city is lower than the national average, with households typically owning only one car.
The median household income in Philadelphia is $57,537. In 2022, the area with the highest median household income was Census Tract 367, boasting a median income of $172,610. This was followed by Census Tract 231, with a median income of $170,625, and Census Tract 386, where the median income was $164,167 as per datausa.io.
Public Services and Infrastructure Demands
The population decline affects the city’s public services and infrastructure needs. With fewer residents, there may be reduced pressure on some public services.
This could lead to budget adjustments for schools, public transportation, and healthcare facilities. However, an aging population might increase demand for specific services like senior care and accessible transportation.
Infrastructure planning may need to adapt to changing population patterns, potentially focusing on maintaining existing structures rather than expansion. The city might also need to reassess its tax base to ensure adequate funding for essential services.
Immigration and Cultural Integration

Philadelphia has seen a notable increase in its immigrant population in recent years. The Latino community has experienced substantial growth, nearly doubling in size between 2000 and 2022.
This demographic shift has enriched the city’s cultural landscape. New communities have brought diverse traditions, cuisines, and languages to Philadelphia’s neighborhoods. Integration efforts have focused on language support services and cultural exchange programs.
Challenges remain in areas such as housing and employment for newcomers. Local organizations work to bridge gaps and facilitate smoother transitions for immigrant families.
Education System Impacts
View this post on Instagram
Healthcare Accessibility
The Philadelphia population has highlighted disparities in healthcare access. Efforts are underway to improve healthcare services for diverse communities.
Language barriers remain a key challenge. Hospitals and clinics have increased the availability of interpretation services and multilingual health information materials.
Cultural competency training for healthcare providers has become more prevalent.
This training aims to enhance understanding of different cultural health beliefs and practices.
Community health initiatives have expanded to reach underserved populations. Mobile clinics and neighborhood health centers work to provide care in areas with limited access to medical facilities.
Government and Policy Response

The city council has passed several bills aimed at population retention and growth. A 2024 housing affordability ordinance requires new developments to include a percentage of below-market-rate units. This policy seeks to combat gentrification and maintain economic diversity.
These measures aim to boost employment opportunities and attract working-age residents to the city.
Philadelphia has also strengthened tenant protection laws to promote housing stability. The eviction diversion program, made permanent in 2023, helps prevent displacement of long-term residents.
Urban Planning and Development Strategies
City planners have prioritized transit-oriented development to revitalize neighborhoods and improve quality of life. The Philadelphia 2035 comprehensive plan emphasizes mixed-use developments near public transit hubs.
Investments in public spaces and green infrastructure aim to enhance livability. The city has committed to adding 1,000 acres of new parkland by 2026.
Efforts to attract and retain young professionals include expanded bike lanes and pedestrian-friendly streetscapes. Tech industry incentives and startup incubators aim to diversify the economic base.
Neighborhood revitalization programs target areas hit hardest by population loss. These initiatives focus on rehabilitating vacant properties and supporting local businesses.
Future Projections

Philadelphia population indicates potential shifts. Recent data shows a decline of 3.3% since 2020, with over 53,000 residents leaving the city. This trend may continue in the short term.
Factors influencing these projections include:
- Economic recovery and job growth
- Housing market dynamics
- Quality of life improvements
- Immigration policies
Experts caution that long-term forecasts remain challenging due to unforeseen events and changing societal patterns.
Challenges and Opportunities
Philadelphia faces several hurdles in reversing population decline. High poverty rates and concerns about public safety may deter potential residents. The city’s aging infrastructure also presents challenges for growth and development.
The real estate market shows promise, with home values increasing 6.4% over the past year. This trend could attract new residents seeking affordable housing options compared to nearby metropolitan areas.
Opportunities for population growth include:
- Revitalization of urban neighborhoods
- Expansion of educational and healthcare sectors
- Improvements in public transportation
- Development of green spaces and recreational areas
City planners and policymakers must address these factors to shape Philadelphia’s demographic future effectively.
Crime Rates
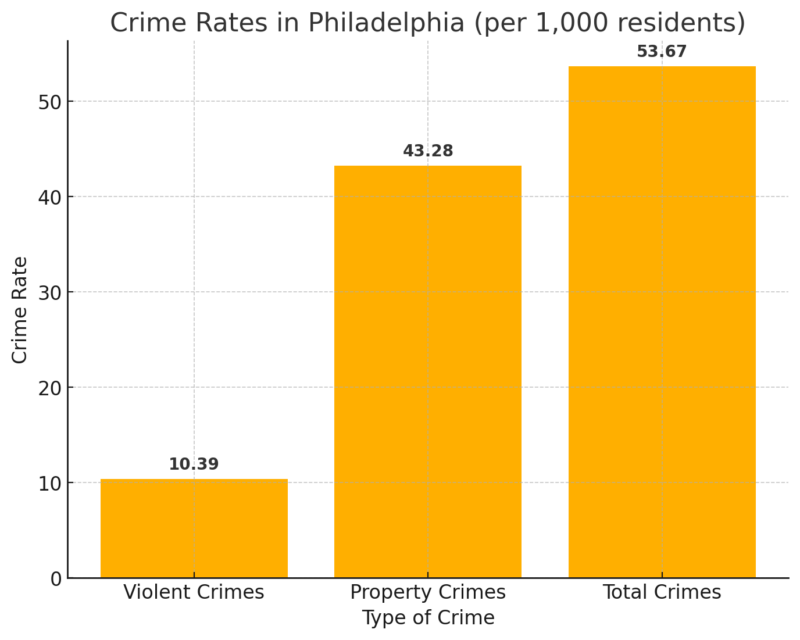
Philadelphia, the largest city in Pennsylvania, continues to struggle with high crime rates, ranking in the bottom 2% of U.S. cities for overall safety. This analysis explores both violent and property crime statistics in the city, comparing them to state and national averages.
Philadelphia’s total crime index is 2 out of 100, making it safer than only 2% of cities in the United States. The city records 84,121 annual crimes, with 16,290 violent crimes and 67,831 property crimes. The overall crime rate in Philadelphia stands at 53.67 crimes per 1,000 residents according to Neighborhood Scout.
Violent Crime Breakdown
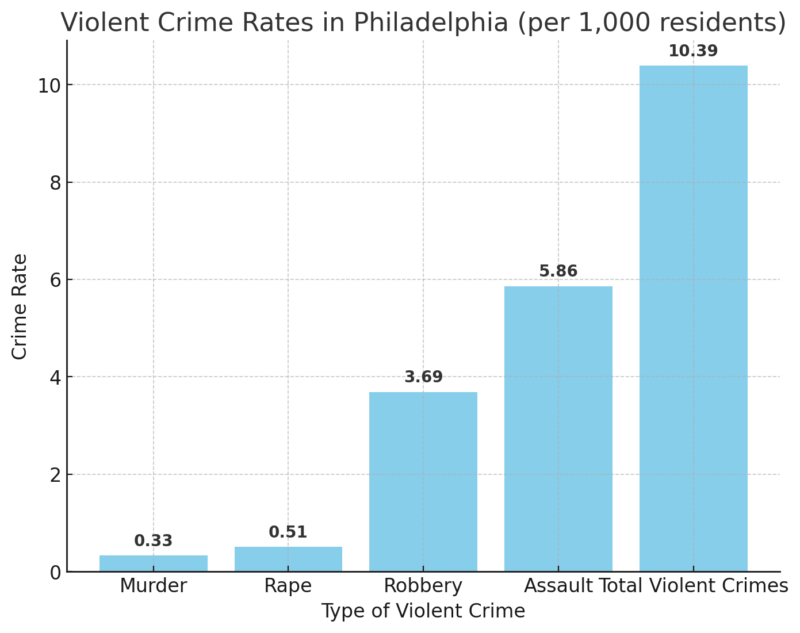
Violent crime in Philadelphia is significantly higher than both the Pennsylvania state average and the national average. The chances of becoming a victim of violent crime in Philadelphia are 1 in 96, compared to 1 in 357 in Pennsylvania.
The city’s violent crime rate is driven by incidents of assault and robbery, with the following breakdown:
In comparison, the national violent crime rate is lower across the board, with a murder rate of 0.06 per 1,000 residents and an assault rate of 2.68 per 1,000.
Property Crime Breakdown
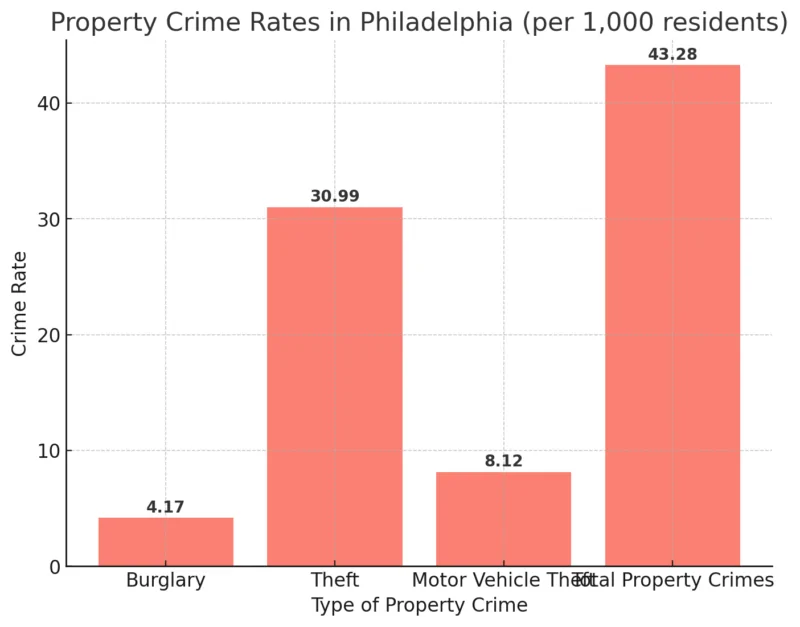
Philadelphia residents face a 1 in 23 chance of becoming a victim of property crime, much higher than the state average of 1 in 67. Property crimes in the city are overwhelmingly driven by theft, which accounts for more than 70% of all property crimes.
In comparison, the national property crime rate is much lower, with a theft rate of 14.02 per 1,000 residents and a motor vehicle theft rate of 2.83 per 1,000.
Philadelphia vs. National and State Levels
Philadelphia’s crime rates are consistently higher than both Pennsylvania’s state averages and national averages.
| Metric | Philadelphia | Pennsylvania | United States |
|---|---|---|---|
| Total Crime Rate (per 1,000) | 53.67 | N/A | N/A |
| Violent Crime Rate | 10.39 | 3.25 | 4.01 |
| Property Crime Rate | 43.28 | 14.92 | 17.55 |
| Chance of Being a Victim (Violent) | 1 in 96 | 1 in 357 | 1 in 249 |
| Chance of Being a Victim (Property) | 1 in 23 | 1 in 67 | 1 in 57 |