

The city’s population now stands at 303,413, marking a modest growth of 0.21% since the 2020 census when it had 302,971 people within the city, with the broader metro area reaching around 2.42 million according to World Population Review.
The Pittsburgh metro area, despite a slight decline in recent years, remains a significant focus for researchers and planners alike.
With demographic changes reflecting broader national trends, Pittsburgh offers a compelling case study in urban evolution.
Key Takeaways
1. Population Trends from 2000 to 2023

Between the years 2000 and 2023, Pittsburgh’s population experienced significant changes, marked by periods of both decline and minimal growth. Below is a breakdown of key population trends:
1.1. Population Changes (2000-2023)
- Peak Population: In 2000, Pittsburgh’s population peaked at 333,595.
- Lowest Population: In 2019, the population was at its lowest point at 300,056.
- Estimated Population in 2023: 303,255.
Year
Population
Growth/Decline
2000
333,595
–
2010
305,351
-8.47%
2020
302,779
-0.84%
2023
303,255
+0.16%
1.2. Annual Growth Rate (2000-2023)
Pittsburgh’s average annual population growth rate was 0.40%. Over the 23 years from 2000 to 2023, the population grew for 7 years and declined for 16 years, leading to an overall population decrease of 9.09% according to Neilsberg.
Period
Change in Population
Growth/Decline Rate
2000-2010
-28,244
-8.47%
2010-2020
-2,572
-0.84%
2020-2023
+476
+0.16%
1.3. Population Highlights
- Largest Growth: From 2019 to 2020, Pittsburgh’s population grew by 2,723 people (+0.91%).
- Largest Decline: From 2009 to 2010, the population decreased by 8,089 people (-2.58%).
3. Demographic Profile in 2025
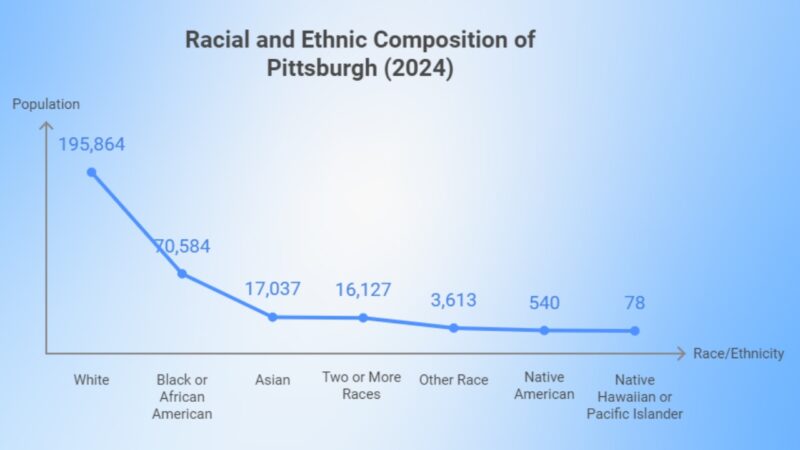
The racial composition of Pittsburgh shows a predominantly White population at 64.46%, followed by a significant Black or African American minority, representing 23.23% of the total population.
Other racial groups include Asians (5.61%), those identifying as Two or More Races (5.31%), and small percentages of Native American and Native Hawaiian or Pacific Islander populations. These numbers reflect Pittsburgh’s rich diversity, although the White population remains the majority.
Population Pyramid
Age Group
Male Population
Female Population
0-10
18,000
16,000
10-20
14,000
12,000
20-30
12,000
10,000
30-40
10,000
8,000
40-50
8,000
6,000
50-60
6,000
4,000
60-70
4,000
2,000
Pittsburgh’s population pyramid reveals that younger age groups (ages 0-20) maintain a balanced gender ratio, but as age increases, the population size begins to shrink, particularly in males. Females outnumber males slightly in the older age brackets, reflecting typical demographic trends where women tend to live longer than men.
Median Age Data (2025)
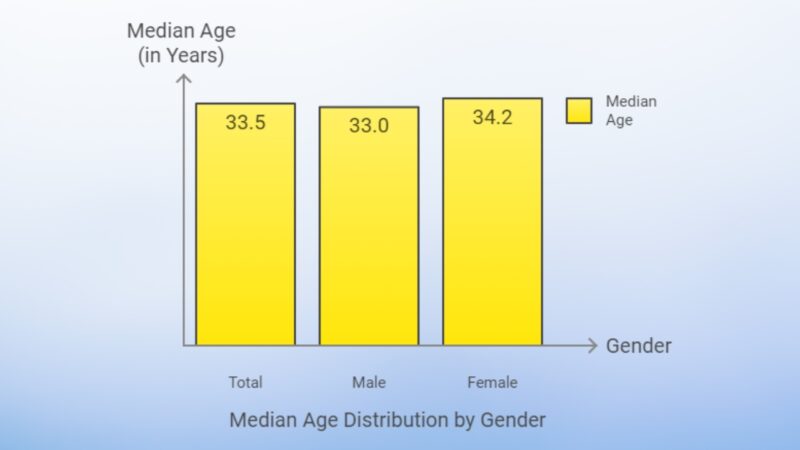
The median age in Pittsburgh is 33.5 years, indicating a relatively young population overall. Interestingly, the median age for males is slightly lower at 33 years, while for females, it’s higher at 34.2 years.
This suggests a small but noteworthy demographic difference in age distribution between the sexes, which could be influenced by factors such as longer life expectancy in females.
Adult Population
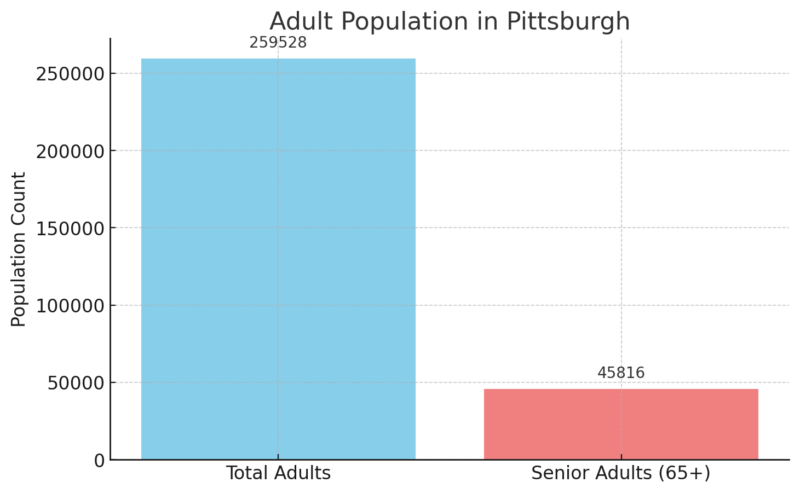
Out of 259,528 adults, about 45,816 are senior citizens (aged 65+). This shows that 17.6% of Pittsburgh’s adult population are seniors, highlighting the city’s growing need for services tailored to older residents, while still maintaining a youthful workforce.
Age Dependency Ratios
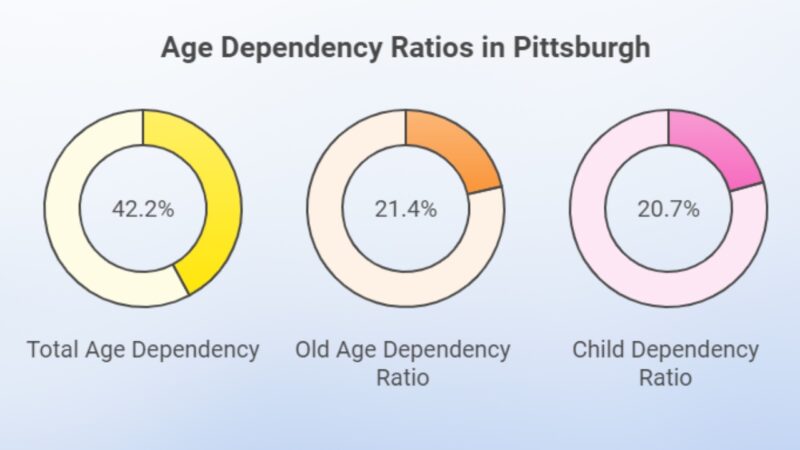
The Age Dependency Ratio of 42.2% in Pittsburgh indicates that for every 100 working-age adults, there are 42 dependents (children and elderly). The Old Age Dependency Ratio (21.4%) shows that older adults contribute a significant portion of the dependent population, while the Child Dependency Ratio (20.7%) reflects a slightly smaller, but still substantial, younger population.
Sex Ratio
Gender
Population
Percentage (%)
Female
154,870
50.97%
Male
148,973
49.03%
Pittsburgh’s sex ratio is quite balanced, with 50.97% females and 49.03% males. This small difference reflects a fairly even gender distribution within the city, consistent with many urban areas.
4. Migration and Population Change
View this post on Instagram
Pittsburgh has seen a consistent population decline in recent years, largely driven by domestic out-migration. Between 2020 and 2023, Allegheny County, the largest county in the Pittsburgh metro area, experienced a population drop of 25,711 people, equating to a 2.06% decrease.
This was primarily due to a negative net migration, where 24,748 domestic migrants left the county, and only 6,530 international migrants arrived, meaning that for every four people leaving, only one new international migrant moved in. Despite some inflow from international migration, it was insufficient to offset the domestic losses.
Other counties in the region also faced similar challenges, with Butler County being the only one to post significant population gains according to the Allegheny Institute for Public Policy.
The consequences of this decline extend to the local economy. A shrinking population means fewer workers are available for local jobs, and businesses may struggle to find employees. This could further discourage firms from investing in the area, exacerbating the cycle of population and economic decline as per PA Town Hall.
5. Economic Factors Influencing Population

As of 2024, the housing market in Pittsburgh has experienced notable trends. Realtor notes that The median listing home price is approximately $274,900, while the median sold price stands at $305,000, indicating a slight under-list price trend in the market.
The average price per square foot is $182. Despite the rise in housing prices by 4.9% year-over-year, Pittsburgh remains relatively affordable compared to national averages as per Norada Real Estate Investments.
In highly sought-after neighborhoods such as Squirrel Hill North and Regent Square, home prices can be significantly higher and properties sell more quickly, often due to proximity to urban amenities and top-rated schools.
However, the market is still characterized as favorable to buyers, with 61% of homes selling below the list price.
The average annual household income in Pittsburgh is $87,811 as per Point2Homes.
Employment
Pittsburgh’s unemployment rate is around 4%, with strong job growth in sectors like technology, healthcare, and education. The city’s economy is diversifying beyond its historic reliance on steel, now being recognized as a tech hub, particularly for companies like Amazon and IBM.
This has created a demand for real estate, especially around areas where these industries are concentrated.
However, rising mortgage rates (currently averaging above 7% for a 30-year fixed mortgage) have reduced the purchasing power of buyers, making homeownership less affordable. This has resulted in a reduction of monthly sales by 6.3% from last year.
Population and Poverty Rates

Despite some economic growth, Pittsburgh faces challenges related to population decline due to out-migration. From 2020 to 2023, Allegheny County lost over 25,711 residents, largely due to domestic outflows, as more people left than arrived as per PA Town Hall.
The poverty rate in Pittsburgh is around 11.8%, and efforts to attract new talent are focused on retaining graduates and professionals drawn to the growing tech and healthcare sectors
6. Educational Levels
Pittsburgh shows a well-educated population, with a significant portion having completed higher education. The breakdown of educational attainment for those aged 25 and over provides insight into the educational landscape of the city:
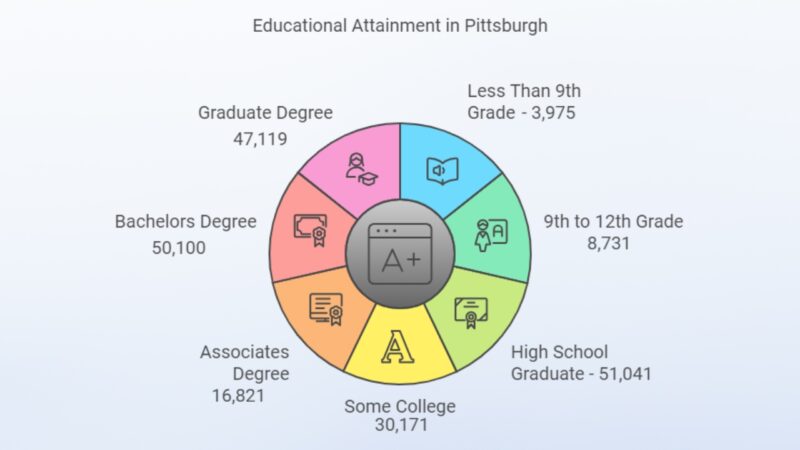
Pittsburgh’s education statistics reveal that 24.09% of the population holds a bachelor’s degree and 22.66% have obtained a graduate degree, underscoring the city’s educated workforce.
Comparatively, Philadelphia boasts a higher college degree attainment rate at 33.6%, highlighting regional differences in educational achievement.
Despite these high percentages, a small fraction (1.91%) have less than a 9th-grade education, showing a relatively low number of people without basic education according to World Population Review.
Educational Attainment by Race
Pittsburgh’s educational levels differ significantly across racial groups, as shown below:
Race/Ethnicity
High School Graduation Rate (%)
Bachelors Degree Holders (%)
White
133,113 (95.37%)
72,882 (52.2%)
Black or African American
39,868 (90.3%)
9,090 (20.6%)
Asian
9,417 (92.7%)
8,177 (80.5%)
Two or More Races
8,243 (95.2%)
4,564 (52.8%)
Hispanic
6,016 (86.9%)
3,509 (50.7%)
Native American
361 (96.0%)
90 (24.3%)
Native Hawaiian/Pacific Islander
21 (100%)
20 (95.24%)
Among Pittsburgh’s ethnic groups, Asian residents have the highest percentage of bachelor’s degree holders (80.5%). The Native Hawaiian or Pacific Islander population boasts both the highest high school graduation (100%) and bachelor’s degree attainment rates (95.24%), though the population is small.
White and Two or More Races populations also maintain a significant level of higher education achievement, while the Black population shows a much lower bachelor’s degree rate (20.6%).
Earnings by Educational Attainment
Income levels in Pittsburgh increase dramatically with higher education:
Education Level
Average Earnings (USD)
Male Earnings (USD)
Female Earnings (USD)
Less Than 9th Grade
$28,129
$28,842
$24,302
High School Graduate
$32,003
$36,296
$27,403
Some College
$38,899
$44,471
$34,356
Bachelors Degree
$56,268
$64,307
$48,750
Graduate Degree
$72,665
$82,697
$65,512
Overall Average
$48,262
$55,566
$42,463
Educational attainment correlates strongly with earnings. Individuals with a graduate degree earn on average $72,665, with males earning significantly more ($82,697) than females ($65,512).
Even at the bachelor’s degree level, a stark gender pay gap persists, with men earning an average of $64,307 compared to $48,750 for women. Lower education levels see similarly lower wages, with those not completing high school earning the least.
7. Public Policies Affecting Population Dynamics
Public policies are playing a crucial role in shaping the population dynamics in Pittsburgh in 2024. One of the major challenges the city faces is population decline due to out-migration and natural decrease (more deaths than births).
Allegheny County, the largest in the Pittsburgh metro area, saw a reduction of over 25,000 people from 2020 to 2023, with many domestic migrants leaving for other cities and only a small number of international migrants arriving.
- Economic Development and Job Creation: Pittsburgh is increasingly focused on bolstering its tech and healthcare sectors to attract talent. Public initiatives like Pittsburgh Works Together aim to encourage local business expansion and create job opportunities to reverse out-migration trends. These efforts are essential, as the city needs a more diversified economy to retain younger populations and new talent.
- Affordable Housing: The rising cost of living and housing shortages are driving residents out of the city, particularly in lower-income neighborhoods. Public policies are targeting the development of more affordable housing units, but issues like ineffective land banks and zoning barriers continue to slow progress. With more residents moving to surrounding areas due to high urban housing costs, the city is working to strike a balance between revitalization and preventing gentrification.
8. Future Population Projections
Pittsburgh’s population is expected to experience modest growth in the coming years. According to projections, the city’s population will rise from 301,286 in 2020 to approximately 307,422 by 2025 and 310,533 by 2030.
This growth represents a relatively slow increase, reflecting Pittsburgh’s ongoing challenges with domestic out-migration and economic shifts, despite efforts to attract new residents through expanding industries like technology and healthcare.
The broader Pittsburgh metro area, which includes surrounding counties, is also forecasted to grow but at a slower pace. The metro area population, which was around 2.42 million in 2023, is projected to increase modestly over the next decade.
These projections suggest that while Pittsburgh may not experience rapid expansion like some other U.S. cities, its population will likely remain stable or grow slightly as the region focuses on economic revitalization and urban development to attract new residents.
Methodology
Key population and demographic statistics were primarily drawn from the U.S. Census Bureau’s Population Estimates Program, which provided reliable year-by-year population data for Pittsburgh from 2000 to 2023. This program tracks changes in population size and demographic shifts, offering detailed insights into trends like migration, growth, and decline across different periods.
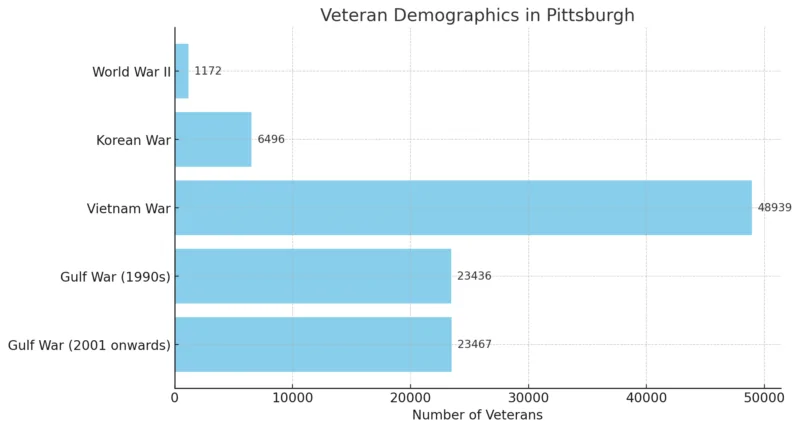
Further information on veteran demographics, educational attainment, and economic factors like employment rates and housing prices was obtained through local reports from the Allegheny Institute for Public Policy, World Population Review, and real estate market data from Realtor and Norada Real Estate Investments.
These sources helped in understanding how population dynamics intersect with key sectors such as housing, employment, and education. Public policy reports from regional think tanks and government institutions were also consulted to analyze the effects of local policies on population trends, with a focus on housing affordability and economic revitalization efforts.
References
- World Population Review – Pittsburgh Population 2024
- Homebuyersofpittsburgh.com – Pittsburgh Real Estate Market
- Norada – Pittsburgh Housing Market Trends and Forecast 2024-2025
- Realtor – Pittsburgh, PA
- Patownhall.com – Pittsburgh Region Population Decline Continues
- Alleghenyinstitute.org – Pittsburgh area continues to shed population
- Datausa.io – Pittsburgh, PA
- Census Reporter – Pittsburgh, PA Metro Area
- Neilsberg – Population By Year
- Aterio – Pennsylvania projected population growth from 2025 through 2030
- Statista – Poverty rate in Pennsylvania in the United States from 2000 to 2023
- Patownhall.com – Pittsburgh Region Population Decline Continues
- Ychart.com – Pittsburgh, PA Unemployment Rate (I: PPAURUM)


