
As of 2025, Rhode Island’s population has seen a modest yet notable shift.
In 2023, the population of Rhode Island was approximately 1.1 million, reflecting a slight year-over-year increase from 2022.
Rhode Island has a population of approximately 1,098,080 people as of 2025.
With an area of just 1,545 square miles, the state’s density is around 1,018.1 people per square mile according to World Population Review, making it the second most densely populated state in the U.S., after New Jersey.
According to Census.gov in the latest population census it had 1,097,379 people
The demographic composition of Rhode Island provides further context to its population data.
The state’s median age is 40.1 years, with a diverse age distribution: 15.55% of residents are under 15, while 45.74% are between 30 and 64 years old.
Additionally, the racial makeup reveals that 74.60% of the population is white, with 6.18% identifying as Black or African American, among other groups.
Key Takeaways
Age Distribution and Gender
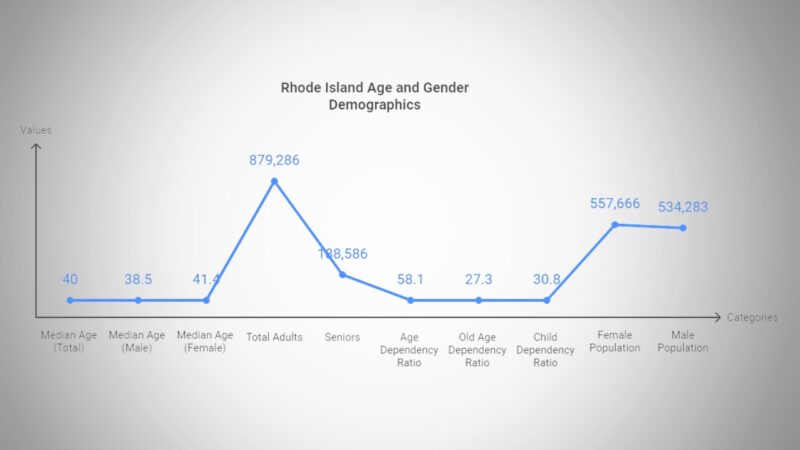
Rhode Island’s population data reveals a state with a relatively mature demographic profile. The median age is 40 years, reflecting a population that is aging but still balanced between young and older residents.
The slight difference between male and female median ages, with females having a higher median age (41.4) compared to males (38.5), may indicate a longer life expectancy for women, which is common in many regions, World Population Review stats says.
There are approximately 879,286 adults in Rhode Island, of which 188,586 are seniors (aged 65+), accounting for a significant portion of the adult population. This demographic split contributes to the state’s Age Dependency Ratio of 58.1, which indicates that for every 100 working-age individuals, there are 58 dependents (both children and seniors combined).
Notably, the Old Age Dependency Ratio stands at 27.3, while the Child Dependency Ratio is slightly higher at 30.8, suggesting a balance between older and younger dependents.
The gender distribution in Rhode Island shows a fairly equal balance, with females slightly outnumbering males, making up 51.07% of the population compared to 48.93% for males. This is in line with general demographic trends where women tend to live longer, slightly skewing the sex ratio.
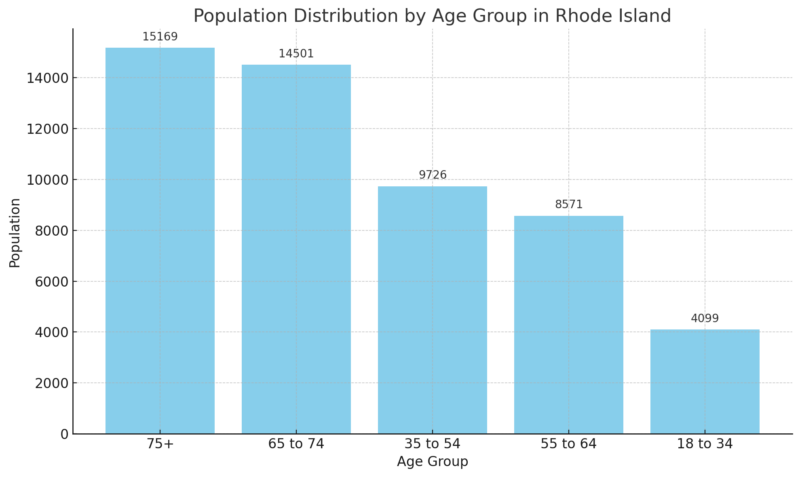
The age distribution in Rhode Island shows that the population is aging. A significant portion of the residents are over the age of 65, reflecting national trends of an aging population. The median age in the state is around 39 years.
Race and Ethnicity
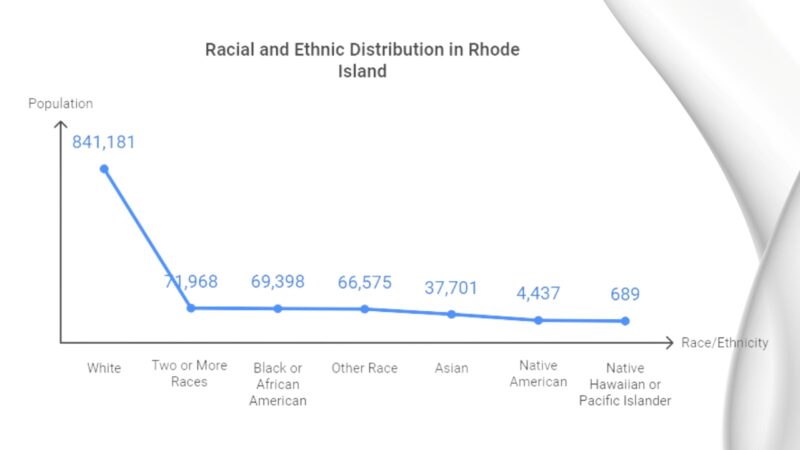
Rhode Island’s racial and ethnic composition is predominantly White, with 77.03% of the population identifying as such, reflecting the historical demographic makeup of the region. However, the state is also home to a growing diversity, with notable representation from other racial and ethnic groups according to the state government.
Individuals who identify with two or more races make up 6.59% of the population, highlighting an increasing trend of multiracial identification, which reflects the broader demographic shifts seen across the United States.
The Black or African American population constitutes 6.36% of Rhode Island’s population, showing a steady and significant presence in the state. The “Other Race” category closely follows at 6.1%, which may include individuals of varied ethnic backgrounds who do not fit neatly into the traditional census categories.
The Asian population, accounting for 3.45%, adds to the diversity, with significant representation in urban and suburban areas. Native Americans make up 0.41%, reflecting the state’s historical connection to indigenous peoples. Meanwhile, Native Hawaiians and Pacific Islanders represent a very small proportion of the population, at just 0.06%, which is typical in most U.S. states outside of the Pacific region.
Historical Growth Patterns

Since 2000, Rhode Island’s population growth has seen different phases. According to data, the state experienced a steady increase from 2000 to 2010, followed by slower growth in the following decade.
In 2023, the population was 1.1 million, reflecting a 0.19% increase from 2022.
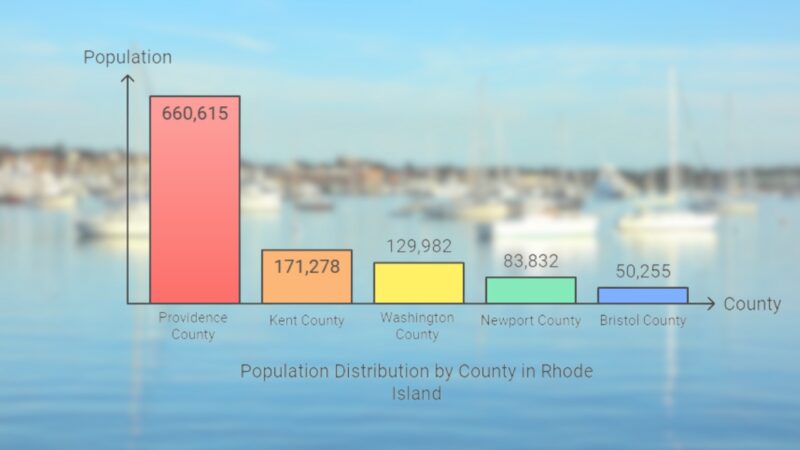
Population data shows that Providence County has been a major contributor to these gains, while areas like Newport County have seen declines. The state remains densely populated, largely driven by urban centers and economic opportunities.
Projected Population Changes
Projections indicate that Rhode Island’s population growth will continue at a modest pace. The state’s density is expected to remain high, with around 1,018.1 people per square mile, reflecting its position as the second most densely populated state in the U.S.
Future estimates suggest that urban areas, particularly around Providence, will continue to be growth hubs. However, some rural regions may face stagnation or minor declines due to demographic shifts and economic factors. The overall trend points toward a stable yet gradually increasing population, driven by both natural growth and migration.
Urban Versus Rural Areas
The state of Rhode Island is predominantly urban, with much of the population concentrated in and around the Providence area. This urban corridor extends to the northwest following the Blackstone River to Woonsocket.
This area is highly dense, contributing significantly to Rhode Island’s status as the second most densely populated state in the United States, with an average of 1,018.1 people per square mile.
In contrast, the rural areas of Rhode Island are less populated. These regions often consist of open spaces, small towns, and agricultural lands. Despite the smaller population, these areas are crucial for preserving the state’s natural and historical heritage.
Population by County
Employment and Unemployment Rates
Income Levels and Poverty Rates
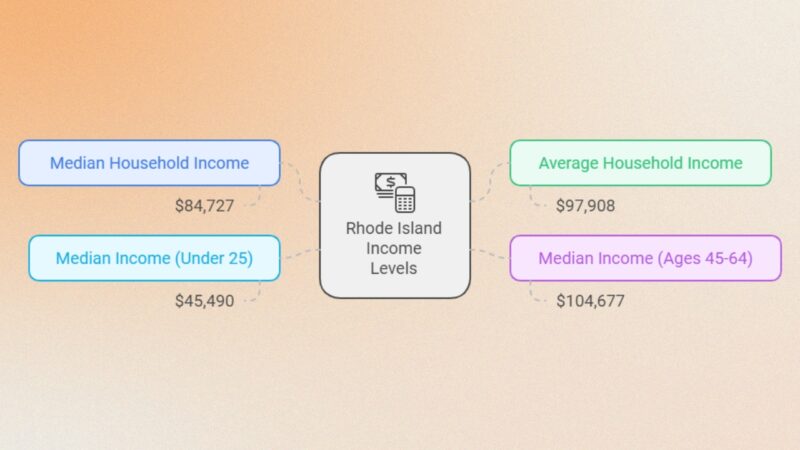
In 2024, Rhode Island’s income landscape highlights both opportunities and disparities. The median household income stands at $84,727, while the average household income is $97,908. These figures place Rhode Island slightly above the national median, reflecting its relatively high cost of living.
Income distribution varies significantly across age groups, with households led by individuals aged 45 to 64 reporting the highest median income at $104,677. In contrast, the younger demographic (under 25 years old) sees a much lower median income of $45,490 according to U.S Population.
Rhode Island faces significant challenges in terms of poverty, with several vulnerable groups particularly affected. The child poverty rate stands at 16.3%, which means that a significant portion of Rhode Island’s youth grows up in economically disadvantaged conditions.
This is compounded by the fact that 66,000 children in the state receive food stamps, and 123,104 children are enrolled in Medicaid, highlighting widespread reliance on federal assistance for basic needs like nutrition and healthcare.
Single-parent households face even more acute struggles, with 29% of single-parent families living below the poverty line. Similarly, the senior poverty rate is 9%, indicating that a notable segment of the elderly population is economically vulnerable.
Women also bear a disproportionate burden, as 13.1% of Rhode Island women live in poverty. Additionally, 19,501 women and children participate in the WIC (Women, Infants, and Children) program, which provides supplemental nutrition to those in need according to some data.
| Category | Statistic |
|---|---|
| Child Poverty Rate | 16.3% |
| Children Receiving Food Stamps | 66,000 children |
| Children Enrolled in Medicaid | 123,104 children |
| Single-Parent Families in Poverty | 29% of single-parent families |
| Senior Poverty Rate | 9% |
| Women in Poverty | 13.1% of Rhode Island women |
| WIC Participants (Women and Children) | 19,501 |
| Minimum Wage | $10.10 per hour |
| Households Receiving LIHEAP Assistance | 29,772 households |
| Uninsured Rate | 4.6% |
| Low-Wage Jobs | 20.3% of total jobs |
| Wage Disparity (Women to Men) | Women earn 83.6¢ for every $1 men earn |
| Food Insecurity Rate | 12.8% of households |
| Food Bank Assistance Choices | 70% choose between food and utilities |
Despite these challenges, the state’s minimum wage of $10.10 and its efforts to provide assistance through various programs like the Low Income Home Energy Assistance Program (benefiting 29,772 households) offer some relief, though not enough to eliminate poverty entirely.
Moreover, the state has a relatively high uninsured rate at 4.6%, indicating gaps in healthcare access, and 20.3% of jobs in the state are considered low-wage, which makes it difficult for many residents to escape poverty despite being employed.
The issue of economic inequality is further highlighted by wage disparities, particularly among women, who earn 83.6¢ for every dollar earned by men. This wage gap, coupled with the prevalence of low-wage jobs, underscores the need for policies aimed at improving economic equity and providing better support to those living in poverty in Rhode Island.
These factors, along with rising costs of living, contribute to persistent food insecurity and economic hardship, as reflected by 12.8% of households being food insecure, according to the Rhode Island Community Food Bank.
Many residents face tough decisions, with 70% of those assisted by the Food Bank having to choose between paying for food or utilities. Thus, poverty in Rhode Island is a multi-faceted issue affecting children, women, the elderly, and the working poor, calling for comprehensive solutions to improve economic well-being across the state.
Education Attainment Levels

Education attainment in Rhode Island is pivotal in determining the socioeconomic status of its residents. About 39% of adults in the state hold a bachelor’s degree or higher according to Rhodeislandcurrent.com. This reflects a commitment to higher education, influenced by institutions like Brown University and the University of Rhode Island.
High school graduation rates are also impressive, with approximately 87% of students graduating on time. Educational initiatives continue to target areas needing improvement, such as STEM education and vocational training programs. These efforts aim to equip the younger generation with skills relevant to the current job market.
In-Migration and Out-Migration Statistics
Rhode Island’s population grew to 1,098,082 in 2024. Net migration plays a crucial role in this growth. In-migration refers to people moving into Rhode Island from other states. Factors such as remote work and lower living costs attract newcomers.
Conversely, out-migration refers to residents leaving the state. Economic opportunities and personal preferences drive these decisions. The state saw a mixed trend with new residents balancing those leaving. Historical data shows net migration trends.
International Migration Impact
International migration has a distinct influence on Rhode Island’s demographics. New arrivals from various countries contribute to cultural diversity and labor force growth. The impact stretches from urban centers to rural areas, altering community dynamics.
Additionally, international students and professionals enhance the state’s educational and economic landscape. Migration policies and global conditions affect these patterns, creating a complex scenario for local authorities. The effects are evident in shifts in population density and service requirements. Further details can be found in the World Migration Report 2024.
Fertility and Mortality Rates
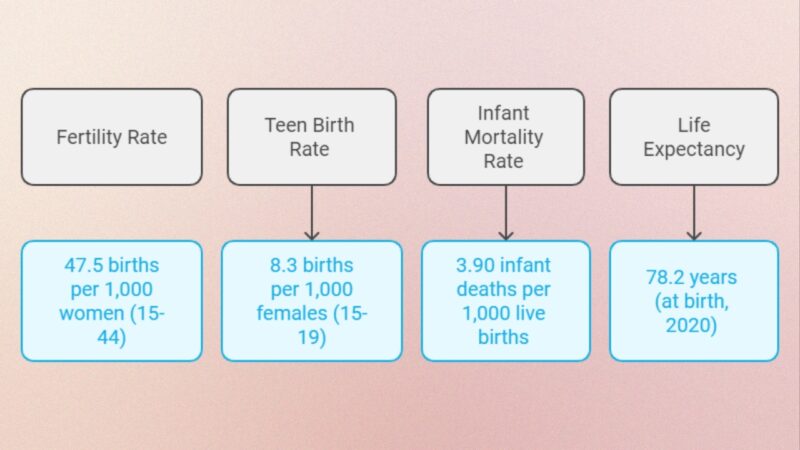
According to recent data from the Centers for Disease Control and Prevention, the fertility rate in Rhode Island is 47.5 births per 1,000 women aged 15-44.
For teenagers aged 15-19, the birth rate is 8.3 per 1,000 females.
Infant mortality rates in Rhode Island stand at 3.90 infant deaths per 1,000 live births. This metric is an important indicator of the overall health of infants in the state.
Life expectancy at birth in Rhode Island is 78.2 years as of 2020. This statistic provides an idea of how long residents can expect to live, assuming current mortality trends continue.
Housing and Real Estate Trends
Norada states that Rhode Island’s housing market in 2024 showcases notable fluctuations. As of February 29, the median sale price was $393,300, slightly below the median list price of $446,600. A prominent feature of the market is the negotiation dynamics, with 46.7% of sales occurring above list price, and 39.2% below list price, highlighting competitive bidding.
Comparatively, by June 30, the market exhibited a shift. The median sale price increased to $437,471, with the median list price at $499,933. Over half (59.6%) of the sales surpassed the list price, while 27.9% were under the list price, reflecting strong demand and aggressive bidding trends in certain areas.
Further emphasizing growth, by May 2024, the median home price reached $489,100, marking a 6.2% annual increase. This figure positions Rhode Island above the national average home price of $438,610, illustrating regional price disparities but maintaining competitiveness within the Northeast housing market.
Additionally, July 2024 data indicates an uptick in home sales and average prices. Home sales rose 22.8% year-over-year, totaling 1,164 in July versus 948 the previous year. The average sale price increased by 12.2%, reaching $619,696 from $552,364 in July 2023, indicating a robust and accelerating market trend.
Implications for Policy and Planning

The latest population projections for Rhode Island until 2040 indicate several important trends for policymakers and planners to consider. Understanding these trends can help in effective decision-making and resource allocation.
- Housing and Infrastructure Needs: Projections show varying growth rates across different counties. Policymakers should address housing options, especially in areas with projected population increases. More details can be found through the Rhode Island Division of Statewide Planning’s population projections.
- Economic Development: With population changes, particularly in urban areas, there is a need to adapt economic policies. Promoting job opportunities in growing populations while ensuring sustainable development in declining areas is critical.
- Healthcare and Education: Population shifts could strain healthcare and educational services in some areas while leaving others underutilized. Planning should involve forecasting needs and redistributing resources accordingly.
- Environmental Concerns: The increasing population in certain countries also leads to higher demands on natural resources. Planners should consider sustainable practices to balance economic growth with environmental preservation. Relevant data can be accessed at the Rhode Island Data Center.
- Transportation Infrastructure: Varied growth across regions necessitates tailored transportation policies. Enhancing public transport in high-growth areas while maintaining rural connectivity will be essential.
Careful planning and proactive policy formulation can help Rhode Island navigate these population changes effectively.
Methodology
- Data Collection: Sourced from credible reports like World Population Review and Rhode Island government databases.
- Synthesis: Combined data to provide a clear overview of population, economy, and housing trends.
- Categorization: Organized content into sections on demographics, economy, and policy implications.
- Verification: Cross-checked facts with multiple reliable sources.
- Simplification: Simplified complex data into clear, concise takeaways.
- Forecasting: Used current trends to project future population and policy needs.
References
-
- World Population Review – Rhode Island Population 2024
- HRSA – Overview of the State – Rhode Island
- Planning.ri.gov – Rhode Island Rising
- Neilsberg – Rhode Island Population By Year
- US Population – Rhode Island Population and Demographics
- Lasalle-academy – Our World 2023: Poverty in Rhode Island
- Rhodeislandcurrent.com – Education More Rhode Islanders are earning four-year college degrees
- Worldmigrationreport.iom.int – World Migration Report 2024
- CDC – Rhode Island
- Norada – Rhode Island Housing Market
- Planning.ri.gov – Population Projections