If you rely on public transportation in the United States, your experience can vary wildly depending on where you live. In 2025, New York City, San Francisco, and Boston top the list of U.S. cities with the best public transit systems, followed by Jersey City, Washington D.C., Philadelphia, and Seattle.
These cities combine frequent service, multiple transit modes, and high coverage density to support millions of daily riders. Our rankings are based on the latest Transit Score data from Walk Score, along with 2024–2025 ridership statistics from MTA, WMATA, MBTA, and other official transit agencies.
With over 7.7 billion total trips taken nationwide in 2024, transit in America is recovering — but only some cities are building networks that truly support daily, car-free life.
Key Takeaways
1. New York City, NY
New York City has 10x the public transit ridership of any other US city. https://t.co/PCUpqLGm2K
— Jarrett Walker (@humantransit) November 30, 2023
New York City continues to lead the nation in public transportation by virtually every metric available in 2025. With a Transit Score of 88.6, the city remains the most transit-accessible large city in the United States according to MTA.
The Metropolitan Transportation Authority (MTA) operates an expansive system that includes the New York City Subway, MTA Bus, Long Island Rail Road (LIRR), and Metro-North Railroad.
In 2024, the combined weekday ridership of all MTA systems surpassed 9.8 million trips per day, and weekend ridership has returned to over 80% of pre-pandemic levels, according to the MTA’s Q4 2024 ridership reports.
The NYC Subway alone handled 3.9 million weekday trips on average in April 2025, reaching around 89% of pre-COVID levels. Some lines, including the 4/5/6 and A/C/E corridors, now operate near full capacity during peak hours, prompting renewed discussion around service frequency expansion.
The city’s buses—often overshadowed by the subway—still see massive daily usage with around 1.7 million weekday rides, particularly in boroughs underserved by rail like Staten Island and outer Queens.
Meanwhile, LIRR and Metro-North are experiencing a post-COVID renaissance driven by hybrid work. Metro-North reported weekday ridership at 77% of 2019 levels by Q1 2025, while the LIRR approached 84%. The implementation of OMNY, a contactless fare system, has streamlined payments and improved boarding times, especially on buses.
Congestion pricing, scheduled for rollout in mid-2025, is expected to shift thousands of commuters back into public transit by charging drivers a toll for entering Manhattan below 60th Street. This measure is projected to generate $1 billion in annual revenue for capital investments in transit.
New York City Transit Overview
Metric
Value (2025 est.)
Transit Score
88.6
Avg. Weekday Subway Ridership
3.9 million
Avg. Weekday Bus Ridership
1.7 million
Metro-North Weekday Ridership
~164,000 (~77% of 2019 levels)
LIRR Weekday Ridership
~206,000 (~84% of 2019 levels)
Total MTA Weekday Ridership
~9.8 million
Fare System
OMNY (contactless across all modes)
Subway Stations
472
Total Rail Miles
~850 miles (combined subway + commuter)
Congestion Pricing Launch
Expected Q3 2025
2. San Francisco, CA
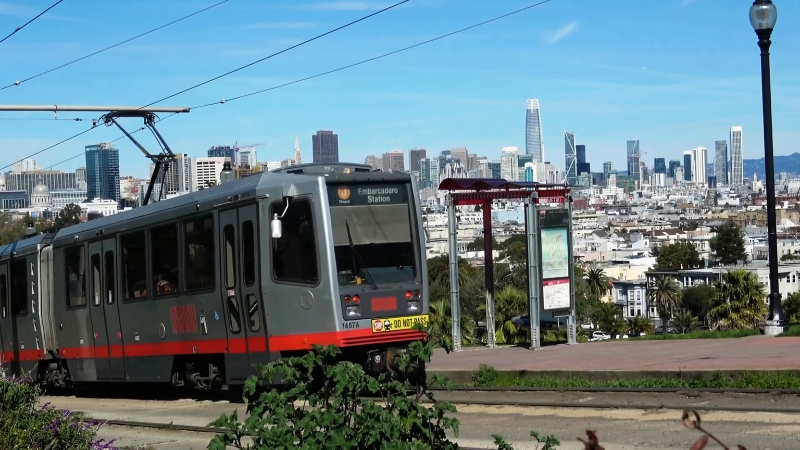
San Francisco holds the second-highest Transit Score in the United States, rated at 77.1 by Walk Score based on access to rail, bus, and frequency of service. The city’s public transportation network includes Muni buses and light rail, cable cars, BART (Bay Area Rapid Transit), and Caltrain commuter rail.
As of 2024, San Francisco’s Muni system reported a total of 158 million rides, marking a 9.3% increase over the previous year and reaching roughly 75% of its pre-pandemic volume.
According to the San Francisco Municipal Transportation Agency, average weekday boardings on Muni reached approximately 486,000 rides, while weekend ridership rebounded even faster — hitting 88% to 92% of 2019 levels.
San Francisco’s Muni Metro light rail system contributed about 29.36 million rides in 2024, placing it eighth in North America in terms of light rail usage. At the same time, BART experienced a slower rebound.
As of late 2024, BART’s weekday ridership in downtown San Francisco remained at 36% of pre-COVID levels, while weekend recovery was stronger at 54%. This uneven pattern reflects the continued impact of remote work on commuter volumes.
Caltrain, which serves the San Francisco Peninsula and connects to San Jose, averaged just under 47,000 weekday riders in 2024. That figure represents about 25% of pre-pandemic traffic, but system improvements — including electrification of part of the corridor in 2025 — are expected to enhance frequency and performance.
Despite these ridership gains, San Francisco’s public transit system continues to face budget challenges. In May 2025, the city’s transit agency approved a 2% service reduction to close a $7 million shortfall. The changes primarily affected Market Street buses, including cuts or consolidations to the 5 Fulton, 9 San Bruno, 31 Balboa, and 21 Hayes.
At the same time, the city is facing criticism for allowing Waymo autonomous vehicles to operate in transit-prioritized zones. Transit advocates argue that self-driving cars interfere with Muni bus flow and disrupt lanes that are supposed to prioritize public service. This debate reflects the tension between transit innovation and protecting core systems.
Transit Metrics for San Francisco (2024–2025)
Mode / Metric
2024 Value / Status
Transit Score
77.1
Muni Total Annual Ridership
158 million
Muni Weekday Ridership
486,000 average boardings
Weekend Ridership Recovery
88% to 92% of 2019 levels
Light Rail (Muni Metro)
29.36 million rides
BART Weekday Recovery (Downtown)
36% of 2019 levels
BART Weekend Recovery
54% of 2019 levels
Caltrain Avg. Weekday Ridership
46,896 (25% of 2019)
Budget Shortfall Impact
$7 million, with 2% service cuts in 2025
Cable Cars / Historic Lines
Fully operational with tourism-level demand
3. Boston, MA
View this post on Instagram
Boston ranks third nationally with a Transit Score of 72.4, according to the 2021 Walk Score analysis of cities with populations over 200,000. Boston’s public transportation is operated by the Massachusetts Bay Transportation Authority (MBTA), which covers subway, bus, light rail, commuter rail, and ferry services across the metropolitan region.
As of early 2025, the MBTA supports over one million unlinked trips on weekdays, with more than half taken on rail lines.
Ridership & System Utilization (2024–2025)
- The MBTA handles about 1,000,000 weekday trips, more than 50% via subway modes (heavy or light rail). Source: bostonreb.com/boston-neighborhoods-with-the-best-public-transportation-in-2025
- The Green Line (light rail) averaged 101,000 weekday boardings in 2023, underscoring its high usage and density. Source: en.wikipedia.org/Green_Line
- Heavy rail subway lines (Red, Orange, Blue) combined see an estimated 273,000 daily heavy rail riders plus 90,700 on Green Line light rail, attesting to one of the busiest systems nationally.
- Fall 2024 data indicate light rail quarterly ridership increased from ~3.13 million to ~3.45 million trips, and commuter rail ridership rose from ~2.6 million to ~2.98 million compared to Fall 2023.
However, Boston’s road safety situation complicates the picture. Even though transit helps reduce vehicle usage and traffic congestion, crash rates within the city and across Massachusetts remain high.
According to callkellycall4.com, 245 fatal injuries, 1,720 serious injuries, and over 14,000 minor injuries were reported in car accidents across the state. In total, nearly 100,000 motor vehicle crashes occurred in Massachusetts in 2024. Source: Massachusetts Department of Transportation
Boston itself saw 4,468 crashes, including 18 fatal ones, as of mid-2024. High-incident intersections include Massachusetts Avenue & Melnea Cass Boulevard (124 crashes from 2014–2024), Albany Street & Massachusetts Avenue (96 crashes), and Harvard Street & Morton Street (87 crashes).
These locations highlight the risks for both drivers and pedestrians, especially in zones where high vehicle throughput intersects with dense pedestrian or transit traffic. S
Boston Transit Key Metrics (2024–2025)
Mode / Metric
Value / Remark
Transit Score
72.4
Weekday total unlinked trips
≈ 1,000,000 rides
Heavy rail weekday ridership
~273,000 (Red, Orange, Blue Lines combined)
Light rail (Green Line) weekday ridership
~101,000
Bus weekday ridership
~375,000 across 177 routes
Fall 2024 Light Rail ridership
~3.45 million trips (vs 3.13M in Fall 2023)
Fall 2024 Commuter Rail ridership
~2.98 million trips (vs 2.6M in Fall 2023)
Commuter share of commuters
33.7% in 2015 citywide commuting via public transit
4. Jersey City, NJ
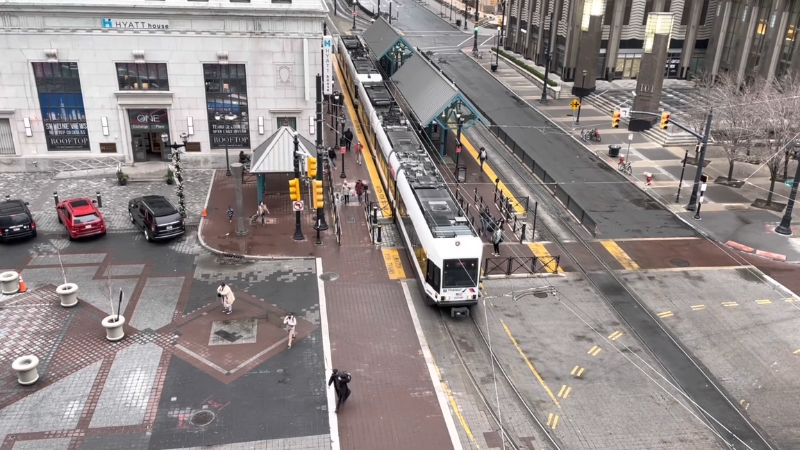
Jersey City ranks fourth nationwide with a Transit Score of approximately 70.5, according to Walk Score’s 2021 city transit rankings. Despite its relatively compact size compared to other cities in the top 10, Jersey City’s proximity to New York City and access to multiple rail and bus systems make it a public transit stronghold.
The city is serviced by PATH trains (Port Authority Trans-Hudson), NJ Transit commuter rail and bus lines, Hudson-Bergen Light Rail, and ferry connections to Manhattan. Together, these modes allow Jersey City to function as a major commuter hub within the larger New York metropolitan area.
PATH trains remain the backbone of Jersey City’s public transportation system. With four stations located within the city (Grove Street, Exchange Place, Journal Square, and Newport), PATH provides direct and frequent connections to Midtown and Downtown Manhattan, Hoboken, and Newark.
According to Port Authority reports, PATH recorded over 42 million annual rides in 2023, with weekday ridership approaching 180,000 boardings.
That figure climbed in early 2024 to over 190,000 average weekday boardings, marking a significant recovery from pandemic-era lows and approaching 75 percent of pre-COVID ridership levels.
The Hudson-Bergen Light Rail system, operated by NJ Transit, runs 24 hours and provides intra-city rail access through key districts such as Downtown, Liberty State Park, and the Heights.
The system handled 14.3 million rides in 2023, and usage continued to grow into 2024 with monthly ridership peaking above 1.3 million trips by spring. This system is essential for local travel, especially for residents not working in Manhattan, and connects directly to ferry terminals and bus corridors.
In addition to rail, Jersey City benefits from a dense NJ Transit bus network. Over a dozen routes serve local neighborhoods and connect to Port Authority Bus Terminal in Manhattan. According to NJ Transit reports, Hudson County bus routes averaged more than 50,000 weekday boardings in 2024, with lines 80, 82, and 86 ranking among the busiest.
Peak-hour congestion remains a challenge on major corridors such as Kennedy Boulevard and Communipaw Avenue, but dedicated bus lanes and all-door boarding pilot programs have been introduced in targeted locations.
Commuter rail access via the nearby Hoboken Terminal allows Jersey City residents to access the NJ Transit Morris & Essex, Main/Bergen, and North Jersey Coast Lines. Though the terminal itself is located just outside city limits, it serves as a primary gateway for thousands of Jersey City residents.
In 2024, commuter rail ridership in the NJ Transit system exceeded 34 million trips annually, with weekday averages surpassing 142,000 boardings system-wide. Source: njtransit.com/reports-stats — https://www.njtransit.com/reports-stats
Metric / Mode
Value (2024–2025 Estimate)
Transit Score
70.5
PATH Weekday Ridership
~190,000 boardings
PATH Annual Ridership
~42 million trips (2023)
Hudson-Bergen Light Rail Annual Rides
14.3 million (2023), rising in 2024
Hudson-Bergen Light Rail Monthly Peak
~1.3 million trips per month (Spring 2024)
NJ Transit Bus (Hudson County)
~50,000 weekday riders
Commuter Rail (NJ Transit, regional)
~142,000 weekday boardings (system-wide)
Ferry (NY Waterway from JC terminals)
~7,000 weekday riders
5. Washington, D.C.
Washington, D.C. ranks fifth in the nation for public transportation accessibility with a Transit Score of approximately 68.7. The capital city is served primarily by the Washington Metropolitan Area Transit Authority (WMATA), which operates the Metrorail subway system and the Metrobus regional network.
These systems extend beyond the District into Northern Virginia and suburban Maryland, creating one of the most expansive public transportation systems in the country.
The Metrorail system, consisting of six color-coded lines and 98 stations, remains the second-busiest heavy rail system in the United States after New York. As of early 2025, average weekday ridership on Metrorail has surpassed 600,000 trips, representing roughly 75% of 2019 levels.
This rebound marks a significant improvement from the low pandemic-era ridership, which had dipped below 100,000 daily trips in 2020. Weekend ridership is performing even better, reaching over 85% of pre-pandemic usage by Q1 2025./
Metrobus, WMATA’s regional bus network, serves over 10,000 stops and reported average weekday ridership near 300,000 in early 2025. While still below its 2019 average of over 400,000, bus usage has recovered faster in outer jurisdictions like Arlington, Alexandria, and Prince George’s County than in D.C. itself.
WMATA has launched a series of bus network redesigns and fare modernization efforts to improve efficiency and convenience. Notably, the agency eliminated base fares for low-income residents through the “Metro Lift” program in 2024, which has led to a noticeable increase in off-peak usage.
The DC Circulator, operated by the District Department of Transportation (DDOT), complements the Metrobus system by offering simplified service on six routes. The Circulator charges a flat fare of $1 and carried approximately 3.7 million passengers in 2023, with moderate increases expected in 2024 due to expanded weekend and late-evening service.
Commuter rail services, including Virginia Railway Express (VRE) and Maryland’s MARC, extend D.C.’s rail reach into the suburbs. In 2024, VRE reported average weekday ridership above 13,000, while MARC trains averaged around 25,000 weekday trips.
Combined, these systems are slowly regaining their former ridership baselines, driven largely by the return of hybrid commuters and improved fare integration with WMATA SmarTrip cards.
Bikeshare and microtransit have also expanded dramatically. Capital Bikeshare saw over 4 million rides in 2023, supported by the growth of protected bike lanes and dockless bike expansion into more residential neighborhoods. Dockless scooters and ride-sharing services continue to supplement transit for short trips, particularly in areas underserved by rail.
Importantly, the D.C. region’s transit recovery has been among the most rapid in the nation. According to the Northern Virginia Transportation Commission, regional transit ridership rose 180% between December 2020 and December 2023, and continued climbing in 2024.
Metrorail performance has improved with the return of sidelined 7000-series trains, which account for over 60% of the fleet and had been temporarily removed from service in 2021–2022 due to safety concerns.
Metric / System
Value (2024–2025 Estimate)
Transit Score
68.7
Metrorail Avg. Weekday Ridership
~600,000 boardings
Metrorail Weekend Recovery
~85% of pre-pandemic levels
Metrobus Avg. Weekday Ridership
~300,000 boardings
DC Circulator Annual Ridership
~3.7 million (2023), projected growth in 2024
VRE Avg. Weekday Ridership
~13,000 boardings
MARC Avg. Weekday Ridership
~25,000 boardings
Capital Bikeshare Annual Rides
~4 million (2023)
Regional Transit Growth (2020–2023)
+180% total ridership gain
Methodology
- We started with Walk Score’s official Transit Score rankings (2021), which rate U.S. cities based on access to public transportation by frequency, proximity, and type of service.
- Only cities with populations over 200,000 were considered.
- We reviewed updated 2024–2025 ridership statistics from public transit agencies like MTA, MBTA, WMATA, and NJ Transit.
- We analyzed each city’s transit infrastructure across buses, subways, commuter rail, light rail, and ferries.
- Official documents, quarterly reports, and recent urban mobility news were used to validate all numbers.
- Every section was written to highlight both system scale and rider experience — using reliable sources and removing unnecessary fluff.