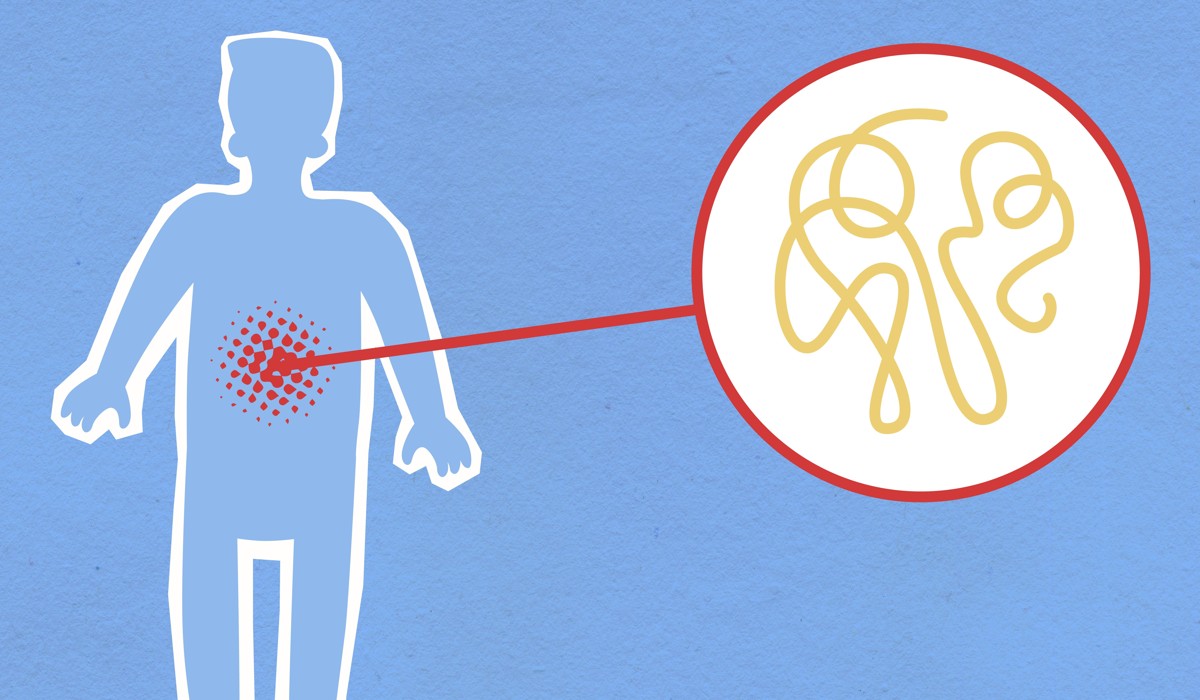

People in the US are known for being overweight. Unfortunately, the whole world see us that way. Therefore, it’s not unusual that a question “How much does the average American weigh?” is so common. And the answer actually proves the point, as it is 199.8 pounds for adult men and 170.8 pounds for adult women.
Among men ages 30 to 39, the average rises to 208.1 pounds, and it remains above 200 pounds through the 60s.
Those figures come from measured heights and weights collected through the National Health and Nutrition Examination Survey. Unlike telephone polls or questionnaires, NHANES brings participants into mobile examination centers, where trained staff record their measurements using standardized equipment.
One detail needs to be made clear. The 208.1-pound figure is not based on people weighed in 2026. It comes from federal measurements collected between 2015 and 2018 and published in a CDC report on the body measurements of Americans. It remains the latest complete federal table that breaks average male weight into ten-year age groups.
Newer federal data do not provide the same age-by-age average weight table, but they show that excess weight remains widespread. During August 2021 through August 2023, 72.4% of U.S. adults had a body mass index in the overweight or obesity range. In other words, fewer than three in ten adults were within the BMI category commonly described as healthy weight.
Average Weight of American Men by Age
Men reach their highest average weight during their 30s. The mean falls slightly in the 40s and 50s, but it remains above 200 pounds until age 70. A sharper decline appears among the oldest adults, partly because aging often brings changes in muscle mass, appetite, illness and overall body composition.
| Age group | Average weight in pounds | Average weight in kilograms |
|---|---|---|
| 20 to 29 | 188.6 | 85.5 |
| 30 to 39 | 208.1 | 94.4 |
| 40 to 49 | 206.9 | 93.9 |
| 50 to 59 | 202.5 | 91.9 |
| 60 to 69 | 201.2 | 91.3 |
| 70 to 79 | 193.4 | 87.7 |
| 80 and older | 177.5 | 80.5 |
The table describes the measured population during the survey period. A muscular man, a sedentary man and a man carrying a large amount of abdominal fat can have the same body weight and very different health profiles.
Height is also important. Men ages 30 to 39 averaged 5 feet 9 inches. A weight of 208.1 pounds at that height produces a BMI slightly above 30, although calculating BMI from group averages is not the same as averaging every participant’s individual BMI.
Men Gained More Than 30 Pounds but Less Than One Inch
Adult men averaged 166.3 pounds in 1960 through 1962. By 2015 through 2018, the average had reached 199.8 pounds, an increase of 33.5 pounds.
Average height rose from 68.3 inches to 69 inches across the same period. Americans became slightly taller, but the increase in height was far too small to account for the increase in weight.
Women followed a similar pattern. The average weight of adult women rose from 140.2 pounds in the early 1960s to 170.8 pounds in 2015 through 2018. Average female height increased by less than an inch.
The change did not happen in one decade or because of one food, job or technology. Weight increased across generations as daily routines, food supply, working conditions and transportation changed together. A desk job burns less energy than physical labor. A car-dependent neighborhood makes an ordinary walk less practical. Large portions and highly processed food also became easier to buy throughout the day.
Nearly Three in Four Adults Now Carry Excess Weight
The newest federal update gives a current picture of how common excess weight has become, even though it does not replace the older age-specific weight table. An NCHS report released in February 2026 found that 72.4% of adults had overweight or obesity during August 2021 through August 2023.
Obesity alone affected 40.3% of adults. Another 32.1% were in the overweight range. Severe obesity affected 9.4% of adults before age adjustment.
Nearly three quarters of U.S. adults are overweight or obese, a new study showed, with more people meeting the criteria at younger ages. https://t.co/m9vuyE5LKP
— The New York Times (@nytimes) November 15, 2024
Middle age remains the period with the highest obesity prevalence. The latest measured federal estimates put the obesity rate at 46.4% among adults ages 40 to 59. The rate was 35.5% among adults ages 20 to 39 and 38.9% among adults 60 and older.
Men and women had similar overall obesity rates, at 39.2% and 41.3%. Severe obesity showed a larger difference. It affected 6.7% of men and 12.1% of women in the unadjusted results.
BMI Describes a Population Better Than It Describes a Person
Most national obesity statistics rely on body mass index because it can be calculated from height and weight across thousands of participants. For population research, it provides a consistent way to compare decades, age groups and regions.
BMI does not directly measure body fat. It cannot distinguish muscle from fat, nor can it show where fat is stored. A heavily muscled athlete may fall into the overweight range despite having relatively little body fat. Two people with the same BMI can also have different amounts of abdominal fat and different metabolic risks.
Criticism of the way Americans define and measure healthy weight has existed for years, including questions about the limitations of relying on BMI alone. Federal health researchers make the same basic point. BMI is a useful screening measure, but it is not a complete medical assessment.
Some researchers have proposed definitions that combine BMI with waist measurements, body-fat estimates or evidence of health problems. Such changes could place more people in an obesity category, as recent reporting on a broader clinical definition of obesity has explained.
For an individual, blood pressure, glucose, cholesterol, waist circumference, fitness, medications and family history provide context that body weight cannot supply on its own.
Food Became Easier to Buy and Daily Movement Became Easier to Avoid
Federal weight tables record what happened, not why it happened. The causes cannot be reduced to a single national explanation or a simple failure of willpower.
Food data offer part of the context. During August 2021 through August 2023, American adults received 53% of their calories from ultra-processed food, according to a national analysis of eating patterns. Sandwiches and burgers were the largest source, followed by sweet baked goods, sweetened drinks, savory snacks, breads, rolls and tortillas.
Consumption of ultra-processed food has declined slightly from its recent peak, but it still accounts for more than half of adult calorie intake. Such products are often convenient, heavily marketed and designed to be easy to eat. Many are also high in calories, sodium, added sugar or unhealthy fats and low in fiber.
Movement data show another part of the picture. Only 47.2% of adults met the federal aerobic activity guideline in 2024. Men did better than women, but neither group came close to universal participation. The 2026 federal report on physical activity also found large differences by income, education, disability and place of residence.
A person can make responsible choices and still live in an area without sidewalks, work unpredictable hours or struggle to afford fresh food. Another person may have access to safe parks, flexible work and regular medical care. Treating both situations as a test of discipline ignores the conditions in which daily decisions are made.
The Health Effects Usually Build Over Years
Higher body weight does not mean that every person will develop chronic disease. Risk rises across a population, and the damage often appears gradually through high blood pressure, insulin resistance, abnormal cholesterol, joint problems or sleep apnea.
Obesity is associated with coronary heart disease, stroke, type 2 diabetes and several cancers. The connection is especially important because heart disease remains the leading cause of death in the United States.
An analysis from the USC Schaeffer Center has described obesity as second only to smoking among preventable causes of death. The exact number of deaths attributed to weight depends on the research method, but there is broad agreement that the medical burden is substantial.
Widespread excess weight can also change what people recognize as unusual. A 208-pound man may look ordinary because plenty of men around him are a similar size. Statistical normality and medical risk are not the same thing.
The United States Is Not Alone, but It Remains Near the High End
Obesity is no longer concentrated in wealthy Western countries. The World Health Organization reports that 2.5 billion adults had overweight in 2022, including 890 million living with obesity. Worldwide, 43% of adults had overweight and 16% had obesity.
The U.S. rate is much higher. Measured federal data put the combined prevalence of overweight and obesity at 72.4%, compared with the worldwide figure of 43%. Different countries use different surveys and age structures, so the figures are not perfectly interchangeable, but the gap is too large to dismiss as a technical difference.
Genes influence appetite, body composition and the tendency to gain weight, but genetics did not change enough in a few decades to explain the national increase. The stronger explanation involves the interaction between biology and an environment offering more calories, less routine movement and more reasons to remain seated.
Changing the National Average Requires More Than Diet Advice
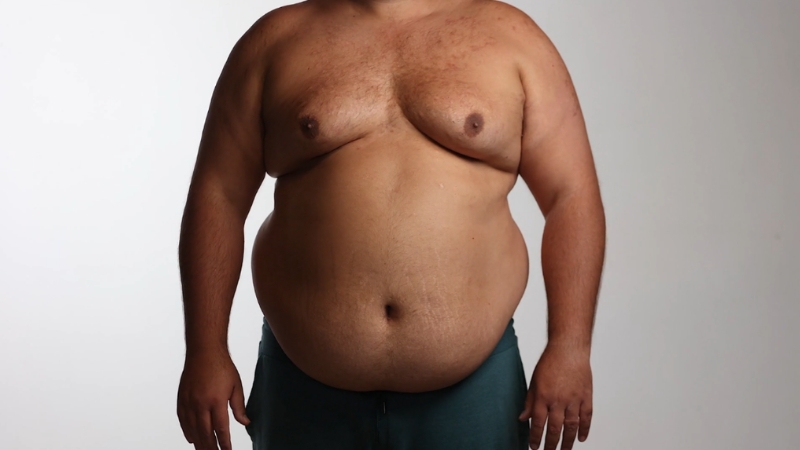
Doctors can help patients improve blood pressure, glucose, fitness and weight through nutrition, activity, behavioral treatment, medication or surgery. Interest in medical treatment has grown quickly.
We found that millions of American women are now using GLP-1 medications for diabetes, weight management or related conditions.
Medication can help an individual, but it will not redesign a neighborhood or change the food sold in schools and workplaces. Population-level improvement also depends on safe walking routes, practical public transportation, access to affordable food and schedules that leave people enough time to prepare meals and exercise.
A global study highlighted by UCLA found major differences in walking and cycling between cities, adding evidence that street design affects everyday physical activity. People move more when useful destinations can be reached safely without a car.
Personal changes still matter. A better diet does not require a perfect menu, and physical activity does not have to begin with an expensive gym membership. More vegetables, fewer sugary drinks, regular walks and consistent sleep are modest changes that can be repeated.
We also found that small improvements in movement, sleep and vegetable intake were associated with lower cardiovascular risk.
Newer data confirm the larger finding behind it. Excess weight is now present in nearly three out of every four American adults, and the national numbers will not change through individual effort alone.