
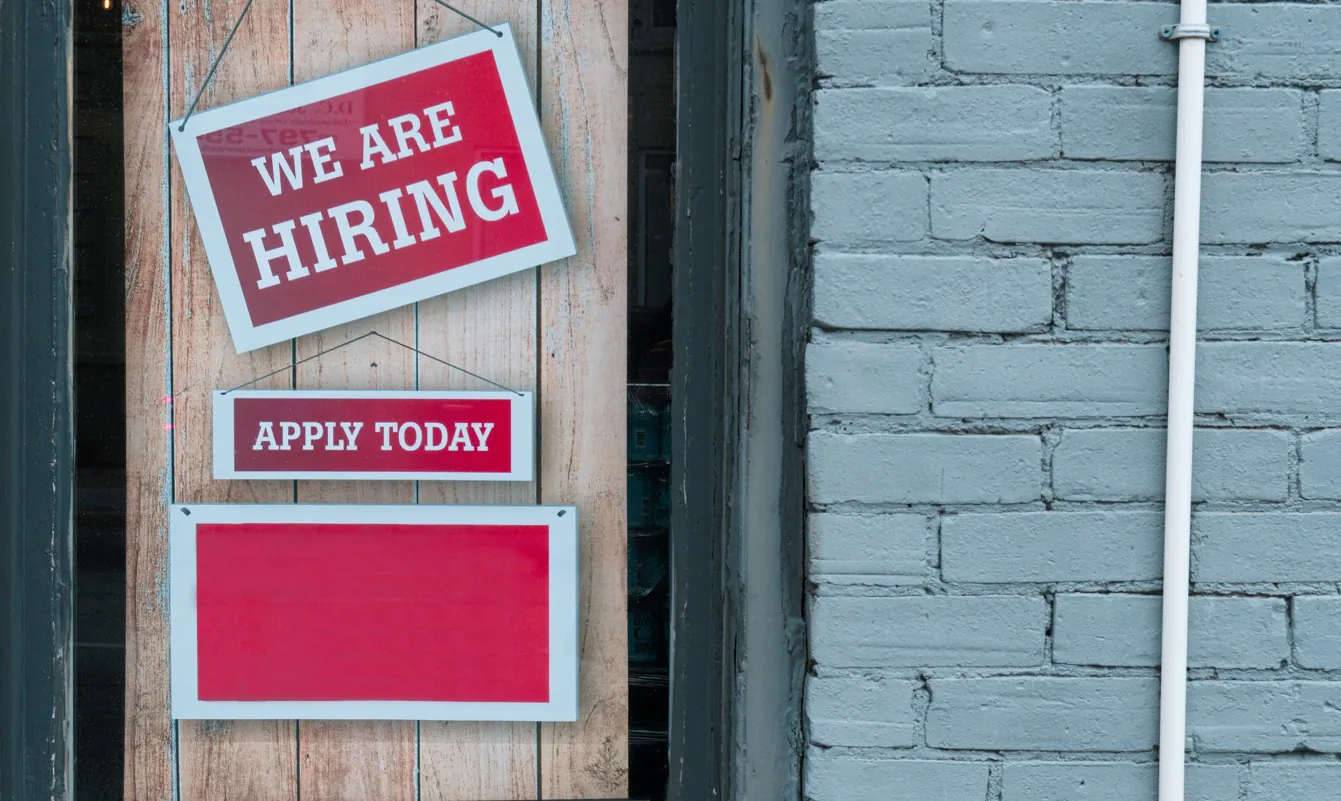
The July 2026 jobs report gives us the latest look at where the US labor market is heading, and this time the headline number moved into negative territory.
We have been following these reports month by month because one release rarely tells the whole story. In our May 2026 jobs report, the first estimate showed 172,000 new jobs. When we examined the June 2026 jobs report, hiring had already slowed sharply.
Now July adds another piece to that picture. The Bureau of Labor Statistics reported Friday that nonfarm payroll employment fell by 23,000 jobs in July, while the unemployment rate stood at 4.1%.
Table of Contents
ToggleUS Payrolls Fell by 23,000 in July
Total nonfarm payroll employment declined by 23,000 in July, according to BLS.
The largest losses came from local government education, retail trade and financial activities. Health care moved in the opposite direction and continued adding workers.
| Industry | July Change |
|---|---|
| Local government education | -50,000 |
| Retail trade | -19,000 |
| Financial activities | -14,000 |
| Health care | +22,000 |
Local government education recorded the largest decline, losing 50,000 jobs during the month.
Retail trade lost 19,000 jobs. Warehouse clubs, supercenters and other general merchandise retailers lost 21,000 positions, while gasoline stations and fuel dealers lost another 5,000. Sporting goods, hobby, musical instrument, book and miscellaneous retailers added 10,000 jobs.
Financial activities lost 14,000 jobs in July. Employment in that sector is now down by 121,000 from its recent peak in May 2025.
Health Care Added 22,000 Jobs
Health care remained one of the few large sectors still adding workers.
The industry gained 22,000 jobs in July, including 18,000 positions in ambulatory health care services.
The pace has slowed compared with the previous year. Health care had averaged 36,000 new jobs per month during the prior 12 months.
That difference is important because health care has been one of the main sources of employment growth while other sectors have moved sideways or started cutting positions.
Unemployment Stood at 4.1%
The unemployment rate was 4.1% in July, while the number of unemployed people stood at about 6.9 million.
BLS said both figures changed little during the month and were also little changed from a year earlier.
Among major demographic groups, unemployment fell to 12.1% for teenagers and 4.6% for Hispanic workers. Rates for adult men, adult women, White workers, Black workers and Asian workers showed little movement.
The labor force participation rate stood at 61.4%, while the employment-to-population ratio was 58.9%.
Since January, participation has fallen by 0.7 percentage point and the employment-to-population ratio has declined by 0.5 percentage point.
Temporary Layoffs Rose by 153,000
One of the more notable figures in the report came from temporary layoffs.
The number of people on temporary layoff increased by 153,000 to 921,000 in July.
The number of permanent job losers remained around 1.7 million.
Long-term unemployment edged down to 1.8 million. These are people who have been unemployed for at least 27 weeks, and they accounted for 25.5% of all unemployed people in July.
Another 4.8 million people were working part time for economic reasons. These workers wanted full-time employment but had reduced hours or could not find full-time positions.
Nearly 6 Million People Outside the Labor Force Still Wanted a Job
BLS also reported that 5.9 million people outside the labor force wanted a job in July.
They were not counted as unemployed because they had not actively looked for work during the previous four weeks or were unavailable to start a job.
Within that group, 1.8 million people were classified as marginally attached to the labor force. They wanted work and had looked for a job during the previous year, though they had not searched during the most recent four-week period.
The number of discouraged workers stood at 476,000. These are people who had stopped looking because they believed no jobs were available for them.
Average Hourly Earnings Reached $37.62
Average hourly earnings for private nonfarm workers stood at $37.62 in July.
That was only two cents higher than the previous month.
Over the past year, average hourly earnings increased by 3.2%.
Production and nonsupervisory employees earned an average of $32.40 per hour, an increase of four cents during the month.
The average private-sector workweek remained unchanged at 34.3 hours.
Manufacturing employees also worked an average of 40.4 hours, while manufacturing overtime edged down to 3.1 hours.
The July Report Also Came With Large Revisions
The July release included significant revisions to earlier payroll estimates.
BLS revised May employment growth down from 129,000 to 63,000 and June from 57,000 to 20,000.
Together, those revisions removed 103,000 jobs from the previous estimates for May and June.
Revisions are a normal part of the monthly payroll process because BLS receives additional reports from businesses and government agencies after the first estimate is published.
Still, a revision of that size changes how the current labor market looks. July already brought a payroll decline, and the updated figures show that hiring before July was weaker than the earlier releases indicated.
What the July 2026 Jobs Report Shows?
The July report gives us a labor market with several different signals at the same time.
Payroll employment fell by 23,000, temporary layoffs increased and participation remains below its January level. Retail, local government education and financial activities all lost jobs.
At the same time, unemployment remains at 4.1%, health care continues adding workers and permanent job losses showed little movement.
The clearest change is on the hiring side. Employers added fewer workers earlier in the summer than originally reported, and July finished with an outright decline in payroll employment.
That does not mean every part of the labor market is weakening at the same pace. Health care is still expanding, unemployment remains relatively low and there has been no broad surge in permanent layoffs.
For people looking for work, however, slower hiring can show up before unemployment rises sharply. Fewer openings, slower recruitment and longer searches can all appear while the headline unemployment rate remains fairly stable.
The next Employment Situation report will cover August and is scheduled for September 4.
We will be watching payroll growth, unemployment, labor force participation, wage growth and any further revisions to the July figures.
For now, the July 2026 jobs report shows a US labor market where hiring has weakened enough to produce a negative payroll month, while unemployment remains relatively low.
References
- U.S. Bureau of Labor Statistics, The Employment Situation, July 2026
Related Posts:
- June 2026 Jobs Report Shows Hiring Slowed To 57,000…
- May 2026 Jobs Report Shows 172,000 Jobs Added As…
- The Final July Social Security Payment Arrives July…
- Social Security Payment Scheduled For July 3 Will…
- US Cyber Command Lost Five People to Suicide in One…
- Latest Job Market Trends: Why 20% of U.S. Companies…