The overall circumcision rates in the U.S. decreased slightly between 1980 and 2006, with some fluctuations.
The Midwest consistently had the highest circumcision rates, with a peak of over 80% in the early years, though this gradually declined to around 71% by 2006.
The Northeast had relatively high and stable circumcision rates, ranging from 62% to 68%. The South saw an increase in circumcision rates during the 1990s but declined again in the 2000s.
The West experienced a significant drop, with circumcision rates falling from around 61% in 1980 to about 34% by 2006, representing the lowest regional rate according to the CDC report.
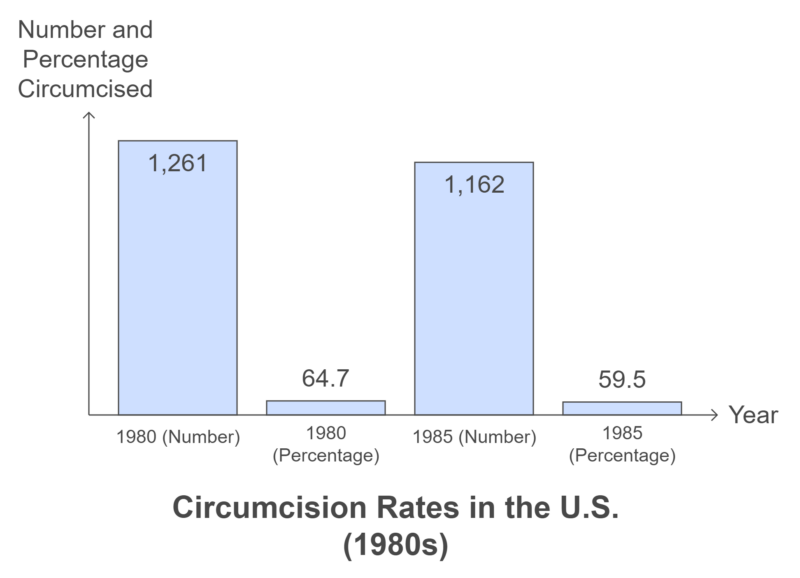
Circumcision was widely practiced, with over 1.2 million circumcisions in 1980, though there was a slight decline by 1985. The percentage also dropped from 64.7% to 59.5%, reflecting some early debates over necessity.
In the 1980s, circumcision rates were generally high across the U.S. This period saw a strong endorsement from pediatricians based on beliefs about improved hygiene and reduced risk of infections. The prevailing medical opinion at the time treated circumcision as almost a preventative measure, not just against infections, but also against sexually transmitted diseases.
Public health campaigns often included circumcision as a recommended practice, reinforcing its acceptance among new parents.
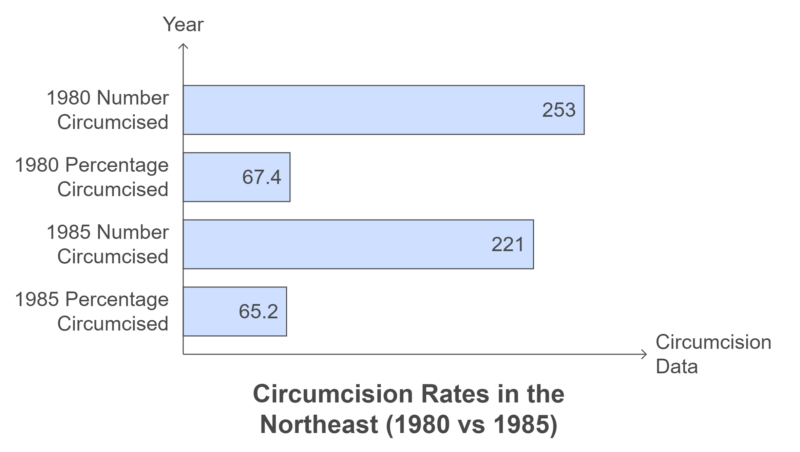
The Northeast
Circumcision rates in the Northeast (1980 vs 1985) chart
The Northeast maintained high circumcision rates, but there was a slight drop from 67.4% to 65.2% by 1985. This reflects strong regional medical practices favoring circumcision in the early 1980s.
In the Northeast, rates were slightly lower compared to the national average. This region has always had a diverse population, with varying cultural and religious beliefs influencing circumcision practices. Many immigrant communities from Europe and Latin America where circumcision is less common contributed to these lower rates.
The medical community in these areas was also beginning to question the universal necessity of the procedure, setting the stage for future debates.
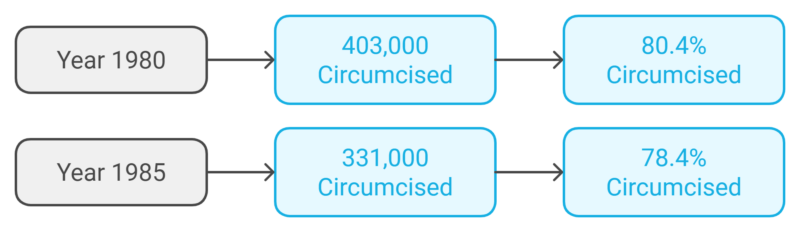
The Midwest
Circumcision rates in the Midwest (1980 vs 1985) chart
The Midwest had the highest circumcision rates in the country, with over 80% of newborns circumcised in 1980. Though there was a small dip by 1985, the region remained a leader in circumcision practices.
The Midwest showed some of the highest rates, often driven by prevailing social norms and a less diverse population at the time. In many communities, circumcision was seen as a standard part of newborn care, rarely questioned by parents or healthcare providers.
This region’s strong adherence to tradition and less exposure to contrasting global perspectives may have contributed to maintaining high circumcision rates.
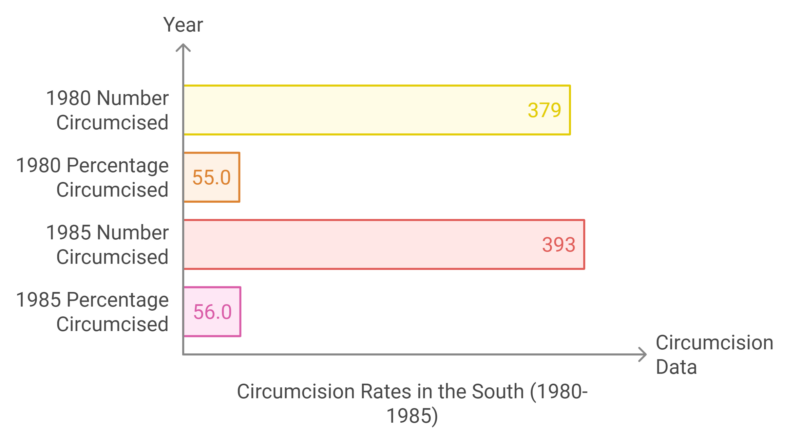
The South
Circumcision rates in the South (1980-1985) chart
The South saw moderate circumcision rates in the 1980s, with a slight increase over the years. This region displayed a more conservative adoption of circumcision practices compared to the Northeast and Midwest.
The South mirrored the Midwest with high rates of circumcision. Here, traditions and health beliefs strongly favored the practice. The procedure was typically intertwined with notions of masculinity and rites of passage, making it a deeply rooted cultural practice.
Moreover, many Southern states had public health policies that actively promoted circumcision, which sustained its popularity.
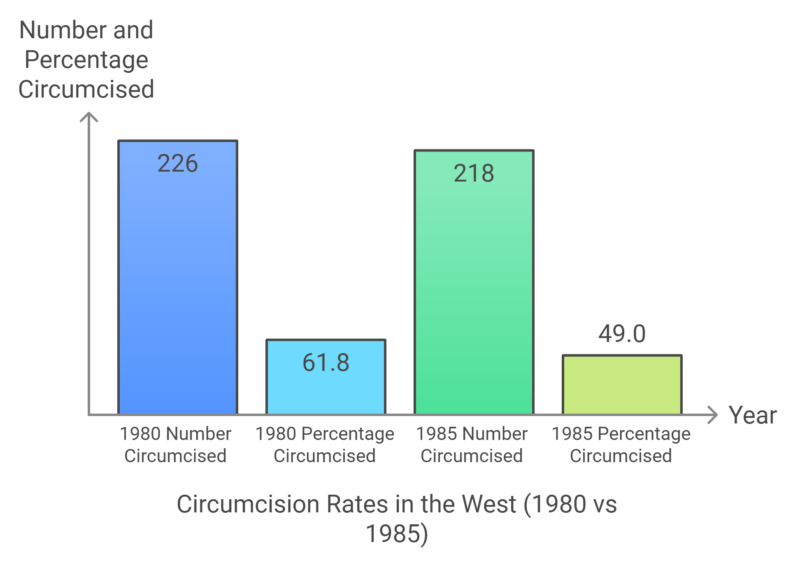
The West
Circumcision rates in the West (1980 vs 1985) chart
The West started with a relatively high rate in 1980, but by 1985 it saw a sharp decline. This early reduction hints at the beginning of cultural shifts and medical skepticism towards routine circumcision in the region.
The West was the beginning of what would become a trend toward lower circumcision rates. Influences from Asian and Pacific cultures, which traditionally do not practice circumcision, played a significant role. The growing advocacy for bodily autonomy and rising skepticism about unnecessary medical procedures also contributed to this shift.
As these ideas gained traction, they began to significantly influence parental choices and medical recommendations.
2. A Shift Begins (1990s)
During the 1990s, circumcision rates began to show noticeable regional differences that were influenced by emerging medical opinions and demographic changes. The medical community started to reevaluate the risks and benefits of the procedure, leading to more balanced guidelines regarding its necessity.
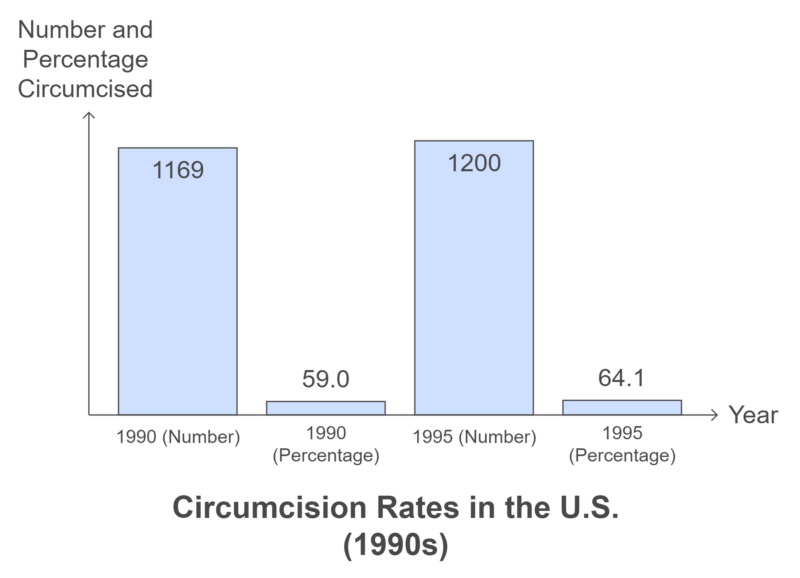
Circumcision rates in the U.S. (1990s) chart
The 1990s showed a rebound after a small dip in 1990, with the percentage increasing to 64.1% by 1995, signaling renewed endorsement by the medical community and the persistence of cultural norms.
Media coverage also began to reflect a broader spectrum of opinions, further fueling the regional debates.
The Northeast
Rates continued to decline as immigration increased and medical policies began to shift, questioning the necessity of routine neonatal circumcision. The influx of new cultural perspectives provided a broader view of healthcare practices, influencing both public opinion and medical advice.
Hospitals and pediatric practices increasingly offered parents more information and choices regarding circumcision, rather than presenting it as the default option.
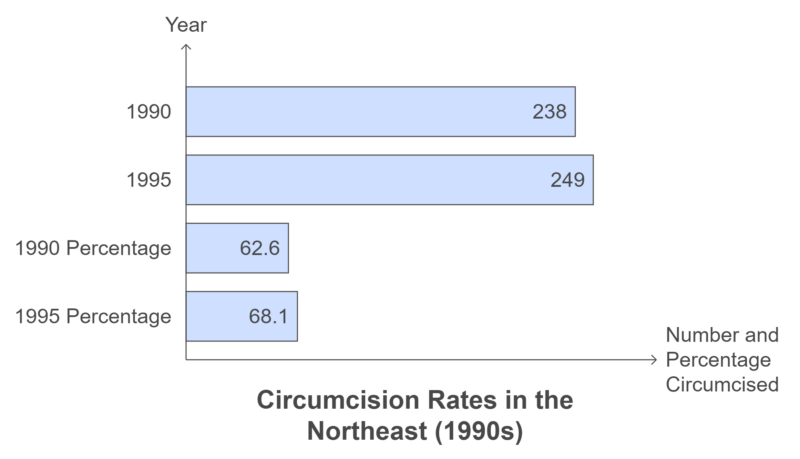
Circumcision rates in the Northeast (1990s) chart
A slight increase occurred in the mid-1990s, indicating renewed emphasis in hospitals and among parents in the Northeast, perhaps driven by stronger public health recommendations.
The Midwest and South
Although still prevalent, the practice began to see slight declines as debates over medical necessity versus cosmetic or cultural reasons took center stage. In these regions, the discussion was often framed around personal choice and the emerging data on potential medical benefits versus risks.
This period also saw the rise of parental advocacy groups that questioned routine medical interventions, including circumcision.
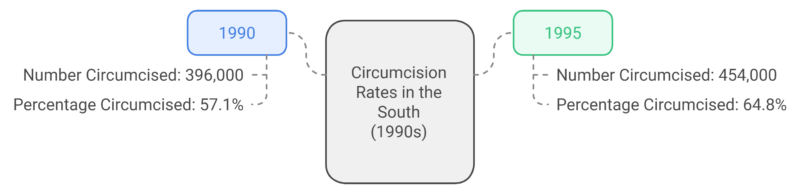
South
Circumcision rates in the South (1990s) chart
The 1990s showed a significant increase in circumcision rates, with the South catching up to other regions, reflecting changes in medical practices and broader cultural acceptance.
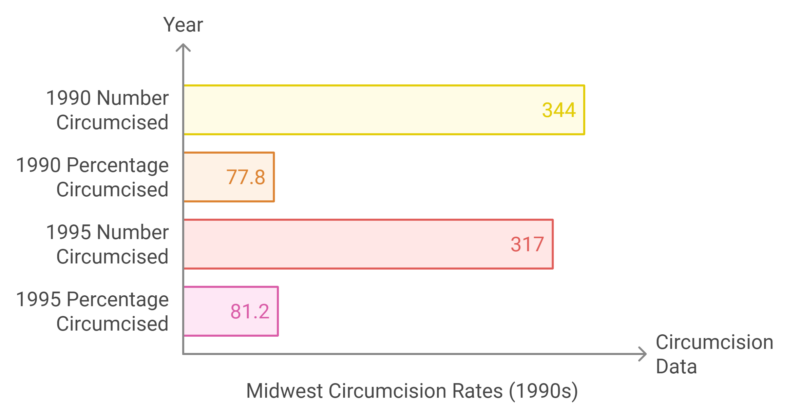
Midwest
Midwest circumcision rates (1990s) chart
The 1990s saw a resurgence, with the Midwest peaking at over 81% circumcision rates in 1995, likely driven by both cultural and healthcare factors unique to the region.
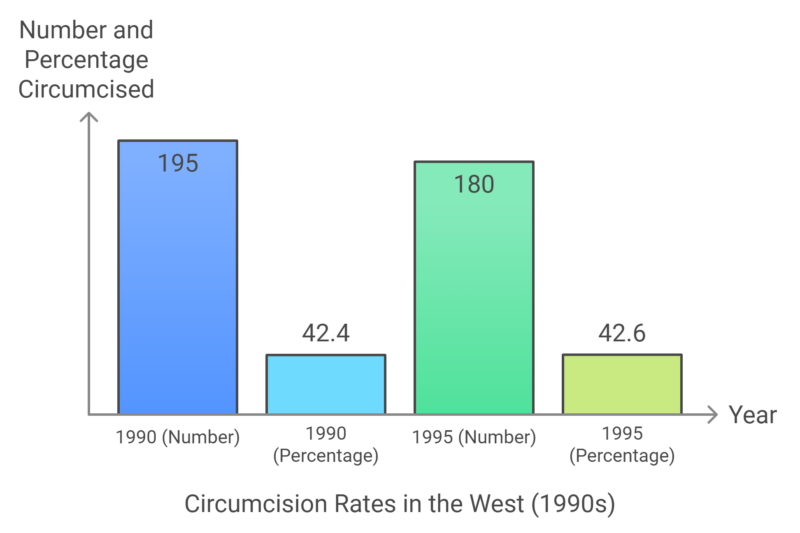
The West
Circumcision rates in the West (1990s) chart
The 1990s continued this downward trend, with circumcision rates stabilizing at a low level compared to other regions, possibly influenced by progressive movements and a stronger focus on individual choice.
The West led the decline in circumcision rates, with some states showing a drop of over 20% by the end of the decade. Increased immigration and changing cultural norms contributed significantly to this trend.
The region’s reputation for progressive health policies and strong advocacy for patient rights encouraged more hospitals and doctors to adopt a more conservative approach to circumcision.
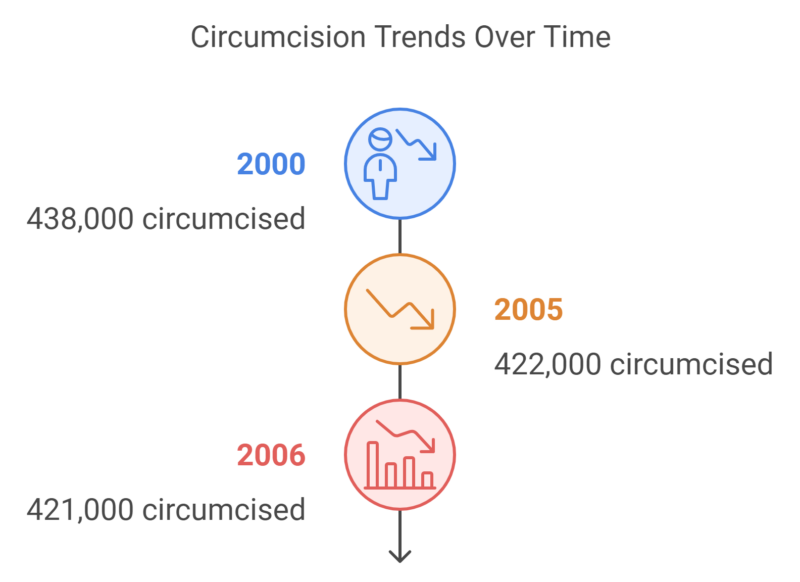
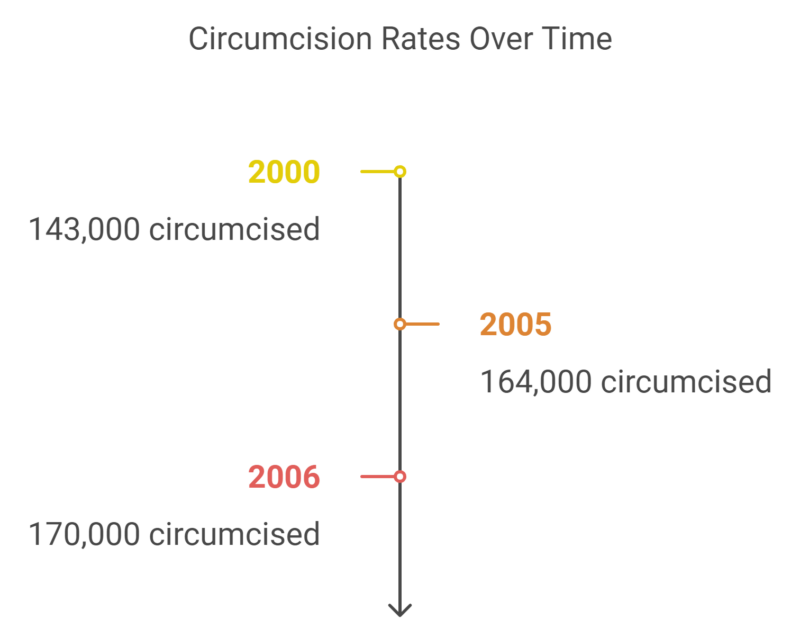
3. The New Millennium (2000-2006)
By the new millennium, the debate intensified with more robust medical studies and public discussions about the pros and cons of circumcision.
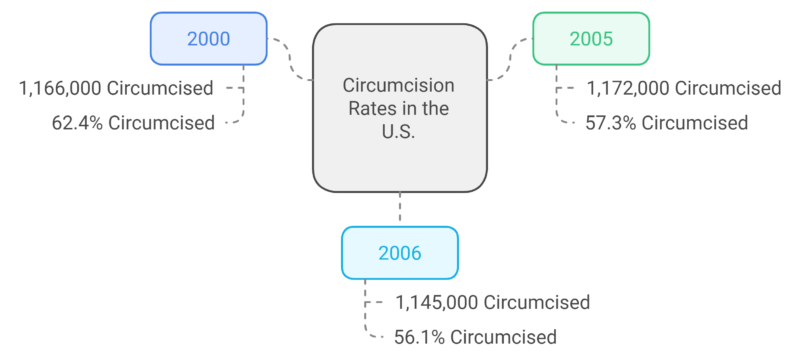
Circumcision rates in the U.S. (2000-2006) chart
In the 2000s, rates slightly declined. By 2006, fewer newborns were circumcised compared to the 1990s, reflecting growing discussions around medical necessity, ethical considerations, and cultural shifts.
These discussions were increasingly informed by high-quality research studies that questioned the previously assumed health benefits of routine circumcision.
The Northeast
The Northeast saw a further decline, influenced by changing medical guidelines and increased public awareness of the nonmedical factors. This decline was supported by a robust network of healthcare providers who emphasized patient education and informed consent.
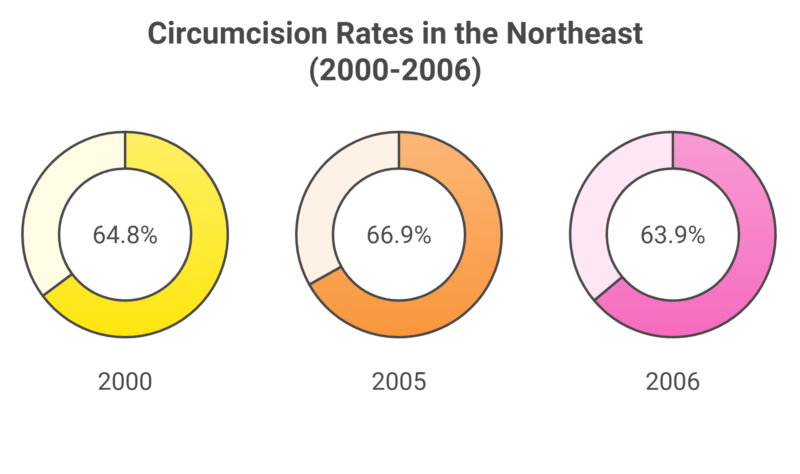
Circumcision rates in the Northeast (2000-2006) chart
The 2000s saw stable circumcision rates, indicating that the procedure remained widely accepted in the Northeast, even as other regions started to see more noticeable declines.
The area’s diverse population continued to play a crucial role, as newer generations of parents made decisions based on a mixture of cultural, ethical, and medical factors.
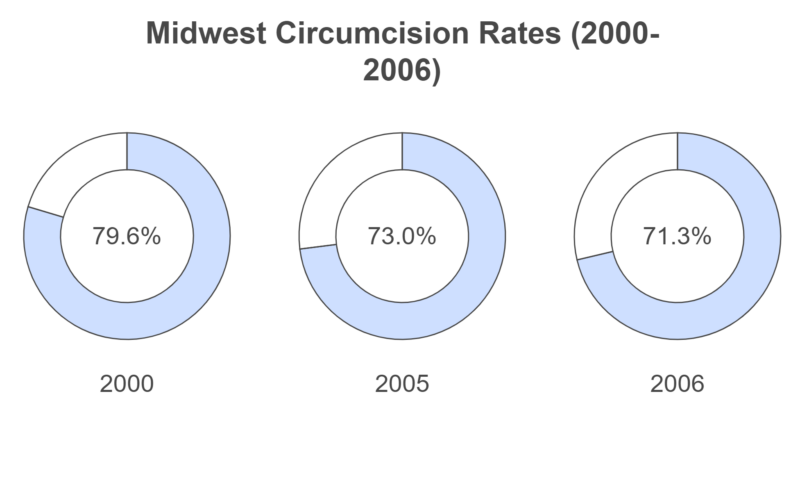
The Midwest
The Midwest began to experience a more pronounced decline, reflecting broader national trends and changing perceptions. This shift was partly due to increased access to medical information via the Internet, allowing parents to make more informed choices.
Midwest circumcision rates (2000-2006) chart
In the 2000s, circumcision rates started to decline slightly, though still remained the highest compared to other regions, showing that the Midwest held on to traditional practices longer.
Healthcare providers in the region also started to adopt less prescriptive approaches to neonatal care, including circumcision.
The South
While rates in the South decreased, they did so more slowly, maintaining higher levels than the rest of the country due to stronger cultural and traditional influences. However, even in this region, the voices advocating for choice and informed consent were becoming louder.
South circumcision rates (2000-2006) chart
The 2000s saw a gradual decline, but the South still maintained moderate rates, indicating that circumcision remained a standard medical procedure in the region, though not as dominant as in the Midwest.
Educational efforts began to slowly shift public opinion, even in areas where circumcision was deeply entrenched.
The downward trend is probably fueled by Medicaid laws in many states that have stopped paying for the surgery, increased immigration from Latin America and other areas where circumcision is less common, and a growingly vocal cadre of so-called “intactivists” who argue that the practice is a human rights violation.
The West
The West continued to lead the trend toward lower circumcision rates, driven by a strong influence of cultural diversity and alternative medical viewpoints. This area became a hub for medical conferences and scholarly discussions that often challenged traditional medical practices.
West circumcision rates (2000-2006) chart
The West had the lowest circumcision rates by the 2000s, reflecting a significant cultural shift, with growing opposition to circumcision based on medical, ethical, and social reasons.
The presence of a vibrant and vocal community advocating for non-interventionist approaches to childbirth and newborn care further accelerated the decline in circumcision rates.
This article was developed by analyzing data from the Centers for Disease Control and Prevention (CDC) and various studies on circumcision trends across the U.S. from 1980 to 2006. Data on circumcision rates was categorized by region (Northeast, Midwest, South, and West), with a focus on fluctuations over time.
Trends were compared using regional demographics, cultural influences, and evolving medical guidelines. This approach allowed for an understanding of how medical opinions and societal norms shaped circumcision practices across different regions during the observed period.
We use cookies to ensure that we give you the best experience on our website. If you continue to use this site we will assume that you are happy with it.