
Nashville is still gaining residents, although the pace and location of that growth are changing. Nashville has a projected population of 726,586 in 2026, following the U.S. Census Bureau’s official estimate of 721,074 for July 2025.
The 2026 figure is a projection published by World Population Review, not a completed federal census count. The latest official Census Bureau estimate for Nashville-Davidson shows that the population grew by 4.6% from the 2020 estimates base to July 2025.
Nashville is the capital and largest city of Tennessee. Its expanding healthcare, tourism, education, logistics and entertainment sectors continue to attract workers, while housing costs and limited supply inside the urban core are directing more growth toward Rutherford, Williamson, Wilson and other surrounding counties.
One distinction matters throughout this article: Nashville proper, Davidson County and the Nashville metropolitan area are different geographies. Treating them as one place produces population totals that can differ by more than one million people.
Key Insights
- Projected Nashville population in 2026: 726,586
- Latest official Nashville-Davidson estimate: 721,074 on July 1, 2025
- Growth since the 2020 estimates base: 4.6%
- 2020 Census population: 689,447
- Land area: 475.78 square miles
- Median household income: $77,371
- Poverty rate: 14.1%
- Foreign-born share: 15.3%
- Adults with a bachelor’s degree or higher: 48.0%
- Metro unemployment rate: 2.7% in May 2026, preliminary
Nashville and Davidson County have operated under a consolidated metropolitan government since 1963. The Census Bureau’s Nashville-Davidson metropolitan government balance excludes the separately incorporated municipalities within Davidson County, including Belle Meade, Berry Hill, Forest Hills, Goodlettsville, Oak Hill and Ridgetop.
The 726,586 projection therefore describes the Nashville-Davidson balance rather than every resident of Davidson County. The wider Nashville-Davidson-Murfreesboro-Franklin metropolitan statistical area extends into multiple Middle Tennessee counties and contains well over two million residents.
| Geography | Population Figure | What It Means |
|---|---|---|
| Nashville-Davidson balance | 726,586 projected for 2026 | The consolidated city area excluding separately incorporated municipalities |
| Nashville-Davidson balance | 721,074 official estimate for July 2025 | The newest completed Census Bureau annual estimate |
| Davidson County | Larger than the city-balance figure | Includes Nashville and the separately incorporated municipalities |
| Nashville metropolitan area | More than 2 million | The regional labor and housing market extending through several counties |
Some websites report a Nashville urban-area total near 1.3 million. The series published by Macrotrends and the forecast discussed in Nashville population projections to 2035 use an urban-agglomeration definition. Those figures are useful for studying the continuously built-up area, but they are not interchangeable with the Census metropolitan statistical area.
Nashville Got Almost 200,000 New Resident in Last 25 Years

Nashville had 545,524 residents in 2000 and 601,222 in the 2010 Census. The population reached 689,447 in 2020, an increase of 88,225 people during the decade. The latest estimate places the city at 721,074 in 2025, while the 2026 projection adds another 5,512 residents.
| Year | Population | Status | Change From Previous Entry |
|---|---|---|---|
| 2000 | 545,524 | Census | — |
| 2010 | 601,222 | Census | +55,698 |
| 2020 | 689,447 | Census | +88,225 |
| 2025 | 721,074 | Official annual estimate | +31,627 from 2020 |
| 2026 | 726,586 | Projection | +5,512 |
Growth Is Moving Beyond Davidson County
Nashville proper continues to grow, but the region’s strongest gains are increasingly suburban. Families looking for larger homes, new construction or lower prices often move toward Murfreesboro, Lebanon, Gallatin, Spring Hill and communities along the Interstate 24, Interstate 40 and Interstate 65 corridors.
That pattern resembles growth around Charlotte, where the central city remains the economic anchor while neighboring counties absorb a growing share of new households. In Middle Tennessee, the result is a larger commuter shed and heavier demand on roads, schools, utilities and regional transit.
Why Older Metro Forecasts Look Too Small
Earlier urban forecasts placed Nashville near 1.42 million by 2030 and 1.48 million by 2035. Those numbers did not describe the full modern Census metro area. Boundary changes and competing definitions make long-range comparisons difficult, which is why every population figure should identify whether it refers to the city balance, Davidson County, the urban agglomeration or the metropolitan statistical area.
Nashville Demographics in 2026
The newest demographic profile comes from Census QuickFacts and the 2020–2024 American Community Survey. Those datasets describe the population living in Nashville-Davidson before the 2026 projection, but they are the freshest completed federal source for age, race, income, education and household characteristics.
Age
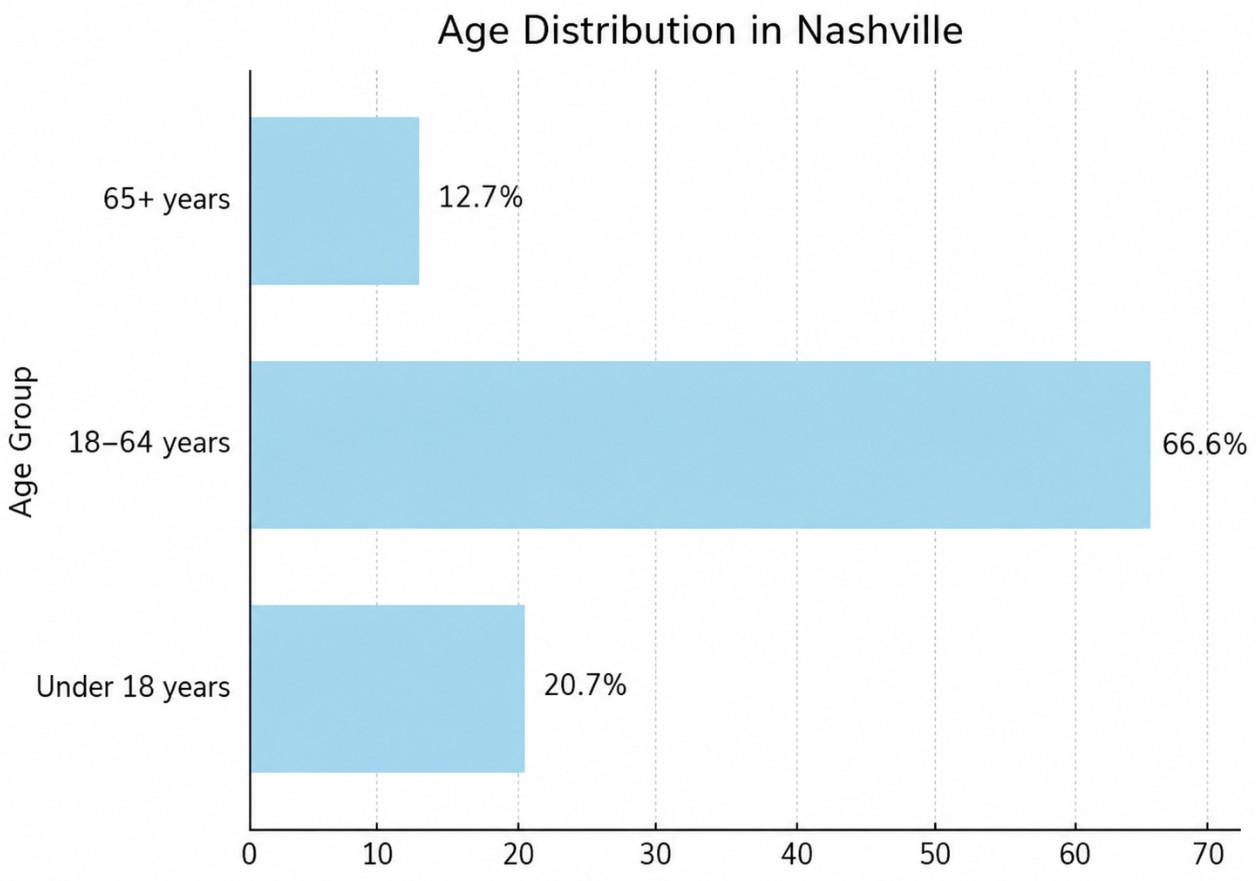
Nashville remains younger than many large U.S. cities. The estimated median age is 34.5, while 20.7% of residents are under 18 and 12.7% are 65 or older. A large working-age population helps support the city’s employment base, though the growing number of older residents will place more demand on healthcare, accessible housing and transportation.
Gender
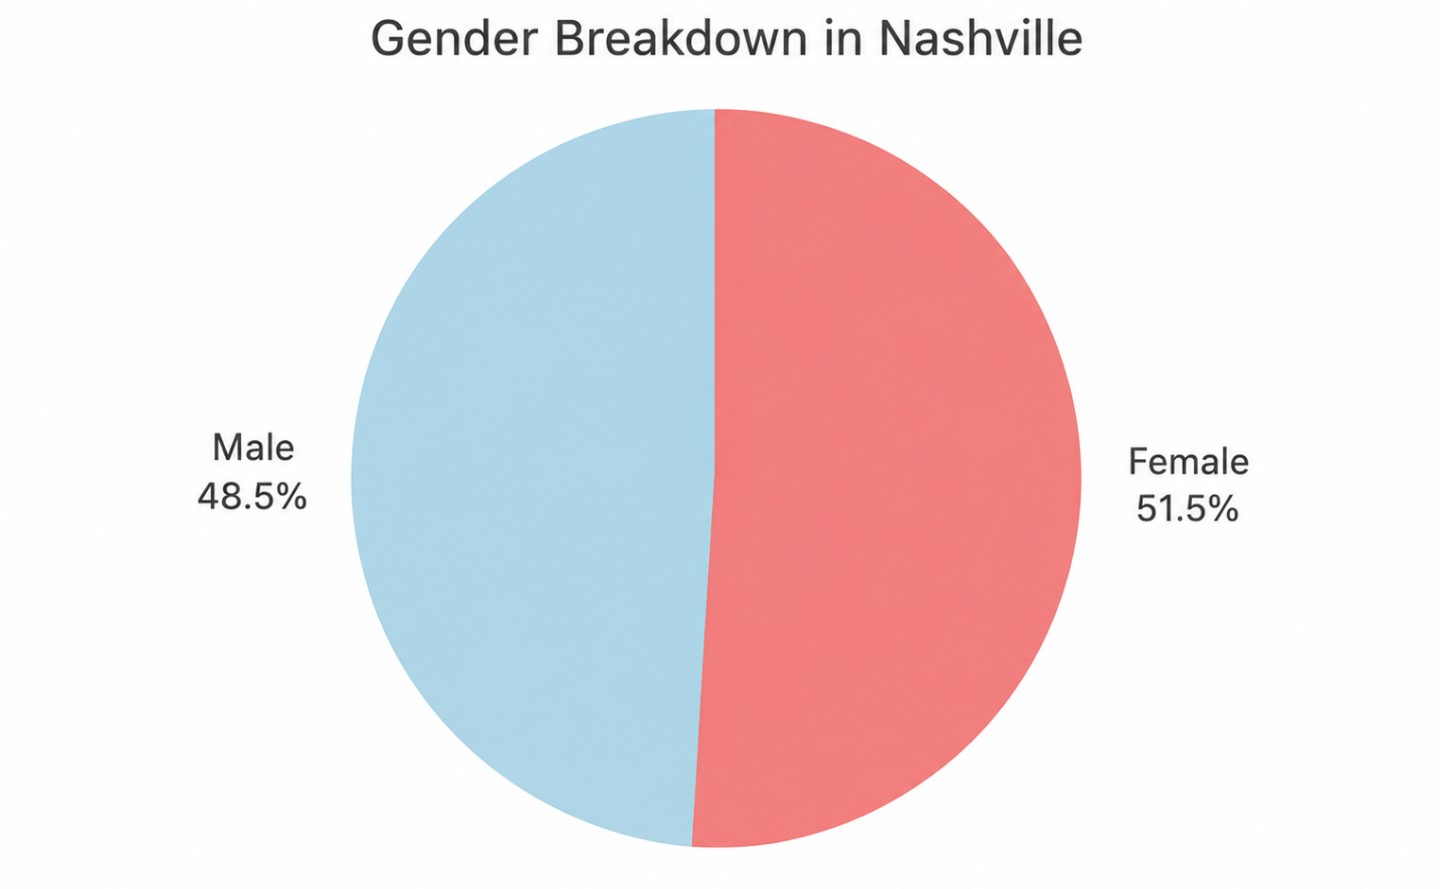
Women account for 51.5% of Nashville’s population and men account for about 48.5%. The split has remained close to even as the city has grown.
Race and Ethnicity
Nashville’s population is 54.6% White alone and 24.9% Black or African American alone. Residents reporting two or more races make up 11.2%, while 3.5% identify as Asian alone. Hispanic or Latino residents account for 14.1% of the population and may be included in any racial category.
| Race or Ethnicity | Share of Population |
|---|---|
| White alone | 54.6% |
| Black or African American alone | 24.9% |
| Two or more races | 11.2% |
| Asian alone | 3.5% |
| American Indian and Alaska Native alone | 0.5% |
| Native Hawaiian and Other Pacific Islander alone | 0.1% |
| Hispanic or Latino, any race | 14.1% |
Another 15.3% of residents were born outside the United States, and 19.6% of people age five or older speak a language other than English at home. Those figures help explain the growth of Latino, Kurdish, Middle Eastern, African and Asian communities throughout Davidson County.
Income and Poverty
The Census Bureau reports a median household income of $77,371 in 2024 dollars and per capita income of $49,061. The poverty rate is 14.1%. An earlier profile from Point2Homes listed average household income at $112,434, but an average is pulled upward by high-income households and should not be confused with the median.
| Income Measure | Current Federal Estimate |
|---|---|
| Median household income | $77,371 |
| Per capita income | $49,061 |
| People below the poverty line | 14.1% |
| People under 65 without health insurance | 14.4% |
Education
Among Nashville residents age 25 or older, 90.8% have completed high school and 48.0% hold at least a bachelor’s degree. The concentration of college graduates supports healthcare management, software, finance, music production and professional services, while employers still compete for workers in construction, hospitality, logistics and skilled trades.
| Education Measure | Share of Adults 25 and Older |
|---|---|
| High school graduate or higher | 90.8% |
| Bachelor’s degree or higher | 48.0% |
Households
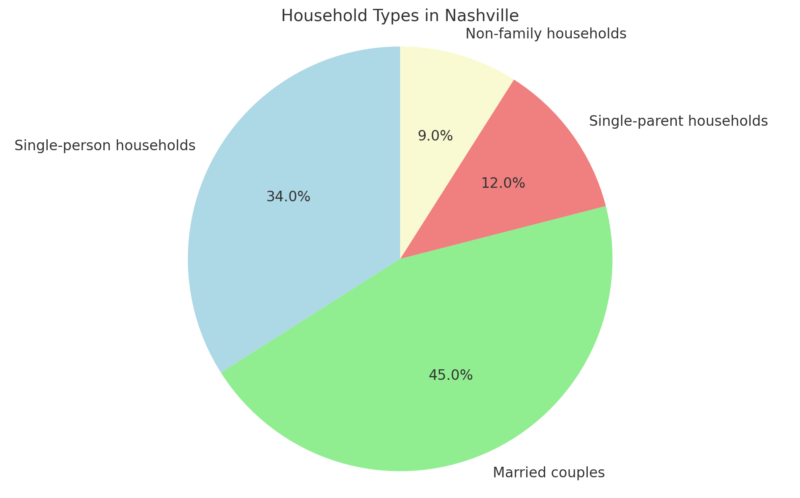
Nashville has 313,513 households, with an average of 2.13 people per household. The owner-occupied housing rate is 52.4%, leaving a large renter population exposed to changes in monthly housing costs.
What Keeps Nashville Growing

Music and tourism give Nashville its international profile, but healthcare is the city’s largest institutional strength. Hospital systems, healthcare management companies, universities, state government, logistics firms, manufacturers and technology employers give the labor market several independent sources of demand.
The Nashville Area Chamber of Commerce described the region’s strong post-pandemic performance in its review of how Nashville’s economy beat expectations. Current federal data show that employment remains high, although growth varies considerably by industry.
Latest Nashville Employment Figures
The Bureau of Labor Statistics regional report shows a preliminary metro unemployment rate of 2.7% in May 2026. The civilian labor force contained nearly 1.2 million people, and 1.166 million were employed.
| Labor Market Measure | December 2025 | January 2026 | February 2026 | March 2026 | April 2026 | May 2026 |
|---|---|---|---|---|---|---|
| Civilian labor force, thousands | 1,210.3 | 1,191.0 | 1,187.2 | 1,185.8 | 1,196.9 | 1,198.9 |
| Employment, thousands | 1,174.9 | 1,154.7 | 1,148.4 | 1,152.0 | 1,161.6 | 1,166.3 |
| Unemployment, thousands | 35.5 | 36.3 | 38.8 | 33.8 | 35.2 | 32.6 |
| Unemployment rate | 2.9% | 3.0% | 3.3% | 2.9% | 2.9% | 2.7% |
May 2026 figures are preliminary and may be revised by the BLS.
Industries Adding Jobs
Total nonfarm employment reached approximately 1.199 million in May 2026, up 0.4% from a year earlier. Leisure and hospitality recorded the strongest percentage gain among the major sectors at 2.8%, followed by information at 1.9%, professional and business services at 1.5%, and education and health services at 1.4%.
Financial activities and government employment declined over the year. The mixed result is more informative than the old claim that every part of Nashville’s economy is booming at once: the labor market remains tight, but its growth has become selective.
Housing Costs Are Redirecting Population Growth
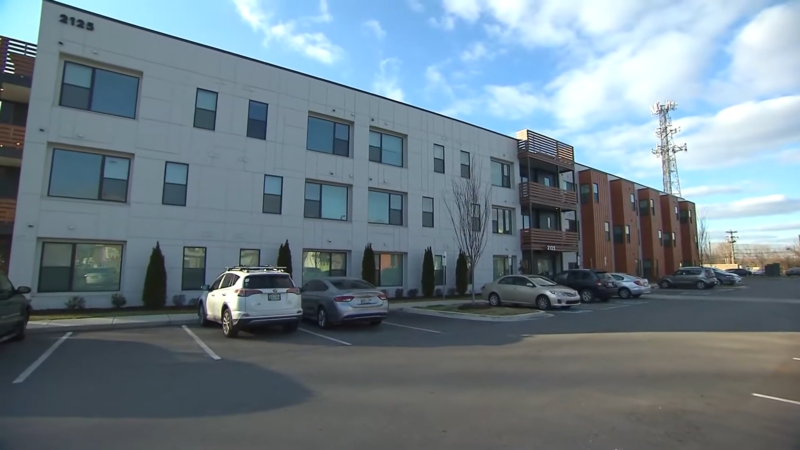
The Census Bureau places the median value of owner-occupied homes at $413,600 and median gross rent at $1,586. More recent market tracking from Zillow’s Nashville housing report puts the average home value at $436,603 as of June 2026, down 3.3% from a year earlier.
The median sale price was $458,333 in May, while the median list price reached $499,900 in June. Homes typically went pending in 25 days. Only 14.8% sold above list price, while 61.6% sold below it, evidence that buyers gained negotiating room even though the market remained expensive.
| Housing Measure | Latest Figure |
|---|---|
| Average Nashville home value | $436,603 |
| Annual change in average value | -3.3% |
| Median sale price | $458,333 |
| Median list price | $499,900 |
| Typical time to pending | 25 days |
| Sales above list price | 14.8% |
| Sales below list price | 61.6% |
Price differences within the city are substantial. Zillow places typical values near $625,203 in Germantown and $775,801 in Salemtown, compared with about $388,291 in Elizabeth Park. Buyers who cannot find a suitable home in Davidson County often widen the search to nearby counties, reinforcing suburban population growth.
Where New Nashville Residents Come From
Domestic migration has helped Nashville grow for years. Atlanta, Dallas-Fort Worth, Chicago and other large metropolitan areas regularly appear among the sources of new residents, along with moves inside Tennessee from Memphis, Knoxville and Clarksville.
The connection with the Midwest is visible in the movement out of states such as Illinois. Nashville also receives residents from fast-growing Sun Belt markets, including Atlanta and Dallas-Fort Worth. Lower taxes, employment opportunities and family connections can draw movers, but the widening difference between Nashville wages and housing costs complicates the decision.
International Migration Is Part of the Story
Foreign-born residents make up 15.3% of Nashville’s population. The Tennessee Immigrant and Refugee Rights Coalition and Conexión Américas provide legal, educational, business and family support to newcomers.
Nashville’s approach was shaped by a major political fight in 2009, when voters rejected a proposal that would have restricted most city communication to English.
The campaign to defeat the English-only measure became an important chapter in the city’s immigrant-integration efforts.
The American Immigration Council later examined how welcoming policies affected Nashville and other cities.
More Residents Mean More Pressure on Transportation
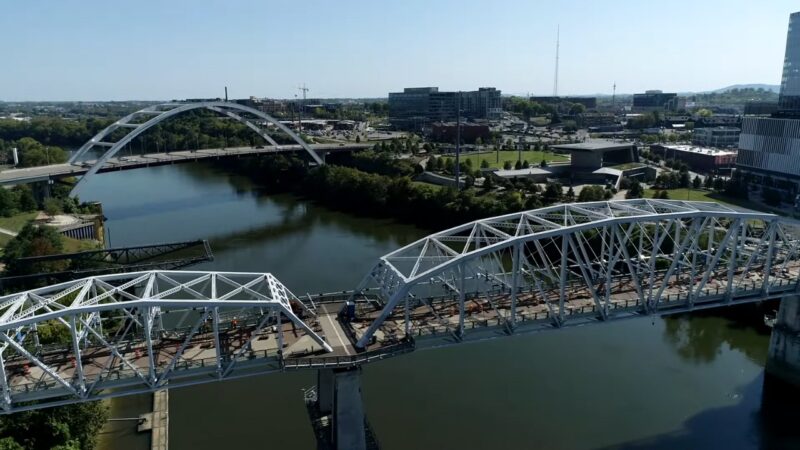
The average Nashville commute is 24.7 minutes, but a regional average can hide much longer trips from rapidly growing suburbs. Earlier proposals called for a $6 billion network of light rail and rapid bus lines. Contemporary coverage described both the original $6 billion transit recommendation and the advancement of the nMotion transit plan, but that proposal is not the program Nashville is building today.
Voters approved the $3.1 billion Choose How You Move transportation program in November 2024. A half-cent sales tax that took effect in February 2025 supports expanded bus service, upgraded traffic signals, new sidewalks, safer crossings, transit centers and improved bus stops rather than a light-rail network.
The distinction matters because older articles still describe the abandoned rail-heavy plan as Nashville’s current policy. The adopted program focuses on projects that can be delivered in stages while the population continues to rise.
Culture Is Changing With the Population
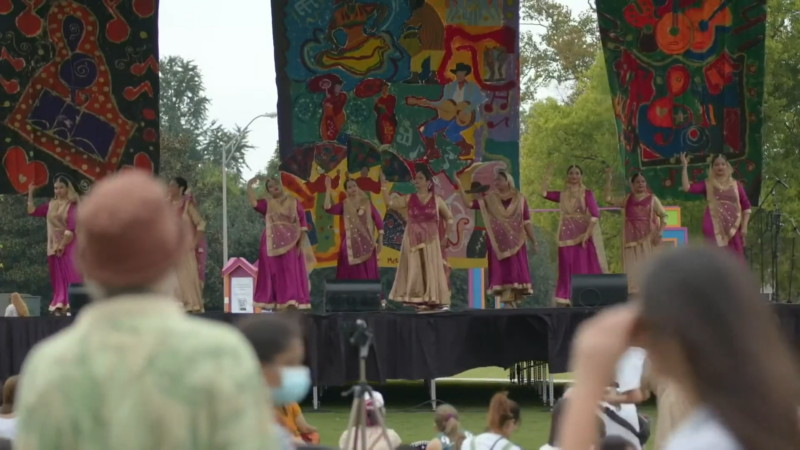
Country music remains central to Nashville’s identity, but the city’s cultural life is broader than the tourism district around Lower Broadway. Kurdish, Mexican, Salvadoran, Egyptian, Ethiopian, Somali, Vietnamese and other communities have built businesses, restaurants, churches, mosques and community organizations throughout the county.
The Celebrate Nashville Cultural Festival gives many of those communities a shared public stage. Smaller neighborhood events and food promotions, including Nashville Scene’s Burger Week, also show how the city’s restaurant culture has moved beyond a narrow definition of Southern food.
Growth has brought opportunity, but it has also displaced long-time residents in neighborhoods where rents and property values rose faster than incomes. North Nashville, East Nashville, The Nations and areas near downtown illustrate the tension: investment can restore buildings and attract businesses while making it harder for established households to remain.
Population Growth and City Government
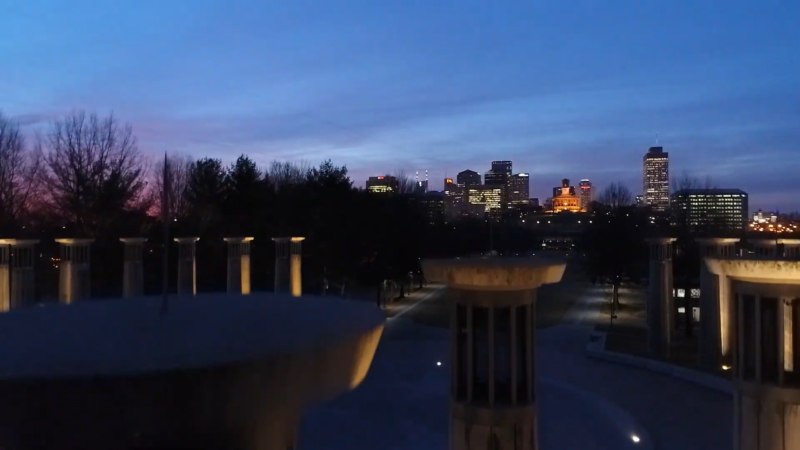
Population growth affects nearly every major decision at Metro Hall: road capacity, school enrollment, affordable housing, public safety, water infrastructure, parks and transit. Mayor Freddie O’Connell and the Metro Council must also manage a difficult relationship with Tennessee’s state government, which has repeatedly challenged Nashville’s local authority.
WPLN documented those tensions in its account of Nashville city government and state intervention. The legal and political disputes matter because regional growth requires long-term planning, while changes imposed by the state can alter who controls local boards, council structure and major public assets.
The $2.1 billion enclosed Tennessee Titans stadium is another major commitment. The original agreement was covered when the Titans and Nashville reached the stadium deal. The 60,000-seat venue is scheduled to open in 2027 and is intended to anchor redevelopment on the East Bank, where housing, parks, offices and transit connections are also planned.
Methodology
The 2026 population figure is a projection from World Population Review. It is anchored to the Census Bureau’s Vintage 2025 estimate of 721,074 residents for the Nashville-Davidson metropolitan government balance. Census QuickFacts and the 2020–2024 American Community Survey provide the demographic, income, education, housing and commuting figures.
Labor-market data come from the Bureau of Labor Statistics and are current through May 2026. May figures are preliminary. Housing-market figures come from Zillow and carry different reporting dates because sale prices, listings and home-value indexes are released on separate schedules.
City, county, urban-area and metropolitan figures were kept separate. Macrotrends and United Nations urban-agglomeration forecasts remain linked for continuity, but their geography is not presented as the Census-defined metropolitan area.
References
- U.S. Census Bureau – Nashville-Davidson QuickFacts
- World Population Review – Nashville Population 2026
- Point2Homes – Nashville Demographics
- Nashville Now Next – Nashville Population Trends and UN Forecast
- Macrotrends – Nashville Urban Area Population
- Nashville Area Chamber of Commerce – Nashville Economy Review
- Bureau of Labor Statistics – Nashville Metro Economy at a Glance
- Zillow – Nashville Housing Market
- American Immigration Council – How Welcoming Immigrants Gave Nashville a Boost
- The Bond Buyer – Nashville’s Earlier Transit Plan
- WPLN – Nashville City Government and State Relations