
The current metro area population of Los Angeles, California is estimated at 12,678,000, which reflects a modest growth of 0.51% from the previous year.
This dynamic change offers insights into the region’s economic and social milieu.
Despite the growth of the broader metro area, Los Angeles is experiencing a different trend.
With a population of 3,878,704, the city is facing a slight decline, shrinking at a rate of -0.65% annually since the census of 2020 as per US Census.
Los Angeles County, California’s estimated 2025 population is 9,606,925, with a growth rate of -0.58% in the past year, according to the most recent as from World Population Review
Key Takeaways
Population Size and Demographics

This diversity contributes to the vibrant cultural tapestry of the city. The average household income in Los Angeles stands at $116,961.
Economically, the city represents a wide range of professions, from entertainment and technology to healthcare and international trade.
While the population has observed a downward trend in recent years, the greater Los Angeles metro area shows slight growth.
In 2025, the metro population reached 12,678,000 as per Macrotrends, marking a 0.51% increase from the previous year.
Population Density and Distribution

The city holds an average density of approximately 8,304.2 people per square mile. This makes it one of the most crowded cities in the United States.
The high density is influenced by the city’s role as a cultural, economic, and entertainment center, attracting numerous residents and visitors alike.
Birth and Death Rates
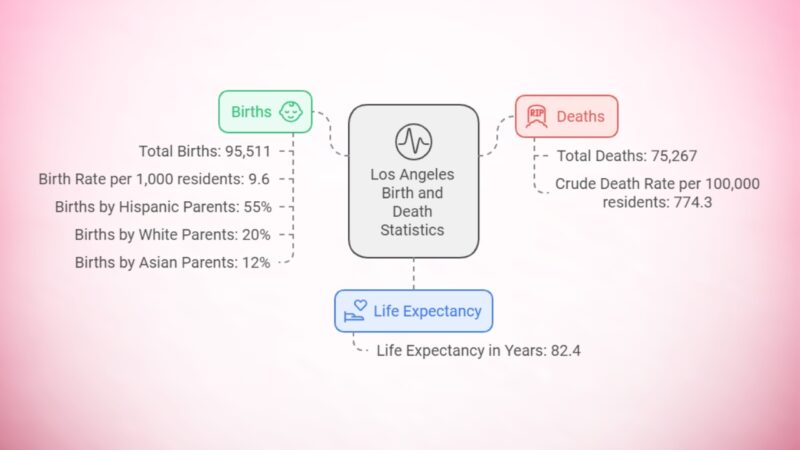
In 2022, Los Angeles County recorded 95,511 births, translating to a birth rate of 9.6 per 1,000 residents. This marks a gradual decline from earlier years, reflecting broader trends across California, where birth rates have reached historic lows. The most significant portion of births (55%) was among Hispanic parents, while White and Asian parents accounted for 20% and 12%, respectively.
These declining birth rates have been attributed to various factors, including economic pressures, delayed marriages, and increased access to family planning.
On the other hand, death rates have fluctuated. In 2022, Los Angeles County recorded 75,267 deaths, with a crude death rate of 774.3 per 100,000 people.
Notably, life expectancy in the county averages around 82.4 years, with variations across different communities according to the LA Almanac.
These trends highlight the importance of public health services in managing both population growth and aging demographics.
Migration Patterns
Migration patterns greatly affect Los Angeles’s population. The city often experiences an influx of international immigrants, drawn by its vibrant economy and cultural diversity.
However, the threat of wildfires has also driven some to reconsider their long-term stay in the area. Conversely, there has been a notable California exodus in recent years, with residents relocating to other states for various reasons, including affordability concerns.
Los Angeles has long been a city of movement, with people constantly arriving and departing due to various economic and lifestyle factors.
While some residents leave in search of more affordable housing or new job opportunities, others are drawn to the city’s diverse economy and cultural appeal.
Relocating, especially across state lines, can be a complex process, requiring careful planning and logistics.
For those considering such a move, having access to reliable information and resources can make all the difference. You can find more insights here on what to consider when planning an interstate move.
Despite these shifts, Los Angeles remains a hub of international immigration, keeping its population diverse and its industries thriving.
Key Drivers
- Economic opportunities: A primary factor for migration into the city.
- Housing costs: Higher prices push some residents to seek more affordable living conditions elsewhere.
Age Structure of the Population

The 2025 population pyramid for Los Angeles shows a balanced gender distribution. Males slightly outnumber females, with 1,941,047 males (50.01%) compared to 1,939,994 females (49.99%) referring to Neilsberg article. This almost equal split suggests that gender balance is well-maintained in the city’s population structure.
Age Distribution and Median Age
Los Angeles has a median age of 36.5 years, with the male median age being 35.8 years, while the female median age is slightly higher at 37.3 years. This indicates that women tend to live slightly longer or that the population of older women is larger than that of older men.
The population pyramid highlights how many individuals fall into each age category. The age groups show the concentration of different age brackets, ranging from 0 to over 80 years. There is a particularly large segment of people in their working-age years, which reflects a robust adult population.
Adult and Senior Population

Age Dependency Ratios
- Age Dependency Ratio: Los Angeles has a total Age Dependency Ratio of 49.6. This means that for every 100 working-age adults (ages 18-64), there are approximately 50 dependents, either children or seniors.
- Old Age Dependency Ratio: The Old Age Dependency Ratio is 20.1, meaning that for every 100 working-age adults, there are around 20 seniors dependent on them.
- Child Dependency Ratio: The Child Dependency Ratio is 29.5, indicating that for every 100 working-age adults, there are nearly 30 children reliant on their support.
These figures suggest that Los Angeles has a moderately high proportion of dependents compared to working-age individuals, particularly due to the number of children.
Statistic
Value
Total Population
3,820,914
Male Population
(50.01%)
Female Population
49.99%)
Median Age (Total)
36.5 years
Median Age (Male)
35.8 years
Median Age (Female)
37.3 years
Total Adults
3,115,593
Senior Population (65+ years)
521,015
Age Dependency Ratio
49.6
Old Age Dependency Ratio
20.1
Child Dependency Ratio
29.5
Household Composition
Household Type
Total Households
Average Size
Homeownership Rate
Rental Rate
All Households
1,399,442
2.7
36.6%
63.4%
Non-Family Households
579,640
1.37
24.5%
75.5%
Married Households
530,750
3.61
53.1%
46.9%
Female-Headed Households
193,201
3.7
30.6%
69.4%
Male-Headed Households
95,851
3.68
30.7%
69.3%
Los Angeles has a relatively low homeownership rate, with only 36.6% of households owning homes. Non-family households have the highest rental rate at 75.5%, while married households have the highest ownership rate at 53.1%. Both female and male-headed households also show a high preference for renting.
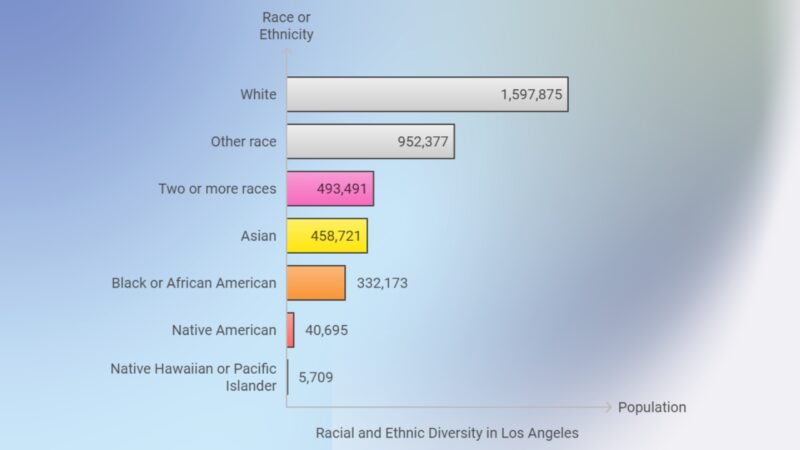
Racial and Ethnic Diversity
Infrastructure
The population growth and demographic changes in Los Angeles are putting significant pressure on its infrastructure.
Investments in transportation systems are a priority, with major projects underway such as the LAX People Mover, a $5-billion automated system designed to ease airport access, and the LAX/Metro Transit Center, a $900-million light rail station to improve public transit connections to the airport as per LA County EDC.
Additionally, the city has begun a $30 million Sidewalk and Transit Amenities Program (STAP), aiming to upgrade 3,000 bus shelters across the city to improve public transportation infrastructure.
Road maintenance and the expansion of transit options are also critical. With traffic congestion remaining a persistent issue, expanding transportation capacity is vital to accommodate a growing population. This includes future investments in the Los Angeles Convention Center, expected to undergo an expansion before the 2028 Olympics.
Educational Attainment
In the broader Los Angeles region, 35.8% of adults aged 25 or older hold at least a bachelor’s degree, while 77.7% have graduated from high school or higher. These figures are slightly below the statewide averages but reflect steady improvement over time.
Metric
Value (2024)
LAUSD Enrollment
429,000 students (TK-12)
High School Graduation Rate (2023)
87%
Percentage of English Language Learners
19.2% (primarily Spanish speakers)
Racial/Ethnic Composition of Students
73.1% Latino, 10% White, 7.1% Black, 3.6% Asian
Bachelor’s Degree or Higher
35.8% of residents aged 25+ (citywide)
High School Graduates or Higher
77.7% of residents aged 25+ (citywide)
LAUSD Enrollment
LAUSD remains the second-largest public school district in the U.S., serving approximately 429,000 students from transitional kindergarten through 12th grade. Enrollment has been declining in recent years, part of a broader trend affecting many large public school districts.
Graduation Rate
The high school graduation rate for LAUSD has remained strong, with 87% of students graduating within four years as of the 2022-2023 school year. This is a critical indicator of overall educational performance.
English Language Learners (ELLs)
View this post on Instagram
A significant portion of LAUSD students (19.2%) are English Language Learners, with the majority being native Spanish speakers. LAUSD supports this diverse linguistic population with numerous bilingual and dual-language programs.
Diversity
LAUSD’s student body is highly diverse, with the majority being Latino (73.1%), followed by White (10%), Black (7.1%), and Asian (3.6%) students. This diversity shapes the district’s educational priorities and resources.
Public Services
As the population evolves, the city must scale its public services to meet new demands. For example, public healthcare and education systems need enhancements, with facilities requiring more resources and staffing to serve a growing and diverse population.
Currently, Los Angeles County is focused on improving healthcare access and addressing social determinants of health, particularly in underprivileged communities according to Los Angeles County.
Moreover, addressing public safety needs, including police, fire, and emergency services, is crucial. Los Angeles has a growing homeless population, with the city investing heavily in affordable housing and services through policies like Measure ULA, which raised over $270 million in 2024 to fund housing programs.
Economic Development
Economic development in Los Angeles is tied closely to population trends. The city remains an attractive hub for business, supported by industries like real estate, entertainment, and tourism.
However, challenges like high living costs, ongoing population decline, and workforce shortages are impacting economic growth. To address these, the local government is focusing on supporting innovation and investment, particularly in clean energy and infrastructure.
Projects such as Destination Crenshaw, a 1.3-mile public art and open space initiative, aim to boost local culture and tourism while spurring community economic development(
Additionally, the city is incentivizing businesses, especially those focused on green technologies and sustainability, to foster long-term economic health.
Unemployment Rate in Los Angeles County (July 2024)
source: tradingeconomics.com
In July 2024, the unemployment rate in Los Angeles County stood at 6.50%, according to data from the United States Federal Reserve. This marks a notable figure in the broader context of historical trends, where unemployment levels have fluctuated dramatically in recent years due to economic pressures.
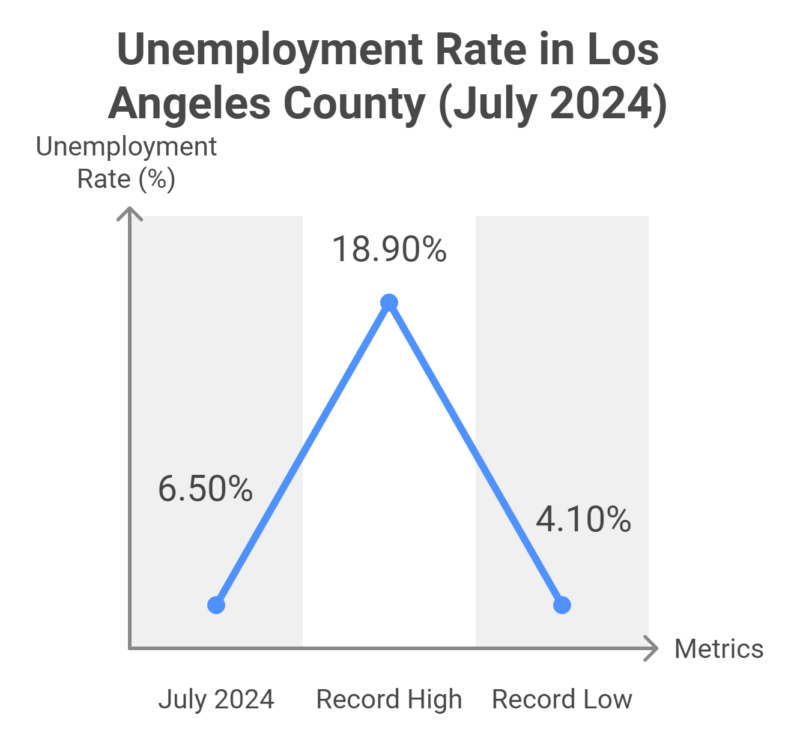
At 6.50%, the unemployment rate is relatively high compared to pre-pandemic levels but much lower than the 18.90% peak seen in May 2020 during the height of the COVID-19 pandemic. The figure reflects ongoing recovery challenges in the region, such as labor market adjustments and economic shifts.
Los Angeles County’s unemployment rate has seen significant fluctuations in recent years. The record high of 18.90% in May 2020 was driven by the economic fallout from the pandemic, while the low of 4.10% in April 2019 came during a period of economic growth.
Comparison with Previous Years
Los Angeles has experienced a slight population decline in recent years. As of 2024, it has a population of approximately 3.80 million, reflecting a slight drop compared to 2023. The city had previously peaked at 3.83 million in 2021. Consistent declines, noted at rates such as 0.05% from 2022 to 2023, signal ongoing demographic shifts within the city.
Los Angeles County, which includes the city, mirrors similar trends. The county’s population in 2023 was 9.66 million, reflecting a decrease since 2021. Such trends are significant, suggesting shifts in either migration patterns or natural population growth within the region.
Comparison with Other Major Cities
While Los Angeles’s population is experiencing a slight decline, contrasting developments emerge in other large metropolitan areas. Dallas-Fort Worth, for instance, showcases growth patterns that hint at a future potential to surpass Los Angeles in population size.
Moreover, Houston’s projections indicate a population nearing that of metro Los Angeles by 2060. These comparisons highlight changing population centers within the United States. Urban dynamics, such as economic opportunities and lifestyle preferences, significantly influence these changes and continue to impact the population distribution among these cities.
Governmental Response and Planning
View this post on Instagram
The city of Los Angeles is actively responding to its shifting population dynamics with a range of urban planning initiatives and population policies. These efforts focus on addressing current challenges associated with population changes while ensuring sustainable growth and infrastructure development.
Urban Planning Initiatives
Los Angeles City Planning is engaged in multiple urban planning initiatives to accommodate future needs. A major focus is on enhancing public transportation and reducing congestion. Projects like the expansion of the Metro system are central to these efforts.
Affordable housing is another priority, with new developments aimed at providing adequate housing for various income levels. The Community Plan Updates also play a crucial role, aiming to balance growth across neighborhoods while preserving community identity.
Infrastructure upgrades, including water and energy systems, are being prioritized to support a resilient urban environment. The city is investing in green spaces and sustainable building practices to improve the overall quality of life for residents.
Housing Market Trends (August 2024)

Median Sale Price
In August 2024, the median sale price for homes in Los Angeles reached $1,006,250, marking a 2.2% increase compared to the previous year as per Redfin. This suggests that while the market may be slowing in other areas, home prices continue to rise, reflecting sustained demand, limited housing supply, or inflationary pressures.
Number of Homes Sold
A total of 1,700 homes were sold in August, a 3.1% decrease from the 1,754 homes sold in August 2023. This decline indicates a cooling in buyer activity, possibly due to rising home prices or higher interest rates, making homeownership less accessible for many.
Median Days on Market
Homes in Los Angeles took an average of 47 days to sell, which is 8 days longer than the 39 days recorded in August 2023. This slowdown in the selling pace suggests that buyers may be taking more time to make decisions, or sellers may be adjusting prices to align with market conditions.
Population Policies

The city is implementing population policies designed to manage potential demographic changes effectively. These policies often aim to retain existing residents and attract new ones by enhancing living conditions.
Economic incentives are being introduced for businesses to promote employment opportunities. Moreover, the city aims to address the housing crisis with incentives for building affordable homes.
Community engagement programs are vital for understanding citizen needs, and Los Angeles is placing significant emphasis on gathering resident feedback to shape these policies. Efforts are also being made to ensure inclusive growth that considers diverse communities within the city.
Crime Statistics (January 1 – August 31, 2023 vs. 2024)
Crime Category
2023
2024
% Change
Unincorporated Areas
Homicide
1
0
-100%
Aggravated Assault
221
174
-21.27%
Burglary
304
299
-1.64%
Property Crimes Total
692
829
19.80%
Violent Crimes Total
119
156
31.09%
Key Insights
- Decreases in Violent Crime: Homicide in unincorporated areas showed a significant decrease, dropping from 1 in 2023 to 0 in 2024. Aggravated assaults also saw a notable decline of 21.27% according to an LA police report.
- Property Crime: While burglary remained relatively stable with a small decline of 1.64%, property crimes overall rose by 19.80%. This suggests that other forms of property-related offenses, such as theft, saw increases.
- Violent Crime Increase: Despite a decrease in certain areas like homicides, overall violent crimes in unincorporated areas increased by 31.09%, highlighting some contrasting trends within specific crime categories.
Data Sources and Methodology

The analysis relies on various data sources to present an accurate picture of the population in Los Angeles for 2024. Key data is sourced from the Department of Finance – California and Neilsberg Research as many others like World Population Review, etc. Both provide updated insights and projections based on recent census and demographic information.
The methodology involves comparing historical population changes with current trends. This includes examining annual changes in population figures as a percentage to understand growth or decline patterns. For example, Los Angeles County saw a population decrease of 0.58% in 2023 compared to the previous year, highlighting ongoing demographic shifts.
Data aggregation includes adjustments for group quarters and household estimates based on 2020 Census benchmarks. Such adjustments ensure that the calculations reflect current living arrangements and demographic changes accurately.
By using these rigorous data collection and analysis methods, the research aims to provide a clear understanding of the evolving population dynamics in Los Angeles.
FAQ
References:
- World Population Review – Los Angeles Population
- Point2Homes – Los Angeles Demographics
- LA Almanac – Life Expectancy in Los Angeles
- LA Times – California Exodus
- CapRadio – Birth Rates in California
- Trading Economics – Unemployment Rate in Los Angeles County
- Redfin – Los Angeles Housing Market
- LAEDC – LA County Economic Forecast
- Los Angeles City Planning – Community Plan Updates