
The latest official population estimate available in 2026 places Houston at 2,397,315 residents. Houston remains the fourth-largest city in the United States and the largest city in Texas.
Houston is based primarily in Harris County, although parts of the city extend into Fort Bend and Montgomery counties. The wider Houston-Pasadena-The Woodlands metropolitan area is far larger than the city itself, with 7,904,627 residents across 10 counties.
The difference between the city and metro figures is important. The city population counts residents inside municipal boundaries. The metro number includes Houston, Pasadena, Sugar Land, The Woodlands, Conroe, Baytown, Galveston and dozens of surrounding communities connected through employment, housing and daily travel.
Official population estimates are released after the period they measure. Figures published during 2026 cover the population recorded on July 1, 2025, making them the newest complete government estimates available for a 2026 population report.
Key Insights
- Houston has an estimated population of 2,397,315.
- The city gained 97,666 residents from the revised 2020 estimates base, an increase of 4.2%.
- The Houston metro area has 7,904,627 residents.
- The metro added 126,720 people in one year, more than any other major U.S. metro.
- Harris County has 5,045,026 residents and added 48,695 people in one year.
- People under 18 make up 23.4% of the city population.
- Residents age 65 and older account for 12.3%.
- Hispanic or Latino residents make up 44.2% of the population.
- Foreign-born residents account for 29.3% of the city.
- The median household income is $64,813.
- The median Houston home sale price reached $349,791 in May 2026.
- The Houston metro supported about 3.51 million nonfarm jobs in May 2026.
Houston City, Harris County and Metro Population
The word Houston can describe three different geographic areas. Population totals change sharply depending on which boundary is being used.
| Geographic Area | Latest Population Available in 2026 | Recent Growth |
|---|---|---|
| City of Houston | 2,397,315 | Up 4.2% from the revised 2020 estimates base |
| Harris County | 5,045,026 | Added 48,695 residents in one year |
| Houston-Pasadena-The Woodlands metro | 7,904,627 | Added 126,720 residents in one year |
The latest Census Bureau figures for Houston show that the city has grown by 97,666 people from the revised April 2020 population base of 2,299,649.
The official 2020 Census count was slightly higher at 2,304,580. Population Estimates Program calculations use a revised base, which explains why the published 4.2% growth rate does not exactly match a calculation made directly from the original census count.
Houston Population Growth Since 2010
| Year | Houston City Population | Type of Figure |
|---|---|---|
| 2010 | 2,099,451 | Decennial Census |
| 2020 | 2,304,580 | Decennial Census |
| 2025 | 2,397,315 | Latest estimate released in 2026 |
Houston added 205,129 residents between the 2010 and 2020 censuses. Growth slowed after Hurricane Harvey and during the first years of the pandemic, but the city returned to stronger gains after 2022.
The wider region has expanded even faster. Metro Houston grew from approximately 6.7 million residents in 2015 to 7.9 million in 2025, adding about 1.2 million people in a decade.
The earlier social media projection expected about 118,000 new metro residents. Final government estimates showed an even larger increase of 126,720.
That gain placed Houston first among the 20 largest U.S. metropolitan areas for both numeric population growth and percentage growth. Metro Houston expanded by 1.6%, narrowly ahead of Dallas and well above most other large regions.
The result keeps Houston among the fastest-growing major urban regions in the United States, although city and metro growth should not be treated as the same measurement.
How Houston Became One of the Largest U.S. Cities
Houston was founded in 1836 after brothers Augustus Chapman Allen and John Kirby Allen purchased land near Buffalo Bayou. The new settlement was named after Sam Houston, who led the Texan army at the Battle of San Jacinto and became the first president of the Republic of Texas.
The city was incorporated in 1837 and briefly served as the capital of the Republic of Texas.
Houston became a major cotton shipping center during the 19th century. Expansion of the bayou and development of the Houston Ship Channel helped connect the city with international trade.
The discovery of oil at Spindletop in 1901 transformed the regional economy. Houston grew into a global energy center, attracting companies, workers and investment from across the country.
Later decades brought new sources of growth. The Texas Medical Center became a major health and research hub. NASA established the Manned Spacecraft Center, now Johnson Space Center, southeast of downtown. Port activity, manufacturing, engineering, logistics, finance and higher education also expanded.
Oil and gas remain important, but the modern economy is no longer dependent on a single industry. Healthcare, construction, professional services, transportation, aerospace and international trade now support a much broader labor market.
Age and Sex Distribution
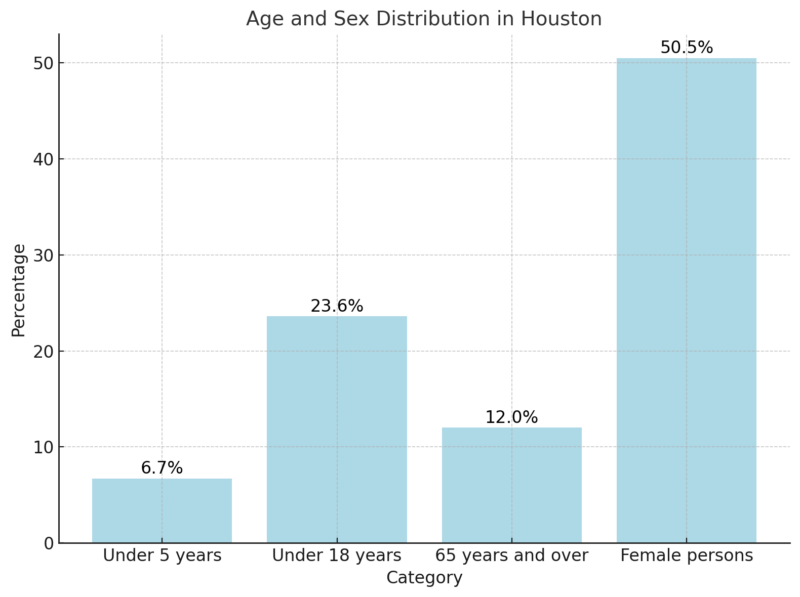
- Age and sex distribution in Houston from an earlier demographic release
The chart above uses an earlier demographic release. Updated figures available in 2026 show that Houston remains a relatively young city, although the senior population continues to grow.
| Age or Sex Category | Share of Houston Population |
|---|---|
| Under age 5 | 6.7% |
| Under age 18 | 23.4% |
| Age 65 and older | 12.3% |
| Female residents | 50.6% |
| Male residents | 49.4% |
Nearly one in four Houston residents is younger than 18. That share supports continued demand for schools, childcare, family housing and entry-level employment.
Residents age 65 and older make up 12.3% of the city. The percentage remains lower than the national senior share, but growth in the older population increases demand for healthcare, accessible housing and transportation services.
Race and Hispanic Origin
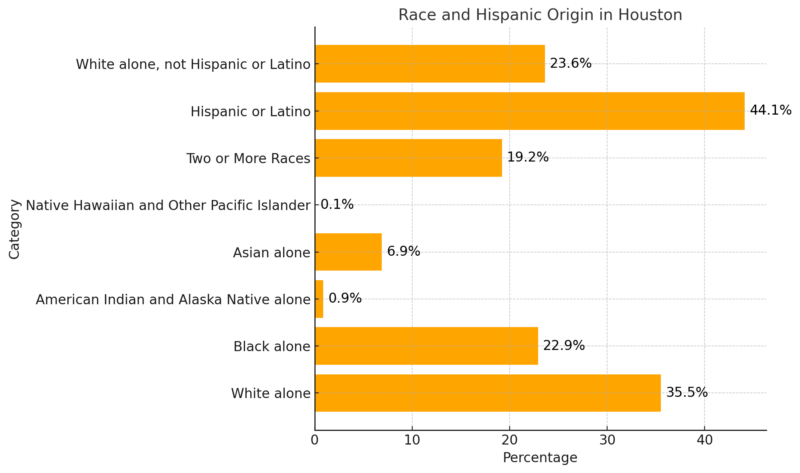
- Race and Hispanic origin in Houston from an earlier demographic release
Houston remains one of the most racially, ethnically and internationally diverse large cities in the country.
| Population Group | Share of Houston Population |
|---|---|
| Hispanic or Latino | 44.2% |
| White alone | 30.4% |
| White alone, not Hispanic or Latino | 23.2% |
| Black or African American alone | 22.7% |
| Asian alone | 6.9% |
| American Indian and Alaska Native alone | 1.0% |
| Native Hawaiian and Other Pacific Islander alone | 0.1% |
| Two or more races | 24.0% |
Hispanic or Latino is an ethnicity rather than a separate race under Census Bureau definitions. Hispanic residents may also be included in White, Black, Asian, multiracial or other race categories, so the percentages should not be added together.
The multiracial share has increased under newer Census Bureau collection and coding methods. Comparisons with much older reports require caution because residents have more ways to describe their racial identity.
Immigration, Language and Other Population Characteristics
| Category | Latest Figure Available in 2026 |
|---|---|
| Veterans | 62,437 |
| Foreign-born residents | 29.3% |
| Residents speaking a language other than English at home | 47.1% |
| Residents under 65 without health insurance | 26.4% |
| Residents under 65 with a disability | 8.2% |
| Average household size | 2.46 people |
| Average journey to work | 27.2 minutes |
Almost three in 10 Houston residents were born outside the United States. Nearly half of residents age 5 and older speak a language other than English at home.
The figures help explain the large number of multilingual schools, businesses, medical services, religious institutions and community organizations across the city.
Houston also has a high uninsured rate. More than one-quarter of residents younger than 65 lack health insurance, placing additional pressure on hospitals, community clinics and public health providers.
Largest Houston Super Neighborhoods by Population
Houston recognizes 88 super neighborhoods. The newest neighborhood-level figures released in 2026 use the 2020-2024 American Community Survey five-year estimates.
Neighborhood totals are statistical estimates rather than exact resident counts. Boundaries also differ from informal neighborhood names used by residents and real estate listings.
| Rank | Houston Super Neighborhood | Estimated Population |
|---|---|---|
| 1 | Alief | 106,778 |
| 2 | Sharpstown | 74,650 |
| 3 | Eldridge / West Oaks | 74,262 |
| 4 | Central Southwest | 71,773 |
| 5 | Kingwood Area | 65,084 |
| 6 | Clear Lake | 62,512 |
| 7 | South Belt / Ellington | 62,467 |
| 8 | Brays Oaks | 58,180 |
| 9 | Mid West | 57,265 |
| 10 | Greater Uptown | 57,260 |
| 11 | Northside / Northline | 53,829 |
| 12 | Memorial | 51,575 |
| 13 | Greater Heights | 51,157 |
| 14 | Golfcrest / Bellfort / Reveille | 48,517 |
| 15 | Central Northwest | 44,865 |
Alief remains the largest super neighborhood by population. The area is known for its immigrant communities, international restaurants, apartment developments and established single-family neighborhoods.
Sharpstown, Eldridge / West Oaks and Central Southwest each have more than 70,000 residents. Several large suburban-style districts, including Kingwood, Clear Lake and South Belt / Ellington, also rank near the top.
The City of Houston neighborhood data released in 2026 provides separate tables for age, race, housing, income, rent, education and household structure.
Employment and Unemployment Rates
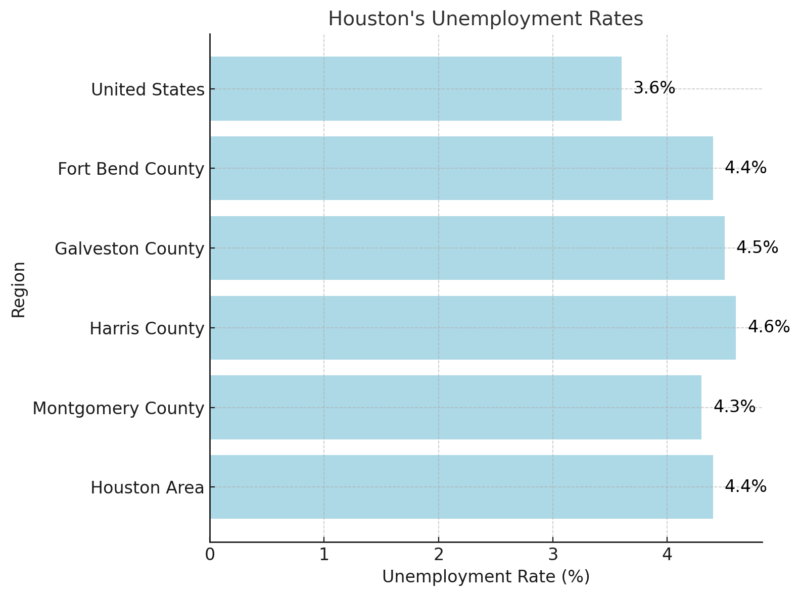
- Houston unemployment rates from the earlier report
The chart above shows the earlier labor-market snapshot. The latest Houston economic summary reported approximately 3.508 million nonfarm jobs in May 2026.
Total employment increased by 21,300 jobs over 12 months, a gain of 0.6%. The metro unemployment rate reached 4.6%, compared with 4.2% one year earlier.
| Industry | Employment in May 2026 | Annual Change | Percentage Change |
|---|---|---|---|
| Total nonfarm employment | 3,507,700 | +21,300 | +0.6% |
| Trade, transportation and utilities | 696,400 | +200 | 0.0% |
| Professional and business services | 573,500 | +7,000 | +1.2% |
| Education and health services | 474,800 | +6,500 | +1.4% |
| Government | 471,200 | +1,400 | +0.3% |
| Leisure and hospitality | 375,100 | +900 | +0.2% |
| Construction | 266,700 | +12,100 | +4.8% |
| Manufacturing | 240,200 | -1,300 | -0.5% |
| Financial activities | 175,700 | -2,900 | -1.6% |
| Mining and logging | 72,700 | -2,800 | -3.7% |
| Information | 27,400 | -1,200 | -4.2% |
Construction produced the largest percentage increase, adding 12,100 jobs. Professional services and education and health services also expanded.
Mining and logging, financial activities, information and manufacturing recorded annual declines. The mix shows that Houston continues to create jobs outside the traditional energy industry, although energy-related employment remains economically important.
A growing population and expanding construction sector also bring more vehicles, job sites and commercial activity. Readers examining Houston personal injury trends should distinguish between broad population growth and the separate legal data involving traffic, workplace and insurance cases.
Average Weekly Wages
Average weekly wages across the Houston area reached $1,689 in the fourth quarter of 2025. The national average was $1,569.
The regional advantage reflects the concentration of higher-paying work in energy, engineering, petrochemicals, construction management, healthcare and professional services.
Average hourly pay across all Houston occupations was $32.51 in May 2025, compared with $33.54 nationally. Individual occupations vary widely, and higher regional weekly earnings can also reflect working hours and the local industry mix.
Employment by Industry
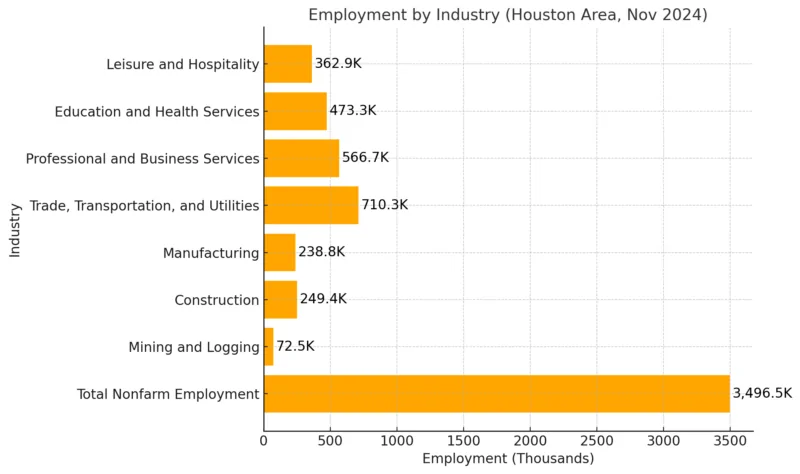
- Houston employment by industry from the earlier report
The updated data show that trade, transportation and utilities remains the largest major employment sector, supporting almost 700,000 jobs.
Professional and business services employs more than 573,000 people. Education and health services supports almost 475,000, a figure connected with the Texas Medical Center, universities, schools and the wider healthcare network.
Construction was the strongest major sector by annual growth rate in May 2026. New homes, industrial sites, roads, warehouses and commercial projects continue to support regional hiring.
Consumer Prices
Houston consumer prices increased 2.8% during the 12 months ending in April 2026. Food prices rose 3.6%, while energy prices increased 17.6%.
The energy increase marked a major change from the decline recorded in the earlier chart. Fuel, electricity and utility prices can move quickly, so annual comparisons may shift sharply between reporting periods.
Average Annual Household Spending
| Spending Category | Houston Area, 2023-2024 | United States |
|---|---|---|
| Total annual spending | $85,377 | $77,907 |
| Housing | $28,976 | $25,853 |
| Transportation | $16,931 | $13,278 |
| Food | $10,469 | $10,077 |
| Healthcare | $5,692 | $6,195 |
| All other spending | $23,309 | $22,504 |
Houston households spent more than the national average, mainly because of higher housing and transportation costs.
The transportation gap reflects the size of the metropolitan area and the continued importance of personal vehicles for work, shopping and daily errands.
Employer Costs per Hour Worked
Private-industry compensation in the West South Central region reached $40.64 per hour in March 2026, compared with $46.60 nationally.
Regional wages and salaries averaged $28.97 per hour. Benefits accounted for another $11.67. Both figures remained below the national averages of $32.60 in wages and $14.01 in benefits.
Educational Attainment
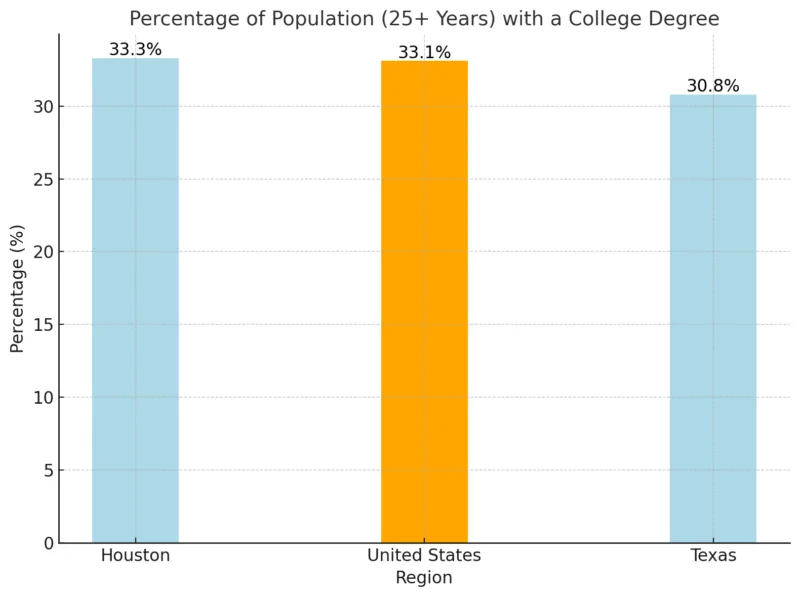
- Among Houston residents age 25 and older, 80.4% have completed high school or a higher level of education. Another 36.6% hold a bachelor degree or higher.
The citywide percentage hides major differences between neighborhoods. Areas near major employment centers and universities have very high college-completion rates, while several lower-income districts have much larger shares of residents without a high school diploma.
Science, Engineering and Related Degrees
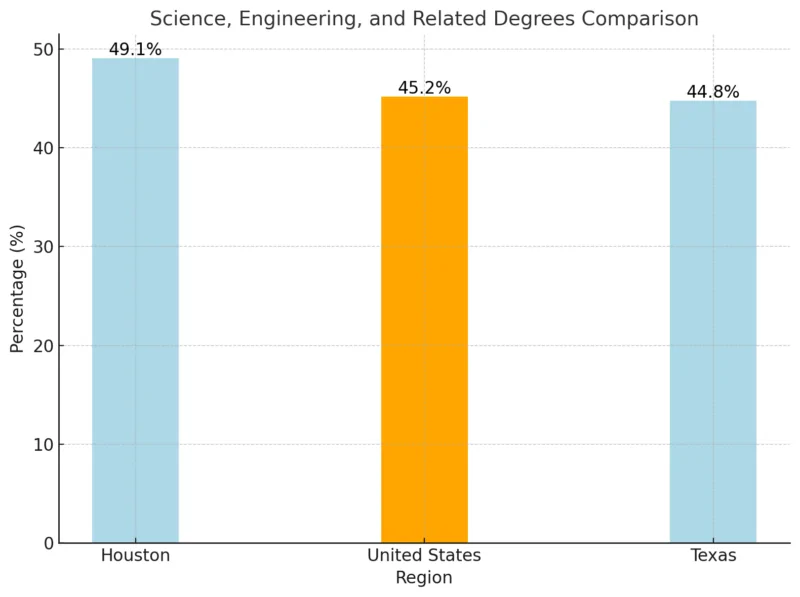
- Science and engineering degree comparison from the earlier report
The earlier chart shows the strong role of science and engineering among Houston college graduates. That pattern remains consistent with the local economy, which depends on engineers, healthcare specialists, energy professionals, researchers, aerospace workers and technical managers.
The newest citywide education benchmark is the 36.6% bachelor degree rate. The subject studied by degree holders comes from a different ACS table and should not be confused with the percentage of all adults holding a degree.
Houston Housing Market in 2026
| Housing Market Metric | May 2026 Figure | Annual Change |
|---|---|---|
| Median sale price | $349,791 | +1.4% |
| Homes sold | 5,466 | -1.1% |
| Median days on market | 46 days | 7 days longer |
| Median price per square foot | $179 | -3.2% |
| Market competition score | 51 out of 100 | Somewhat competitive |
The Houston housing market data for 2026 show moderate price growth and slower sales.
The median sale price increased to $349,791, but homes took about 46 days to sell. The number of completed sales declined slightly.
Typical homes sold for around 3% below their asking price. Highly competitive properties could still sell near the listed price and receive an accepted offer in about 12 days.
Houston home prices remained approximately 10% below the national median. The broader cost of living was estimated to be around 7% below the national average.
The video above presents the market outlook published for 2025. The table immediately above contains the newer 2026 sales figures.
Houston Income and Housing Statistics
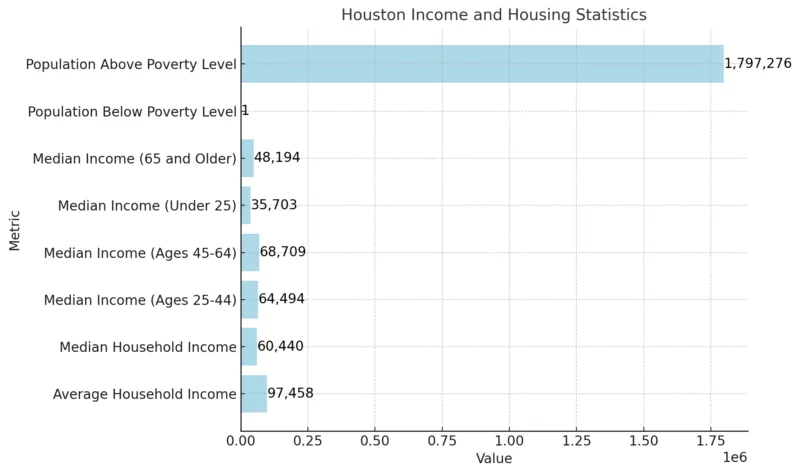
Income or Housing Measure Latest Figure Available in 2026 Median household income $64,813 Income per person $42,430 Residents living below the poverty line 19.9% Households 930,404 Owner-occupied housing rate 42.1% Renter-occupied housing rate 57.9% Median owner-occupied home value $277,800 Median monthly owner cost with a mortgage $2,240 Median monthly owner cost without a mortgage $685 Median gross rent $1,361
Renters occupy almost 58% of Houston homes, making rental housing a central part of the city market.
The Census median home value of $277,800 differs from the Redfin sale price because the two figures measure different things. Census data cover estimated values reported for owner-occupied homes over a multiyear period. Redfin tracks properties that were actually sold during a recent market period.
What Is Driving Houston Population Growth?
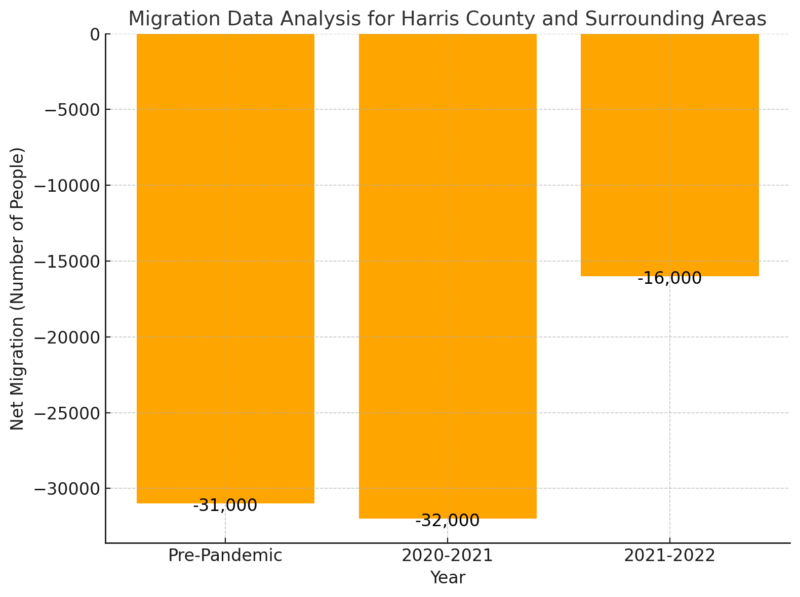
- Earlier migration patterns for Harris County and surrounding areas
The newest metro figures show that growth came from international migration, domestic migration and natural population increase.
| Source of Metro Population Growth | Residents Added | Share of Reported Growth |
|---|---|---|
| International migration | 71,903 | 56.5% |
| Natural increase, births minus deaths | 48,002 | 37.7% |
| Domestic migration | 7,308 | 5.7% |
International migration supplied the largest share of new residents. The category includes immigrants, refugees, foreign workers, international students, returning U.S. citizens and other people moving into the region from outside the country.
Domestic migration remained positive, but it slowed sharply from the previous year. The metro still gained more residents through total migration than any other major U.S. metropolitan area.
The 10-county region recorded approximately 97,000 births and 49,000 deaths, producing a natural increase of 48,002 residents.
Population Growth Across the 10-County Houston Metro
| County | Population | Residents Added in One Year | Growth Rate |
|---|---|---|---|
| Harris | 5,045,026 | 48,695 | 1.0% |
| Fort Bend | 975,191 | 24,163 | 2.5% |
| Montgomery | 781,194 | 30,011 | 4.0% |
| Brazoria | 419,080 | 7,664 | 1.9% |
| Galveston | 372,207 | 4,840 | 1.3% |
| Liberty | 121,364 | 5,073 | 4.4% |
| Waller | 69,858 | 3,761 | 5.7% |
| Chambers | 57,594 | 1,606 | 2.9% |
| Austin County | 33,625 | 747 | 2.3% |
| San Jacinto | 29,488 | 160 | 0.5% |
| Metro total | 7,904,627 | 126,720 | 1.6% |
The regional population analysis released in 2026 shows that all 10 metro counties gained residents.
Harris County added the most people. Waller, Liberty and Montgomery recorded the fastest percentage growth, showing that expansion continues to spread farther from the urban core.
The pattern follows a familiar metropolitan trend. Central counties hold most existing residents and jobs, while outer counties have more undeveloped land for subdivisions, warehouses, roads and commercial centers.
Houston also exchanges residents with other large Texas regions. We also track population changes in San Antonio, Austin and Dallas, three metros that remain closely connected to Houston through work, education and family migration.
Methodology
- The Houston city population comes from the U.S. Census Bureau Vintage 2025 population estimate released in 2026.
- The metro and county figures use the 10-county Houston-Pasadena-The Woodlands metropolitan definition.
- Age, race, income, education, housing and household figures use Census Bureau population estimates and 2020-2024 American Community Survey data.
- Super neighborhood figures come from City of Houston demographic tables released in January 2026.
- Employment, unemployment, wages, prices and spending data come from the U.S. Bureau of Labor Statistics.
- Housing sale prices and market activity use Redfin data for the three-month period ending in May 2026.
- Older charts and social embeds were retained from the original article and are identified as historical where their reporting periods differ from the updated text.
- Population estimates may be revised when the Census Bureau releases a new annual vintage.
Final Thoughts
Houston enters 2026 with 2,397,315 residents inside the city and 7,904,627 across the wider metro. The region added more people than any other major U.S. metropolitan area, but the growth is no longer concentrated in one place.
Harris County remains the population center, while faster expansion in Montgomery, Fort Bend, Waller and Liberty counties continues to push the Houston region outward.
The numbers confirm that Houston is still growing rapidly, but they also show a city facing the practical cost of that success through heavier infrastructure demands, longer housing searches and greater pressure on public services.