With a population of 9,320,860, the state remains the most densely populated in the country as per World Population Review notes.
This bustling region has experienced a steady increase in its population, reflecting both natural growth and migration patterns.
In recent years, New Jersey has seen fluctuations influenced by factors like housing availability and economic opportunities.
These changes are visible in the population trends of its 21 counties, some of which have shown growth while others face declines.
Table of ContentsKey Takeaways
Density and Urbanization Trends

New Jersey, located on the northeastern edge of the United States, borders the Atlantic Ocean to the south. In the last nationwide census in 2010, New Jersey’s population was recorded at 8,791,894, marking a 4.5% increase since the 2000 census.
The most recent estimates from July 2015 place New Jersey’s population at 8,958,013, making it the 11th most populous state in the country, despite being the 47th in size.
New Jersey efficiently utilizes its 8,721 square miles (22,608 square kilometers), ranking as the fourth-smallest state, larger only than Connecticut, Delaware, and Rhode Island.
Although compact, New Jersey holds a significant place in the nation’s history and packs a large population into its small area.
With an average of 1,195.5 residents per square mile, New Jersey is the most densely populated state in the U.S. It’s also unique as every county in the state is designated “urban” by the Census Bureau.
Population by County
County
Population
Population Growth Rate (%)
Area (sq. mi)
Population Density (per sq. mi)
Bergen County
961,932
0.86%
90
4,128
Middlesex County
866,152
0.55%
119
2,803
Essex County
852,510
-0.87%
49
6,766
Hudson County
708,563
-1.84%
18
15,404
Ocean County
662,731
3.8%
242
1,055
Monmouth County
641,370
-0.23%
181
1,370
Union County
575,035
0.24%
40
5,583
Camden County
529,743
1.27%
85
2,397
Morris County
517,627
1.81%
178
1,123
Passaic County
513,156
-1.96%
72
2,759
Burlington County
472,233
2.29%
308
591
Mercer County
382,563
-1.01%
86
1,708
Somerset County
350,637
1.71%
117
1,161
Gloucester County
310,079
2.48%
124
963
Atlantic County
275,044
0.31%
215
495
Cumberland County
153,305
-0.27%
186
317
Sussex County
146,689
1.93%
200
283
Hunterdon County
130,561
1.38%
165
305
Warren County
111,601
1.9%
138
313
Cape May County
93,815
-1.29%
97
372
Salem County
65,519
1.05%
128
197
New Jersey’s population with Bergen County ranks as New Jersey’s most populous county with 961,932 residents, growing by 3.35% since the 2010 census, despite having no major cities.
Other large counties with populations exceeding 500,000 include Middlesex (866,152), Essex (852,510), Hudson (708,563), Monmouth (641,370), and Ocean (662,731) according to the source.
Among these, Monmouth County has experienced a slight population decline, while Hudson County has shown the most significant growth since the census, increasing by 6.36%.
Counties with Smaller Populations in New Jersey
Most New Jersey counties seeing population growth, but some northern counties dropped https://t.co/rSoWCIZbc9
— NorthJersey.com (@northjersey) March 30, 2024
New Jersey has only two counties with fewer than 100,000 residents. Salem County, the least populated, has 65,519 residents, experiencing a 5.11% decline since the last census.
The next smallest, Cape May County, has 93,815 residents and has seen a 4.79% population decrease.
In the 12 counties with populations under 500,000, most have experienced population declines, with only four showing growth.
Rapidly Growing Counties in New Jersey
Hudson County leads New Jersey in population growth, rising 6.36% to reach 708,563 residents.
Ocean County follows with a growth rate of 4.17%, while Union and Bergen Counties have also grown significantly at rates of 3.83% and 3.35%, respectively.
These counties reflect the most rapid population increases within the state, emphasizing their expanding communities and likely economic growth.
Median Age
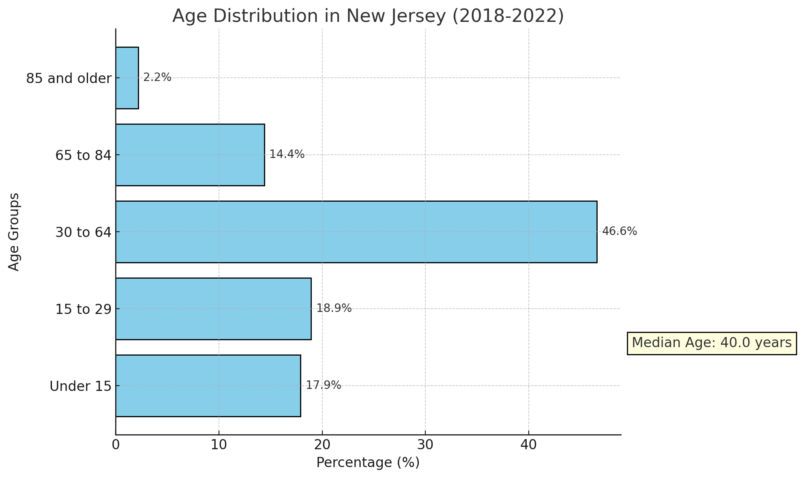
New Jersey population has a median age of 40.0 years, as reported by the 2018-2022 American Community Survey (ACS) 5-Year Estimates.
In terms of age distribution, 17.91% of the population is under 15 years old, 18.93% falls within the 15 to 29 range, 46.60% is between 30 and 64, 14.39% is aged 65 to 84, and 2.17% is aged 85 and older.
Age Distribution
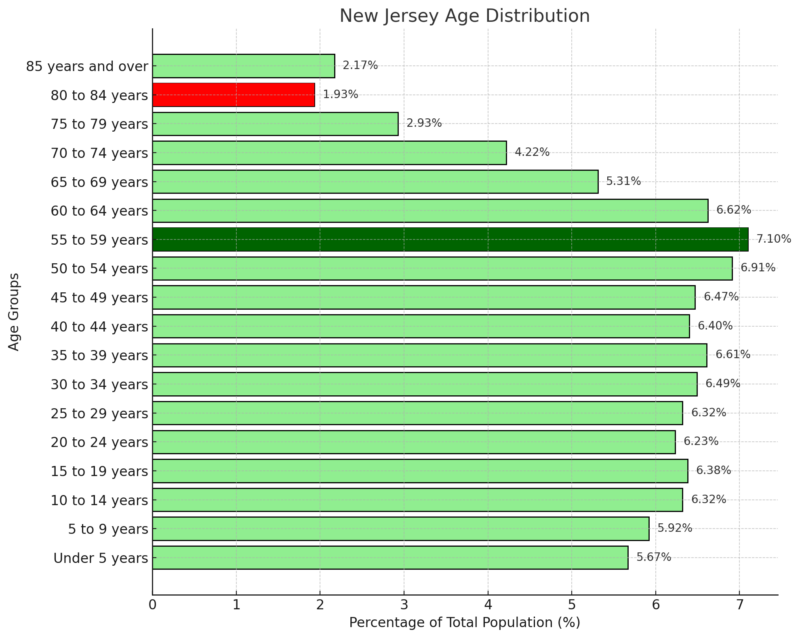
Population by Age Cohort
To understand the age demographics better, New Jersey’s population is divided into three main cohorts:
- Children (Under 18 years): 2,015,561 individuals, making up 21.79% of the population.
- Adults (18 to 64 years): 5,700,888 individuals, accounting for 61.64%.
- Seniors (65 years and over): 1,532,614 individuals, or 16.57%.
In New Jersey, 21.79% of residents are under 18, just slightly below the national figure of 22.11%.
The working-age population (18 to 64) is 61.64%, nearly identical to the U.S. average of 61.36% according to Neilsberg.
For seniors aged 65 and older, New Jersey’s 16.57% closely matches the national average of 16.53%.
Dependency Ratios
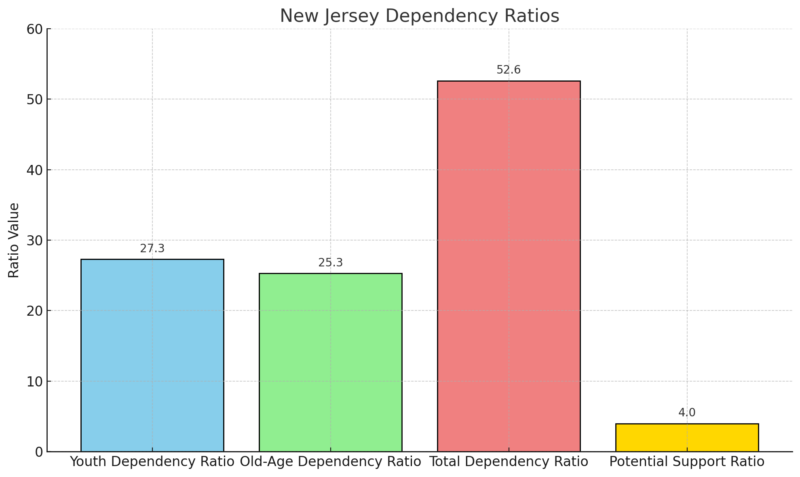
New Jersey population pyramid provides insights into the state’s age structure.
- Youth Dependency Ratio: 27.3, indicating 27.3 children (ages 0-14) per 100 working-age individuals (ages 15-64).
- Old-Age Dependency Ratio: 25.3, reflecting 25.3 seniors (65+) per 100 working-age individuals.
- Total Dependency Ratio: 52.6, indicating the number of dependents (youth and seniors) per 100 working-age individuals.
- Potential Support Ratio: 4.0, showing four working-age individuals for every senior, suggesting a balanced support system for the elderly.
Youth and Senior Populations
New Jersey’s population under 15 years old comprises 17.91% of the total demographic. This segment highlights future generational development and potential educational and family support needs. Planning for schools and resources is crucial due to this demographic’s size.
The senior population, those aged 65 and older, accounts for 16.56%, indicating an aging demographic requiring varied healthcare and retirement services. A portion of this group, 2.17%, consists of individuals aged 85 or older, emphasizing the necessity for specialized eldercare services.
Ethnic and Racial Composition
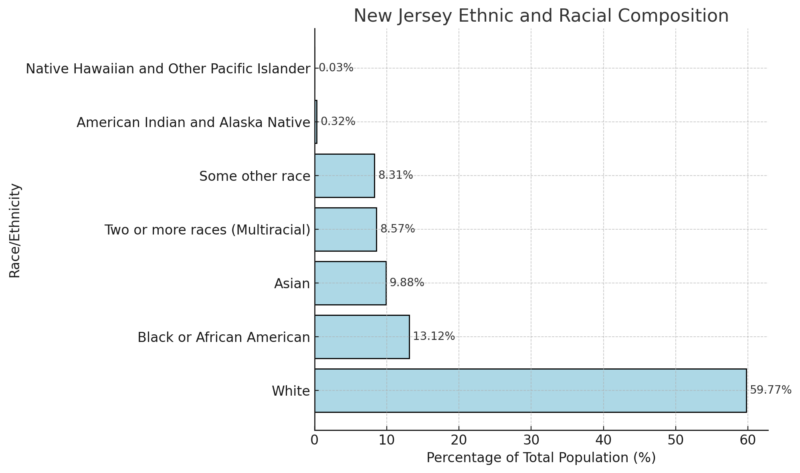
- Neilsberg notes that white residents make up the majority in New Jersey, comprising 59.77% of the population, reflecting a dominant demographic presence across the state.
- Black or African American individuals represent 13.12% of the population, while Asians make up 9.88%, highlighting significant diversity within the state.
- Those identifying as two or more races constitute 8.57%, and 8.31% identify as “Some other race,” showing a sizable population identifying beyond singular racial categories.
- American Indian and Alaska Native individuals represent a smaller portion at 0.32%, and Native Hawaiian and Other Pacific Islander populations are minimal, making up only 0.03% of the state’s demographic.
Income Levels and Distribution
Income Statistic
New Jersey
United States
Average Household Income
$135,170
$105,833
Median Household Income
$97,126
$75,149
Poverty Threshold
$27,750
$27,750
Average Salary for Full-Time Workers
$99,118
N/A
Median Salary for Full-Time Workers
$71,151
N/A
Average Income per Person (Per Capita)
$50,995
N/A
Median Income for Single-Person Households
$46,651
N/A
Average Family Income
$158,765
N/A
Median Family Income
$119,240
N/A
Average Retirement Income
$59,280
N/A
Retirement Income from Retirement Accounts
$34,883
N/A
Social Security Income
$24,397
N/A
New Jersey’s average household income in 2025 is $135,170, which is 28% higher than the national average of $105,833. The median household income in New Jersey is also notably higher at $97,126, compared to the U.S. median of $75,149 as per Incomebyzipcode notes.
New Jersey’s average salary for full-time workers is $99,118, with a median of $71,151, indicating strong wage levels in the state. Individual income (per capita) in New Jersey is $50,995, which tends to be lower than household or family incomes since it includes children and non-working individuals.
The average teacher in NJ made $81,102 last year. That figure is more than $10,000 higher than the national average of $69,544. https://t.co/kIM6Vo6kOX
— Daily Record (@dailyrecord) May 7, 2024
For families, the average income is $158,765, with a median of $119,240, suggesting that family households generally have higher earnings due to multiple earners. In retirement, New Jersey residents receive an average total retirement income of $59,280, split between $34,883 from retirement accounts and $24,397 from Social Security.
Rank
Zip Code
Population
Mean Income
Median Household Income
1
07078
14,287
$486,153
$250,001
2
07423
4,234
$387,818
$250,001
3
07760
9,613
$356,022
$201,534
4
07620
1,449
$352,198
$228,194
5
07021
2,290
$343,062
$247,000
6
07458
11,676
$335,763
$233,669
7
07704
6,221
$330,233
$229,643
8
07046
4,499
$327,082
$250,001
9
07931
3,399
$324,203
$155,703
The wealthiest zip code in New Jersey is 07078, with an average household income of $486,153 and a median household income exceeding $250,001, reflecting a high concentration of wealth in this area.
Following closely, zip codes like 07423 and 07760 also report mean incomes above $350,000.
Zip codes 07078, 07423, and 07021 show particularly high incomes, with medians at or above $250,001.
This data underscores the significant income disparity within New Jersey, with affluent areas primarily in select zip codes.
Overall, these affluent zip codes demonstrate the high earning potential in specific regions of the state, particularly in areas known for luxury housing and higher property values.
Employment Sectors and Unemployment Rates in 2024
Data Series
Apr 2024
May 2024
June 2024
July 2024
Aug 2024
Sept 2024 (p)
Civilian Labor Force (in 1,000s)
4,824.2
4,821.2
4,829.3
4,840.1
4,849.8
4,846.7
Employment (in 1,000s)
4,598.1
4,597.3
4,606.9
4,614.1
4,618.4
4,617.6
Unemployment (in 1,000s)
226.1
223.9
222.3
226.0
231.4
229.1
Unemployment Rate (%)
4.7
4.6
4.6
4.7
4.8
4.7
From April to September 2024, New Jersey’s civilian labor force saw slight fluctuations, increasing from 4,824.2 thousand in April to a peak of 4,849.8 thousand in August, before a marginal drop to 4,846.7 thousand in September.
Employment numbers show a similar slight upward trend, reaching 4,617.6 thousand by September according to BLS.
Unemployment rose slightly from 226.1 thousand in April to 229.1 thousand in September, while the unemployment rate ranged from 4.6% to 4.8%, peaking in August before returning to 4.7% in September.
These small changes reflect a relatively stable labor market, with minor increases in labor force participation and employment over this period.
Educational Attainment
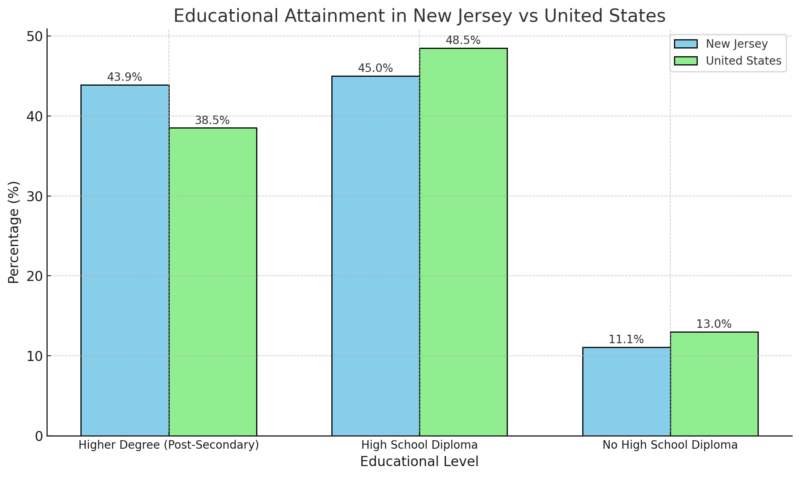
Statistical Atlas notes that in New Jersey, 43.9% of adults aged 25 and older hold a post-secondary degree (Bachelor’s, Master’s, Professional, or Doctorate), which is 13.9% higher than the U.S. average of 38.5%.
Meanwhile, 45.0% of New Jersey residents have a high school diploma as their highest level of education, slightly below the national average of 48.5%.
The percentage of residents without a high school diploma is also lower in New Jersey (11.1%) compared to the national figure of 13.0%, a difference of -14.7%.
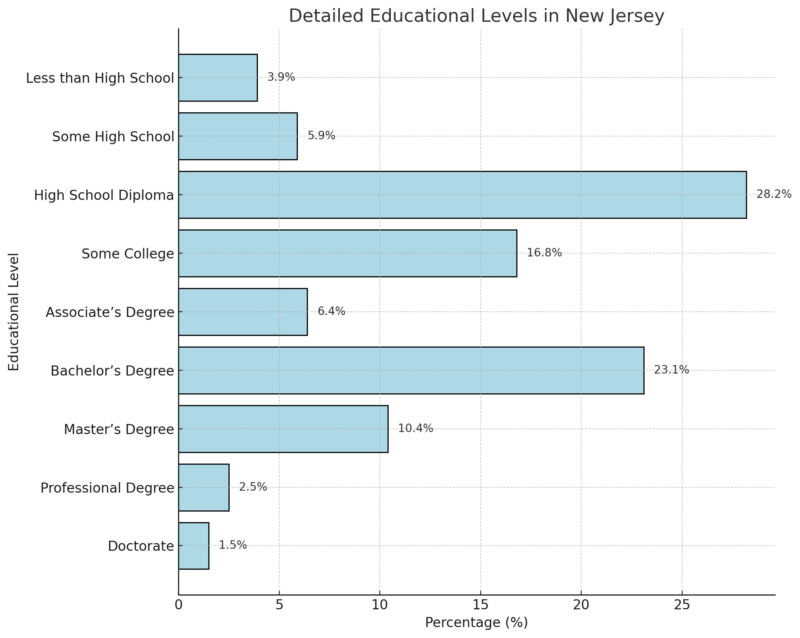
- Bachelor’s Degree holders make up 23.1% of New Jersey’s population over 25, while Master’s Degree holders constitute 10.4%.
- The state also has a professional degree attainment of 2.5% and a doctorate level of 1.5%.
- Associate’s degree holders represent 6.4% of the population, and an additional 16.8% have attended some college but did not obtain a degree.
Housing Market in New Jersey
New Jersey Housing Market Metric
Value
Date
Average Home Value
$531,783
September 30, 2024
1-Year Home Value Change
+8.4%
September 30, 2024
Median Sale Price
$500,917
September 30, 2024
Median List Price
$534,933
October 31, 2024
For Sale Inventory
21,691
October 31, 2024
New Listings
7,782
October 31, 2024
Median Sale-to-List Ratio
1.020
September 30, 2024
Percent of Sales Over List Price
61.2%
September 30, 2024
Percent of Sales Under List Price
27.5%
September 30, 2024
Median Days to Pending
20 days
October 31, 2024
The New Jersey housing market has seen an 8.4% increase in average home values over the past year, reaching $531,783 as of September 2024 according to Zillow.
Homes go to pending in about 20 days, indicating a relatively fast-moving market. The median sale price is $500,917, while the median list price is slightly higher at $534,933.
A significant 61.2% of homes are selling above the list price, suggesting a competitive market, while 27.5% of sales are below the list price.
The median sale-to-list ratio is 1.020, indicating that homes are generally selling at or slightly above their list prices.
Population Health Metrics
Overall Health of New Jersey Residents
New Jersey Value
U.S. Value
Overall Health Rank for Women
5
N/A
Overall Health Rank for Children
6
N/A
Overall Health Score (Women and Children)
0.572
N/A
Strengths
Low prevalence of multiple chronic conditions, high enrollment in early childhood education, low adverse childhood experiences
Challenges
High housing cost burden for households with children, high prevalence of insufficient sleep among women
New Jersey ranks highly for overall health, with women ranked 5th and children 6th in the U.S.
This favorable ranking is supported by strengths such as low chronic condition prevalence and high early childhood education enrollment.
However, high housing costs and insufficient sleep among women are notable challenges for the state.
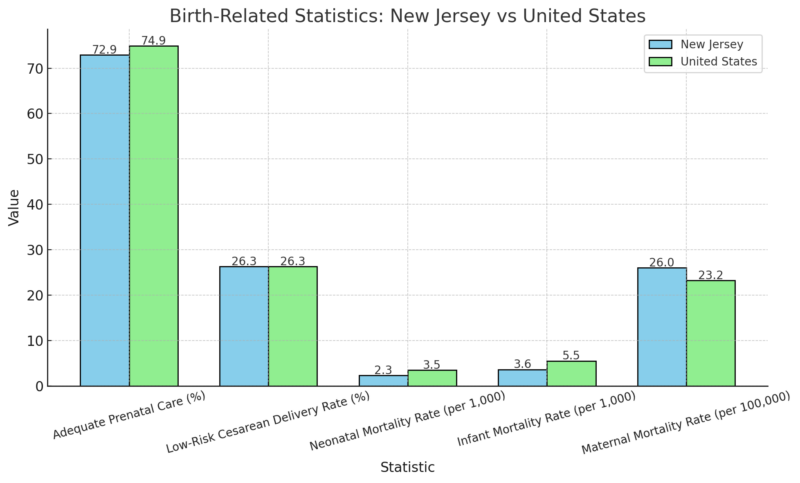
New Jersey performs better than the national average in neonatal and infant mortality rates, with rates of 2.3 and 3.6 per 1,000 live births, respectively, compared to the U.S. rates of 3.5 and 5.5 as per America’s Health Rankings notes in their research.
However, the state’s maternal mortality rate of 26.0 per 100,000 is slightly higher than the national average of 23.2.
While adequate prenatal care is below the national rate, New Jersey meets the national average for low-risk cesarean delivery rates.
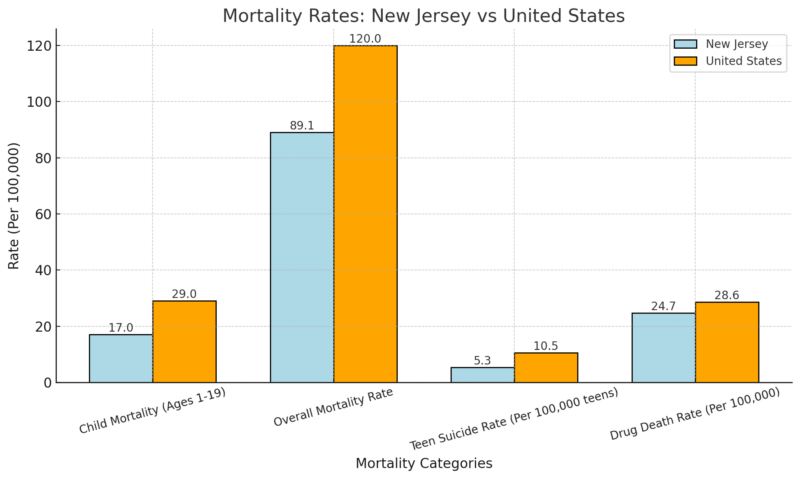
New Jersey exhibits favorable mortality statistics compared to national averages, with a significantly lower child mortality rate (17.0 per 100,000) compared to the national figure of 29.0.
Teen suicide and drug death rates are also lower than national averages, suggesting relatively positive health outcomes for young populations in the state.
The overall mortality rate in New Jersey is 89.1 per 100,000, below the U.S. rate of 120.0, further indicating a generally healthier state population.
| Key Health Outcomes and Behaviors | New Jersey Value | U.S. Value |
|---|---|---|
| High Health Status | 59.5% | 55.1% |
| Obesity Rate | 25.6% | 32.7% |
| Multiple Chronic Conditions | 2.5% | 4.6% |
| Smoking Rate | 8.3% | 11.2% |
| Insufficient Sleep (Women, Ages 18-44) | 38.5% | 36.5% |
New Jersey demonstrates strong health outcomes with a high percentage of residents reporting good health (59.5%) and a lower-than-average obesity rate of 25.6%.
The prevalence of multiple chronic conditions is also notably low at 2.5%, well below the national average of 4.6%.
Smoking rates are comparatively low at 8.3%, while insufficient sleep among women is slightly above the national average, highlighting an area for potential health improvement.
Migration Patterns
Immigrant Statistics in New Jersey
Value
Immigrant Share of Population
23.4%
Immigrant Residents
2,165,700
Immigrant Spending Power
$85.2 billion
Immigrant Taxes Paid
$34.6 billion
Immigrant Share of Labor Force
29.0%
Immigrant Share of Entrepreneurs
34.5%
Immigrant Share of STEM Workers
41.4%
Immigrant Share of Nurses
33.3%
U.S.-born Residents with at Least One Immigrant Parent
13.8%
Number of Immigrant Children
127,200
U.S.-born Residents Living with Immigrant Parent(s)
978,700
Immigrant English Proficiency
76.3%
New Jersey has a significant immigrant presence, with immigrants making up 23.4% of the state’s population.
They are essential contributors to the state’s economy, accounting for 29% of the labor force, 34.5% of entrepreneurs, 41.4% of STEM workers, and 33.3% of nurses.
Immigrants in New Jersey also wield considerable economic influence, with a spending power of $85.2 billion and taxes paid amounting to $34.6 billion.
| Demographics by Age Group | Foreign-Born Population | U.S.-Born Population |
|---|---|---|
| Ages 0-15 | 5.0% | 23.1% |
| Ages 16-64 | 77.0% | 59.7% |
| Ages 65+ | 18.1% | 17.2% |
A substantial 13.8% of U.S.-born residents in New Jersey have at least one immigrant parent, highlighting the integration of immigrant families into local communities.
The immigrant population in New Jersey tends to be of working age, with 77% between 16-64, compared to 59.7% of the U.S.-born population.
| Top Countries of Origin for Immigrants in New Jersey | % of Immigrant Population |
|---|---|
| India | 12.4% |
| Dominican Republic | 9.8% |
| Mexico | 5.2% |
| Ecuador | 4.8% |
| Colombia | 4.4% |
New Jersey’s immigrant community is also diverse, with India, the Dominican Republic, Mexico, Ecuador, and Colombia as the top countries of origin, and a notable 76.3% of immigrants proficient in English.
Future Projections
According to projections, the state’s population is expected to rise by 2.7% from 2025 to 2030, reaching approximately 9,633,566 by 2030. This increase reflects broader demographic trends seen across the nation.
Several factors contribute to this growth, including immigration and birth rates. In particular, urban areas and certain counties are anticipated to be the primary contributors to these population gains.
A report indicates that 11 out of 21 counties in New Jersey are projected to continue population growth from 2023 to 2028. This growth is not uniform, with areas of both growth and decline within particular counties.
Methodology
To gather the data for this article, we utilized a combination of recent government publications, including the 2018-2022 American Community Survey, reports from the Bureau of Labor Statistics, and World Population Review’s population estimates.
We referenced the U.S. Census Bureau and America’s Health Rankings to analyze demographic, health, and economic factors specific to New Jersey.
Additionally, Zillow’s real estate index provided insights into the state’s housing market trends, while income statistics were gathered from the Census Bureau’s ACS 5-year dataset. Detailed immigration data was sourced from the Migration Policy Institute and other reputable national sources.
This multi-source approach ensured an accurate and comprehensive overview of New Jersey’s current demographic and socioeconomic landscape, allowing us to craft an informative analysis of the state’s growth and key trends.
References
- World Population Review – New Jersey Population 2023
- U.S. Census Bureau – New Jersey State Profile
- Neilsberg – New Jersey Population by Age
- Neilsberg – New Jersey Population by Race
- Incomebyzipcode – New Jersey Income Statistics for 2024
- Bureau of Labor Statistics (BLS) – New Jersey Economy at a Glance
- Statistical Atlas – Educational Attainment in New Jersey
- Zillow – New Jersey Home Values
- America’s Health Rankings – 2024 Health of Women and Children Report
- Aterio – New Jersey Population Forecast
- Esri Story Maps – New Jersey Population Growth by County
Related Posts:
- Closer Look at Ohio’s Population Data for 2025
- Minneapolis Population Growth in 2025 - A Closer Look
- Closer Look at Population of Pennsylvania in 2025
- Texas Population in 2025 - Closer Look at The Demographics
- Teen Depression Statistics in the US - A Closer Look…
- 2016 Births in the US - A Detailed Look at the…


