As of 2025, Delaware’s population stands at approximately 1,044,320, marking a consistent increase from previous years according to World Population Review.
Between 2000 and 2023, the state’s population grew by over 245,000 individuals.
In the 2020 last census, it had 989,948 residents.
Delaware is located in the Mid-Atlantic region of the United States and shares borders with Maryland to the south and west, Pennsylvania to the north, and New Jersey to the east, across the Delaware River.
It is strategically positioned near major metropolitan areas, including Philadelphia, PA, Baltimore, MD, and Washington, D.C., making it a convenient hub for commerce and travel. Table of ContentsKey Takeaways
Demographic Composition
According to the 2018-2022 ACS 5-Year Estimates, Delaware’s median age is 41.4 years.
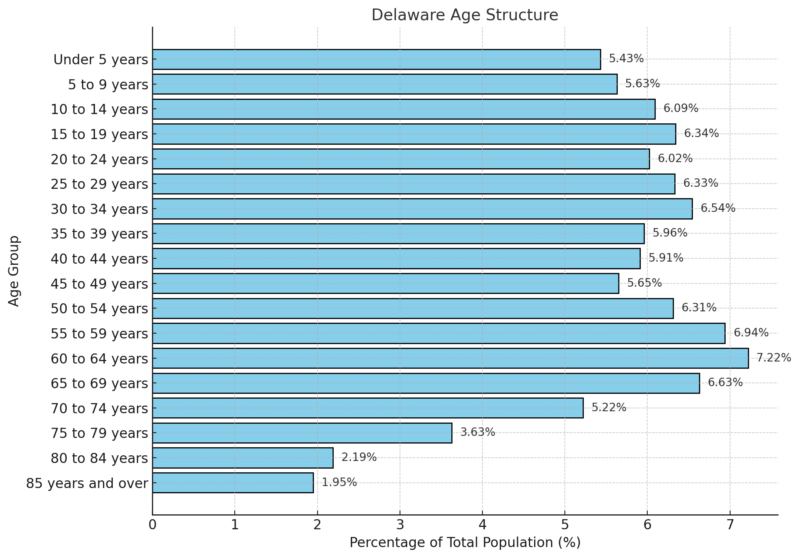
The population distribution shows that 17.15% are under the age of 15, 18.69% are between 15 and 29 years old, 44.53% fall within the 30 to 64 age group, 17.67% are aged 65 to 84, and 1.95% are 85 years or older.
Age Structure
Gender Distribution
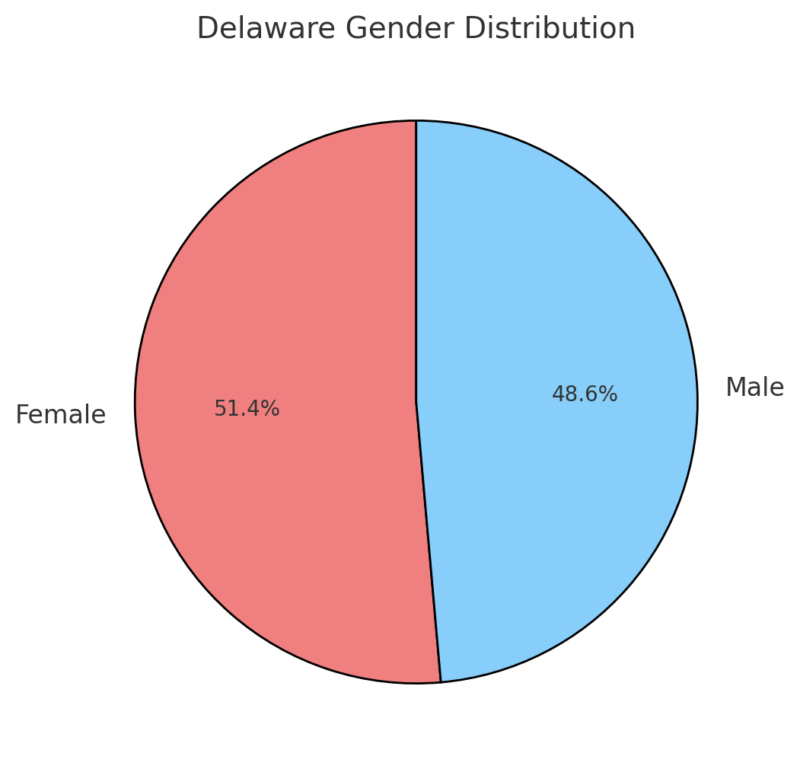
Delaware’s population shows a slight female majority, with 51.4% of the population being female compared to 48.6% male, reflecting a gender ratio of 94.6 males per 100 females, lower than the national average.
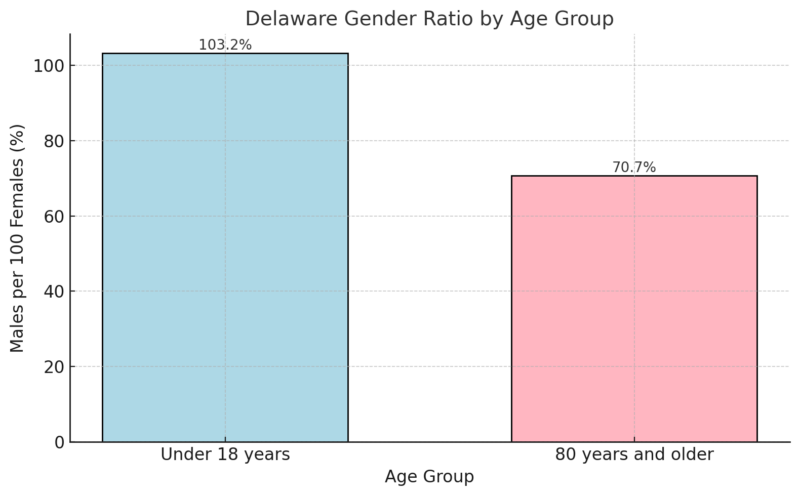
Neilsberg notes that for children under 18 years, males slightly outnumber females (103.2 males per 100 females), but this reverses significantly in the senior population (80+), where there are only 70.7 males per 100 females, highlighting the impact of female longevity. This demographic structure aligns with broader trends in aging populations.
Gender Ratio by Age Group
Racial and Ethnic Diversity
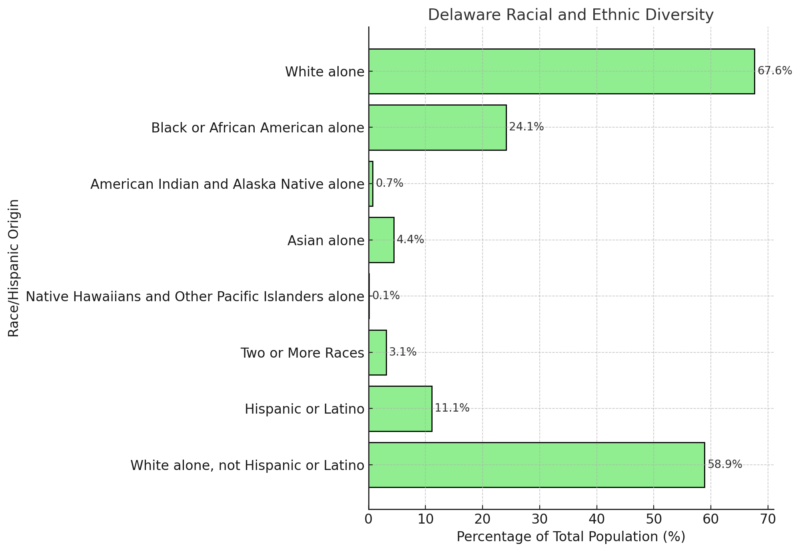
Delaware’s population is predominantly White alone at 67.6%, dropping to 58.9% when excluding Hispanic individuals, showing notable diversity according to the US Census Bureau.
Black or African American residents make up 24.1%, the second-largest group.
Hispanic or Latino individuals represent 11.1%, reflecting a growing presence.
Smaller percentages of Asian (4.4%), American Indian (0.7%), and Two or More Races (3.1%) highlight limited representation of other groups.
Delaware Counties
County
Population (2025)
% of State Population
Population Growth Since 2010
Population Density (persons/sq mi)
New Castle County
581,930
57.83%
3.82%
1,312.11
Sussex County
270,571
23.71%
15.87%
289
Kent County
191,820
18.46%
9.57%
327
WPR notes that Delaware is divided into three counties, with New Castle County being the most populous.
New Castle County has a population of 559,335, accounting for 57.83% of the state’s total, and a population density of 1,312.11 persons per square mile.
Kent County, the least populated of the three, has 178,550 residents, making up 18.46% of Delaware’s population. Sussex County, the second-most populous, has 229,286 people, representing 23.71% of the state’s total.
All three counties are experiencing notable population growth. Sussex County leads with a 15.87% increase since the 2010 Census, followed by Kent County with a 9.57% growth and New Castle County with a 3.82% rise. This growth highlights a statewide trend of steady expansion across all counties.
Education Levels
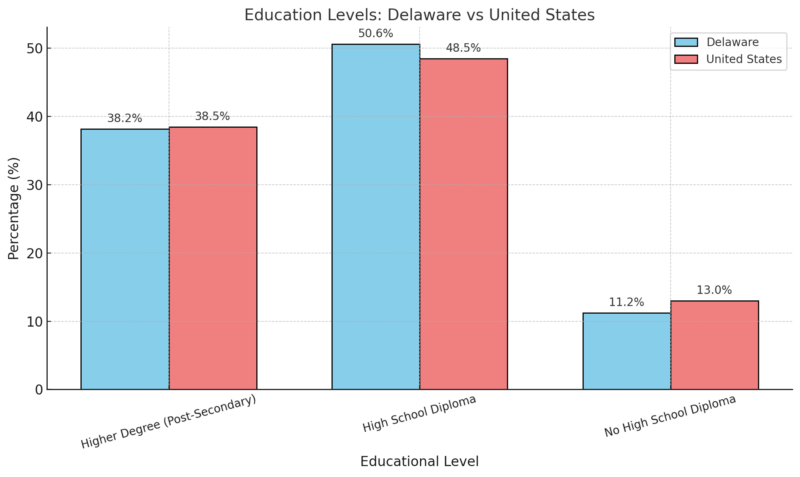
Delaware has slightly fewer residents with higher degrees (-0.7%) than the national average.
However, a higher percentage of its population has a high school diploma (+4.3%), and significantly fewer have no high school diploma (-14.0%) according to Statistical Atlas.
Detailed Educational Attainment in Delaware (Ages 25+)
Educational Level
Delaware (%)
Population Count
Doctorate
1.7%
10.7k
Professional
1.8%
11.7k
Master’s Degree
8.9%
57.2k
Bachelor’s Degree
18.1%
116k
Associate’s Degree
7.7%
49.6k
Some College
19.5%
125k
High School Diploma
31.1%
199k
Some High School
7.4%
47.6k
Less than a High School Diploma
2.7%
17.0k
Most Delaware residents aged 25+ have completed high school (31.1%), with the next largest group attending some college (19.5%).
Bachelor’s degrees account for 18.1%, reflecting a strong emphasis on higher education, though only a small percentage (1.7% to 1.8%) hold advanced degrees like Doctorates or Professional degrees.
Educational Attainment by Gender
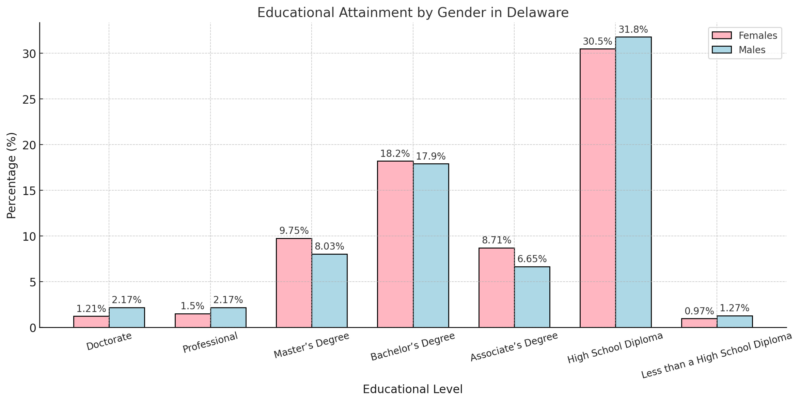
Women in Delaware are more likely to have Master’s (9.75% vs. 8.03%) and Associate’s degrees (8.71% vs. 6.65%), while men are more likely to hold Doctorates (2.17% vs. 1.21%) and Professional degrees (2.17% vs. 1.50%).
High school completion is nearly equal among genders.
Bachelor’s Degree Holders by Age
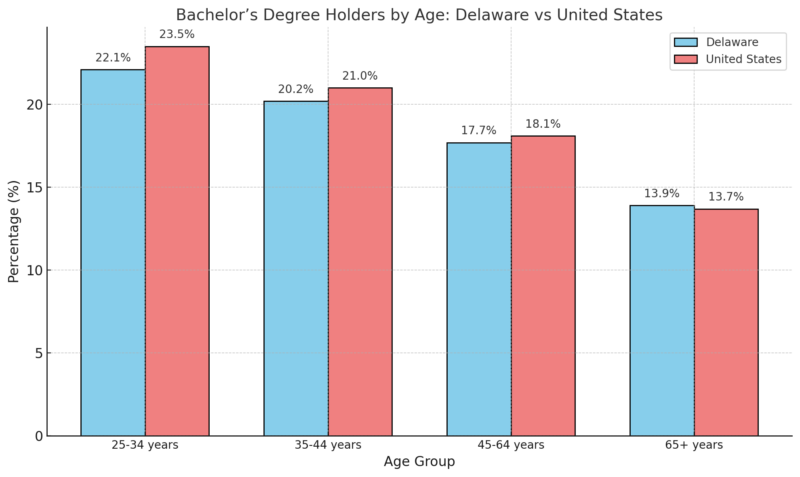
Delaware lags slightly behind the national average for Bachelor’s degree attainment across most age groups, except for the 65+ demographic, where it slightly surpasses the national rate.
Dependency Ratios
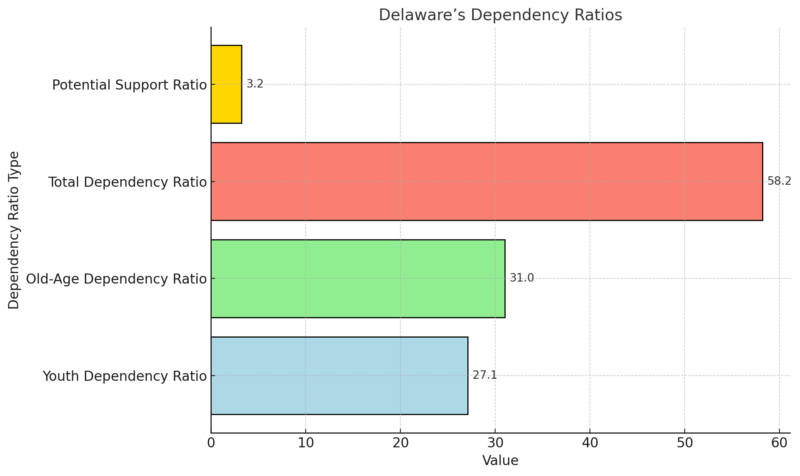
Delaware’s youth dependency ratio (27.1) and old-age dependency ratio (31.0) highlight the balance between working-age individuals and dependents.
The total dependency ratio of 58.2 shows a slightly higher dependency burden compared to some states, with 3.2 working-age individuals supporting each elderly person.
Income Levels
The real median household income in Delaware for 2023 was reported at $86,340 in 2023 dollars, adjusted using the Consumer Price Index for All Urban Consumers (C-CPI-U) according to the Federal Reserve Bank.
This figure represents the midpoint of income distribution, where half of the households earn above this amount and half earn below.
The data is not seasonally adjusted and reflects annual estimates from the U.S. Census Bureau
Employment and Unemployment
Metric
Apr 2024
May 2024
June 2024
July 2024
Aug 2024
Sept 2024 (p)
Civilian Labor Force (in thousands)
506.2
505.5
505.5
505.3
505.1
504.8
Employment (in thousands)
486.5
485.7
485.3
484.5
483.8
483.8
Unemployment (in thousands)
19.8
19.9
20.2
20.9
21.3
21.0
Unemployment Rate (%)
3.9
3.9
4.0
4.1
4.2
4.2
The civilian labor force has seen a small decline from 506.2k in April to 504.8k in September, suggesting a slight reduction in individuals actively participating in the workforce according to BLS.
Employment levels have also declined, from 486.5k in April to 483.8k in September, indicating fewer people were employed over the period.
Delaware’s unemployment meets the national average once again, rising to a rate of 4.2% in August. The labor force has remained over half a million people. #netde #jobs #labor #Delawarehttps://t.co/5pdKnMvpkP pic.twitter.com/f0XEU94cIP
— DelawareBizTimes (@DeBusinessTimes) September 21, 2024
The number of unemployed individuals increased from 19.8k in April to 21.0k in September, reflecting a growing number of job seekers unable to find work.
The unemployment rate rose from 3.9% in April to 4.2% in September, suggesting a gradual softening of the labor market, possibly influenced by broader economic conditions.
Housing Market
Metric
Value
YoY Change
Median Sale Price
$359,400
+8.5%
Number of Homes Sold
676
+5.6%
Median Days on Market
30 days
+7 days
Number of Homes for Sale
2,178
+15.1%
Number of Newly Listed Homes
783
+8.6%
Months of Supply
2 months
No change
Redfin notes that home prices in Delaware increased 8.5% year-over-year, with a median sale price of $359,400, reflecting strong demand and a competitive market.
The number of homes sold rose 5.6%, indicating a healthy level of buyer activity. Despite rising prices, demand remains robust.
Homes lingered slightly longer on the market, with the median days on the market increasing by 7 days to 30 days, suggesting a slight cooling in the pace of transactions.
The number of homes for sale grew 15.1% year-over-year to 2,178, and the number of newly listed homes rose 8.6% to 783.
This increase in supply suggests more options for buyers, helping to balance the market.
Among top metros:
- Dover saw the fastest growth in sales prices (+37.2%).
- Middletown also experienced significant growth (+15.1%).
- Wilmington faced a decline (-4.6%), indicating localized market variations.
Migration Patterns
Metric
Value
Immigrant Share of Population
9.6%
Total Immigrant Residents
98,000
Immigrant Spending Power
$3.6 billion
Immigrant Taxes Paid
$1.1 billion
Immigrant Contributions to Social Security
$452.4 million
Immigrant Contributions to Medicare
$116.5 million
They constitute nearly 10% of Delaware’s population and play a pivotal role in its economy by contributing $1.1 billion in taxes and holding a spending power of $3.6 billion, showcasing their integral role in state finances and consumption according to the American Immigration Council.
Immigrant Demographics by Age Group
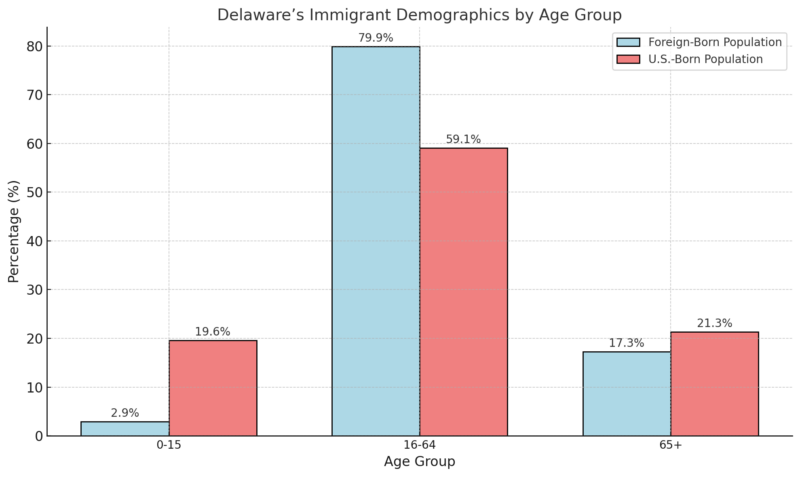
Immigrants are predominantly working-age (79.9% between ages 16-64) compared to the U.S.-born population, emphasizing their significant participation in Delaware’s workforce and economic activity.
Top Countries of Origin for Immigrants
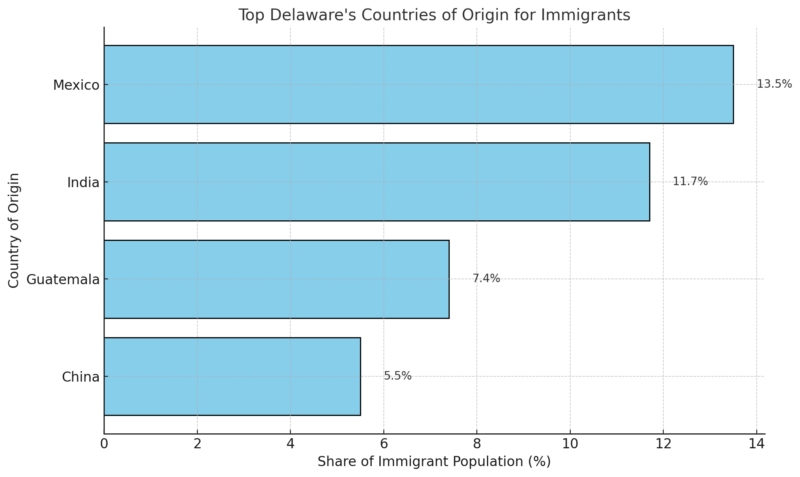
Immigrants from Mexico represent the largest share (13.5%) of Delaware’s foreign-born population, followed by India and Guatemala, reflecting the state’s diverse immigrant demographic.
Educational Attainment of Population Aged 25+ by Nativity
Education Level
Foreign-Born Population (%)
U.S.-Born Population (%)
Less Than High School
17.3
6.3
High School & Some College
41.5
57.7
Bachelor’s Degree
18.5
21.4
Graduate Degree
22.6
14.6
Immigrants have a higher percentage of graduate degrees (22.6%) than their U.S.-born counterparts, underscoring their role in filling high-skilled positions in Delaware’s labor market.
Workforce and Industry Distribution of Immigrants
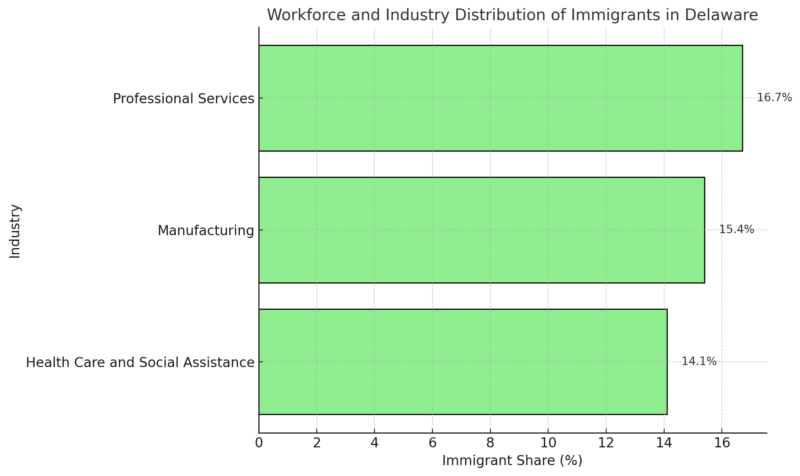
Immigrants make up 12.5% of Delaware’s workforce, with significant representation in key industries like professional services (16.7%) and manufacturing (15.4%), highlighting their critical role in meeting labor demand across diverse sectors.
Health and Wellness Statistics
52% of Delaware’s population (aged 6 months or older) received the seasonal flu vaccine during the 2022-2023 period, highlighting mid-range public participation in preventive healthcare measures.
Public Health Emergency Preparedness
Delaware ranked in the Middle Tier for public health emergency preparedness in 2023, indicating moderate capability in addressing health emergencies compared to other states according to THAF.
Chronic Health Conditions Among Adults
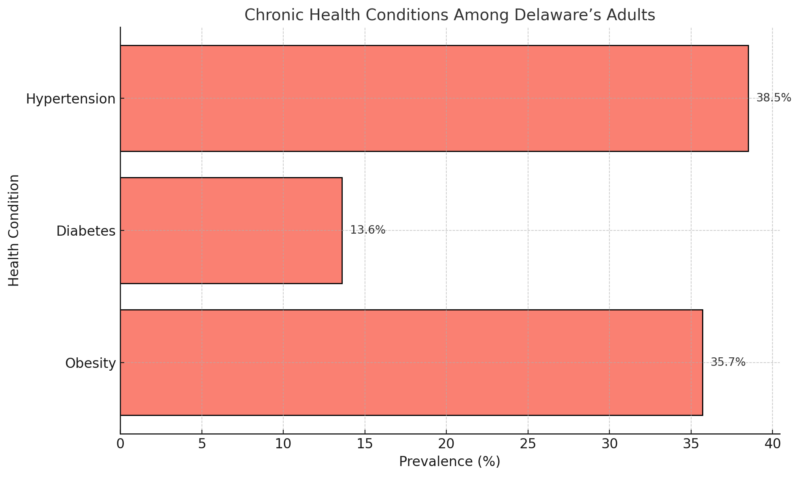
Over one-third of Delaware’s adult population is affected by hypertension (38.5%) and obesity (35.7%), while diabetes affects a smaller yet significant portion (13.6%).
These rates underline the need for enhanced chronic disease prevention programs and access to care.
Childhood Obesity
- 20.5% of children aged 6-17 in Delaware were reported as obese in the 2021-2022 period.
- Trend Analysis: Childhood obesity remains a pressing concern, with rates aligning closely with national trends but requiring targeted interventions to reduce future chronic disease risks.
Deaths Related to Alcohol, Drugs, and Suicide
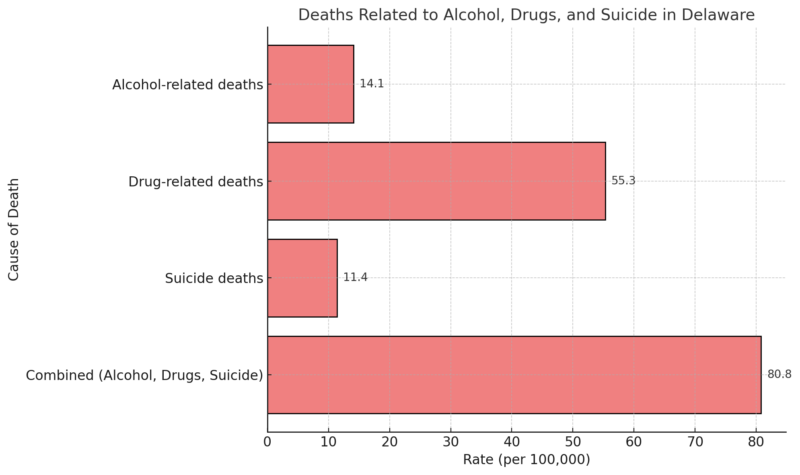
Drug-related deaths account for a significant majority (55.3 per 100,000) of substance-related fatalities, far outpacing alcohol-related (14.1 per 100,000) and suicide deaths (11.4 per 100,000).
Delaware’s rate of 80.8 per 100,000 for deaths tied to alcohol, drugs, and suicide underscores the severity of the substance abuse crisis in the state.
Projected Trends in Death Rates Related to Alcohol, Drugs, and Suicide
Year
Alcohol-related deaths
Drug-related deaths
Suicide deaths
Combined deaths
2005
6.9
7.9
9.8
23.3
2017
10.8
35.6
11.6
57.3
2025 (Projected)
10.7
36.2
15.4
60.4
While alcohol-related death rates are projected to remain stable, drug-related deaths are expected to continue to dominate overall mortality tied to substances, with a slight increase in suicide rates projected by 2025.
Obesity Rates
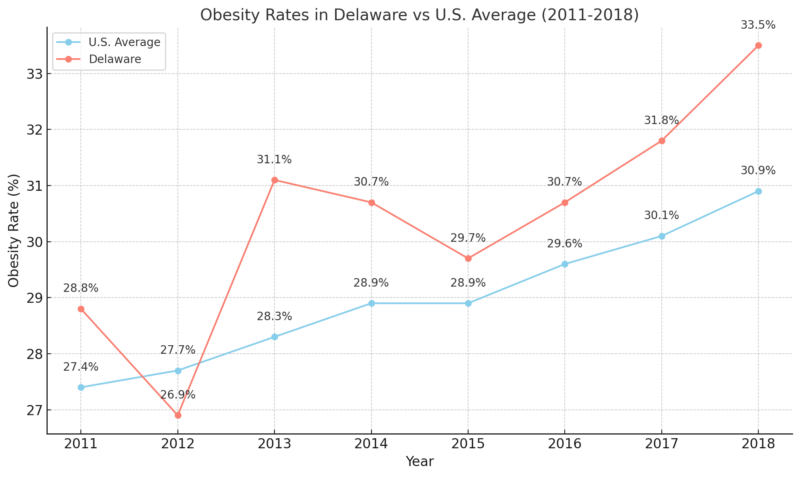
The obesity rate has consistently surpassed the national average since 2013, peaking at 33.5% in 2018.
These rates suggest a persistent public health challenge that requires robust statewide nutrition, fitness, and lifestyle intervention programs.
Crime Rates in Delaware
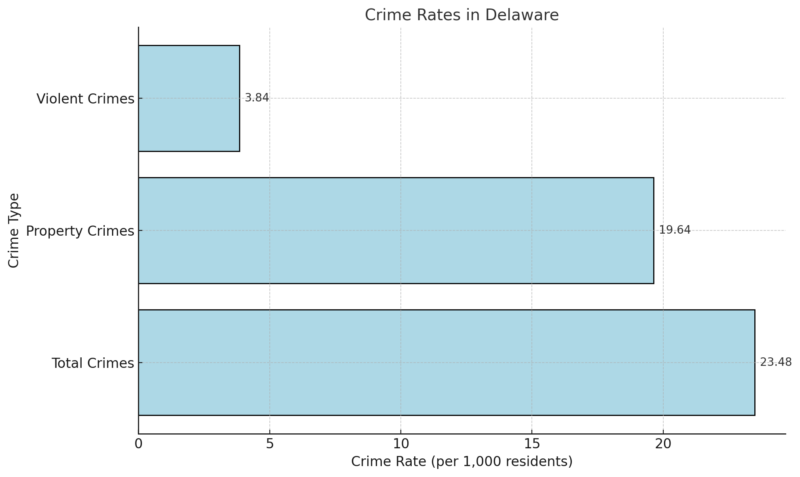
Delaware’s crime rates show a mixed pattern when compared to national averages. While violent crime rates (3.84 per 1,000 residents) are marginally lower than the U.S. average, property crimes, particularly theft (15.91 per 1,000 residents), surpass the national rate as per Neighborhood Scout. Assaults dominate violent crimes, whereas theft makes up the bulk of property crimes.
The relatively higher rate of property crimes can be linked to Delaware’s dense urban areas and accessibility. However, Delaware’s overall violent crime rate remains less severe than the national benchmark, suggesting effective law enforcement measures in deterring more serious offenses.
Violent Crime in Delaware
Crime Type
Total Incidents
Rate per 1,000 Residents
U.S. Rate per 1,000 Residents
Murder
49
0.05
0.06
Rape
224
0.22
0.40
Robbery
580
0.57
0.66
Assault
3,053
3.00
2.68
- Chance of Becoming a Victim of Violent Crime in Delaware: 1 in 261.
- Violent crime rates in Delaware are slightly lower than the national average, with assault being the most prevalent violent crime.
Property Crime in Delaware
Crime Type
Total Incidents
Rate per 1,000 Residents
U.S. Rate per 1,000 Residents
Burglary
2,068
2.03
2.70
Theft
16,204
15.91
14.02
Motor Vehicle Theft
1,730
1.70
2.83
- Chance of Becoming a Victim of Property Crime in Delaware: 1 in 51.
- Theft accounts for the majority of property crimes in Delaware, with a rate higher than the national average.
Delaware’s smaller geographical area compared to other states results in higher crimes per square mile, reflecting population density and urbanization patterns.
Methodology
We gathered population, demographic, economic, health, and crime statistics from trusted sources like the U.S. Census Bureau, American Community Survey, and Redfin.
Analyzed multi-year data to identify trends in areas such as crime rates, economic growth, and public health metrics.
We compared Delaware’s statistics with national averages to provide context and highlight state-specific variations.
We organized the findings into tables and concise narratives to ensure clarity and accessibility for readers.
All data points were cross-referenced with credible reports and methodologies to ensure accuracy and relevance.
References
- World Population Review – Delaware Population
- U.S. Census Bureau – Delaware Profile
- Neilsberg Insights – Delaware Population by Age
- Neilsberg Insights – Delaware Population by Gender
- U.S. Census Bureau QuickFacts – Delaware Racial and Ethnic Composition
- World Population Review – Delaware Counties
- Statistical Atlas – Delaware Educational Attainment
- Federal Reserve Bank – Delaware Real Median Household Income
- Bureau of Labor Statistics – Delaware Employment Overview
- Redfin Housing Market Trends – Delaware Housing Market
- American Immigration Council – Delaware Immigration Contributions
- Trust for America’s Health (THAF) – Delaware Public Health Preparedness
- Neighborhood Scout – Delaware Crime Statistics
Related Posts:
- Connecticut Population in 2025 - Key Demographic…
- Denver Population 2025 - Key Demographic Trends and Insights
- Baltimore Population 2025 - Key Demographic Trends…
- Maui Population 2025 - Current Trends and…
- New Hampshire Population in 2025 - Latest…
- Virginia Beach Population 2025 - Key Trends and Insights


