
Mississippi’s current population in 2025 is approximately 2,940,450 according to the World Population Review.
State is home to a small yet culturally rich segment of the United States’ vast population of over 346 million, making it an intriguing case study in demographic and economic trends.”
The state’s population growth rate is relatively slow at 0.30%, ranking it 40th in the nation.
Mississippi shares its borders with Tennessee to the north, Alabama to the east, Louisiana to the south, and Arkansas to the northwest, with the Mississippi River forming much of its western boundary.
On November 3, 2020, Mississippi residents voted to adopt a new state flag, the “New Magnolia,” replacing the previous flag that featured the Confederate emblem.
Key Takeaways
Population Age Distribution
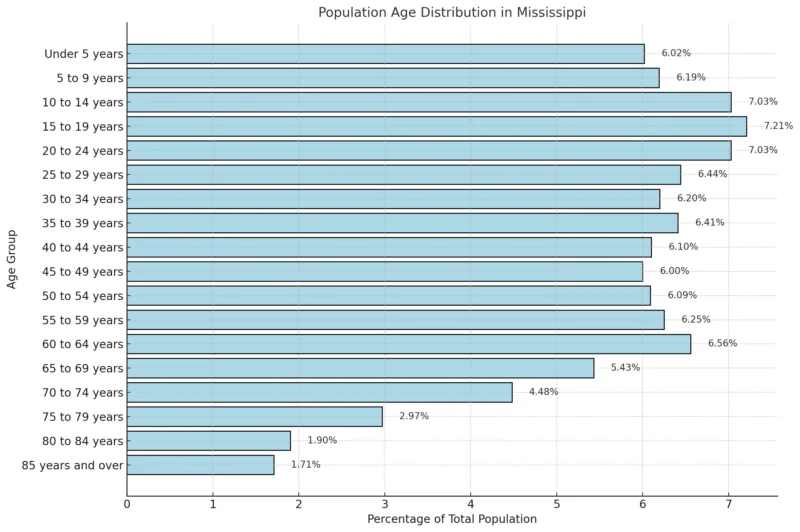
According to 2018-2022 ACS 5-Year Estimates, the median age in Mississippi is 38.1 years. The population is distributed across various age groups, with younger demographics forming a notable portion.
Individuals under 15 years old account for 19.24% of the population, while 20.68% are aged between 15 and 29.
Adults aged 30 to 64 make up the largest group at 43.61%, and the elderly population (65 years and older) constitutes 16.49% of the total population.
Among the elderly, 1.71% are aged 85 and above.
Population by Gender
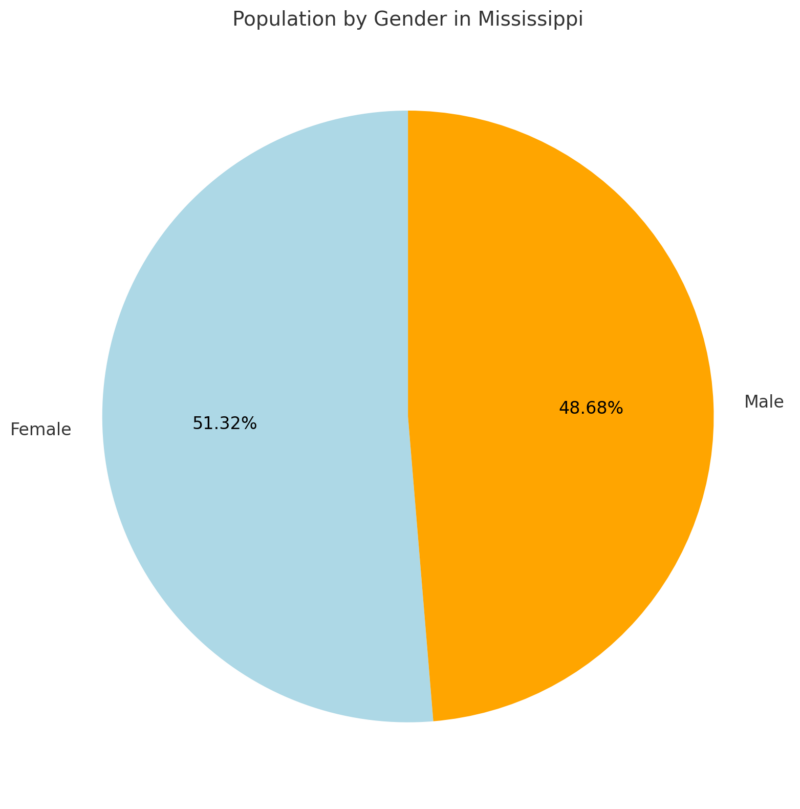
Mississippi has a slightly higher proportion of females compared to the national average. Women make up 51.32% of the state’s population, while men constitute 48.68%.
This results in a gender ratio of 94.8 males for every 100 females. The largest male age group is 10-14 years, while for females, it is 15-19 years.
Mississippi’s Population by Race/Ethnicity
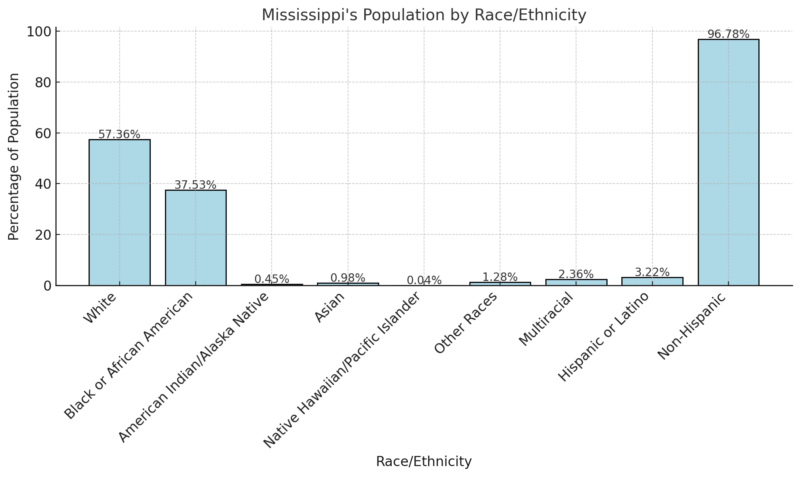
Mississippi’s population is predominantly White, accounting for 57.36% of the residents, followed by 37.53% Black or African American according to the Neilsberg article.
Other racial groups, including Asian, American Indian, and multiracial individuals, form a smaller but growing part of the population.
Hispanic or Latino individuals make up 3.22% of the population, with the remaining 96.78% identifying as Non-Hispanic.
Mississippi County Population 2025
Mississippi has 82 counties, with Hinds County being the most populous, housing 237,085 residents and including the state capital, Jackson. Despite this, Hinds County’s population has declined by 3.52% since 2010. Harrison County (206,650 residents) and DeSoto County (182,001 residents) follow, with DeSoto being the most densely populated county and experiencing 12.50% growth since 2010. Issaquena County is the least populated with 1,308 residents, followed by Sharkey County (4,377) and Quitman County (7,051). These counties have seen significant population declines, with Quitman shrinking the most at 13.57%. Lafayette County has grown the most since 2010, with a 15.19% increase. Other rapidly growing counties include DeSoto, Lamar, Madison, and Harrison, all experiencing double-digit growth.
County Name
Population
County Name
Population
Hinds County
212,185
Harrison County
210,781
DeSoto County
195,350
Rankin County
161,856
Jackson County
147,815
Madison County
113,751
Lee County
82,774
Forrest County
78,440
Lauderdale County
69,912
Lamar County
66,688
Jones County
66,060
Lafayette County
59,204
Pearl River County
58,773
Lowndes County
56,895
Oktibbeha County
51,022
Hancock County
46,311
Warren County
41,961
Washington County
41,368
Pike County
39,101
Lincoln County
34,640
Marshall County
34,341
Alcorn County
34,123
Monroe County
33,650
Panola County
32,746
Pontotoc County
31,703
Adams County
28,975
Neshoba County
28,774
Bolivar County
28,475
Union County
28,436
Tate County
28,263
Copiah County
27,616
Scott County
27,454
Leflore County
26,092
George County
26,039
Simpson County
25,807
Yazoo County
25,699
Prentiss County
25,379
Marion County
24,282
Itawamba County
24,215
Sunflower County
24,099
Leake County
21,313
Tippah County
21,136
Newton County
21,015
Grenada County
20,996
Coahoma County
19,919
Wayne County
19,823
Stone County
18,871
Tishomingo County
18,393
Clay County
18,101
Covington County
17,976
Winston County
17,328
Attala County
17,188
Chickasaw County
16,869
Jasper County
15,949
Holmes County
15,443
Clarke County
15,253
Smith County
14,116
Walthall County
13,902
Greene County
13,636
Calhoun County
12,524
Yalobusha County
12,359
Amite County
12,325
Lawrence County
11,721
Tallahatchie County
11,607
Perry County
11,232
Jefferson Davis County
10,859
Webster County
10,032
Noxubee County
9,828
Montgomery County
9,637
Carroll County
9,334
Tunica County
9,061
Kemper County
8,498
Claiborne County
8,459
Choctaw County
8,081
Wilkinson County
7,913
Franklin County
7,609
Benton County
7,320
Humphreys County
7,078
Jefferson County
6,815
Quitman County
5,418
Sharkey County
3,210
Issaquena County
1,250
Birth and Death Rates
Indicator
Value
Fertility Rate
59.7 births per 1,000 women (ages 15-44)
Teen Birth Rate
26.4 births per 1,000 females (ages 15-19)
Infant Mortality Rate
9.11 infant deaths per 1,000 live births
Life Expectancy (at Birth)
70.9 years (2021)
Marriage Rate
5.9 marriages per 1,000
Divorce Rate
3.0 divorces per 1,000
Leading Cause of Death
Heart Disease
Drug Overdose Death Rate
27.6 per 100,000
Firearm Injury Death Rate
29.6 per 100,000
Homicide Rate
20.7 per 100,000
Mississippi exhibits significant health challenges compared to national averages.
The state’s life expectancy of 70.9 years is notably lower than the national average, reflecting underlying health disparities.
High rates of infant mortality (9.11) and teen births (26.4) highlight challenges in maternal and child health according to the CDC.
Heart disease remains the leading cause of death, while firearm injuries and homicides (29.6 and 20.7 per 100,000, respectively) represent urgent public health and safety issues.
The drug overdose death rate (27.6 per 100,000) adds to the burden of preventable deaths.
These indicators suggest the need for comprehensive health interventions and preventative measures.
Mississippi Birth Data
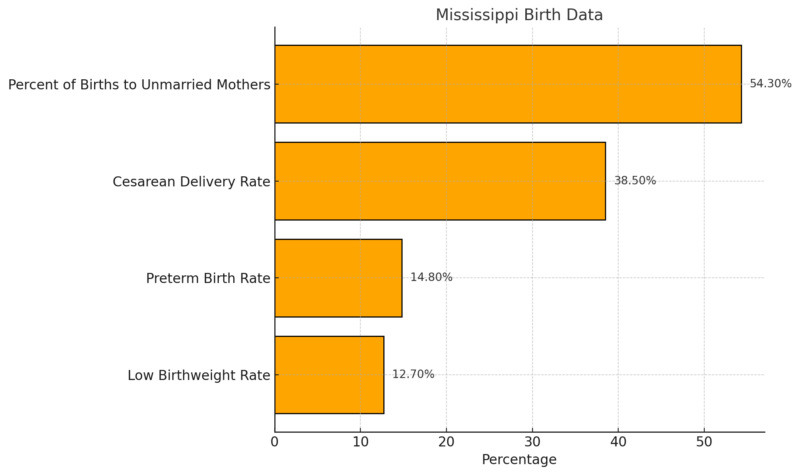
Mississippi faces critical maternal and neonatal health concerns. Over half (54.3%) of births are to unmarried mothers, which could correlate with socioeconomic challenges.
The cesarean delivery rate is high at 38.5%, potentially indicating limited access to alternative birthing options or an over-reliance on surgical interventions.
Preterm births (14.8%) and low-birthweight deliveries (12.7%) exceed national averages, suggesting gaps in prenatal care and higher risks of complications.
These trends point to the need for enhanced maternal health programs, improved access to prenatal care, and community support systems for expecting mothers.
Migration Patterns
Metric
Value
Immigrant share of population
2.2%
Immigrant residents
64,600
Immigrant spending power
$1.3 billion
Immigrant taxes paid
$397.8 million
American Immigration Council notes that immigrants in Mississippi form a small but impactful portion of the population, contributing significantly to the economy.
Representing only 2.2% of the state’s population, they account for $1.3 billion in spending power and nearly $400 million in taxes paid, demonstrating their role as active contributors to the state’s economic health.
Demographics
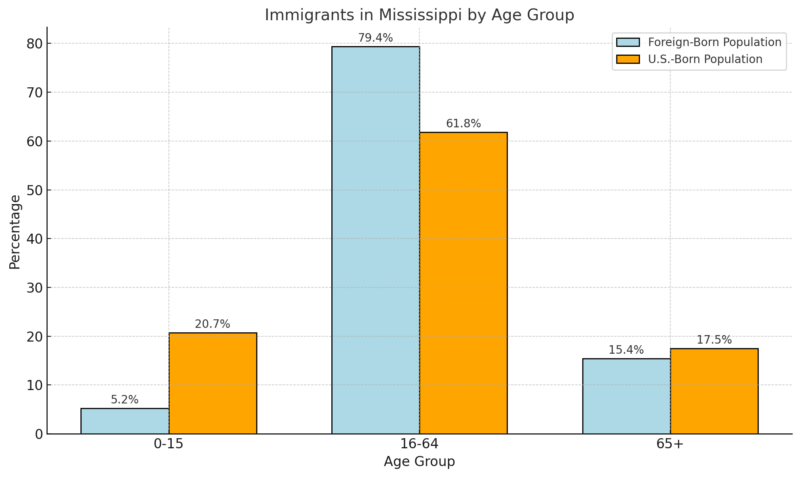
The majority of immigrants in Mississippi (79.4%) are of working age (16-64), far exceeding the U.S.-born population’s share in this category.
This highlights their critical role in the labor force, where they actively contribute to key industries such as construction (6.9%) and hospitality (5.1%).
Gender distribution is relatively balanced, with slightly more immigrant men (51.6%) than women (48.4%).
Entrepreneurship
Metric
Value
Share of entrepreneurs who are immigrants
4.1%
Number of immigrant entrepreneurs
5,100
Business income of immigrant entrepreneurs
$117.8 million
Immigrant entrepreneurship is a driving force for job creation and economic growth in Mississippi. Immigrants account for 4.1% of all entrepreneurs in the state, with 5,100 business owners generating over $117.8 million in business income annually.
Taxes and Spending Power
Metric
Value
Immigrant household income
$1.7 billion
Total spending power
$1.3 billion
State & Local Taxes Paid
$151.0 million
Federal Taxes Paid
$246.8 million
Total Taxes Paid
$397.8 million
Contributions to Social Security
$189.2 million
Contributions to Medicare
$46.7 million
Immigrants in Mississippi demonstrate substantial economic contributions through taxes and spending. They contribute nearly $400 million in taxes, including significant amounts toward Social Security ($189.2 million) and Medicare ($46.7 million). Their $1.3 billion spending power further supports local communities as consumers and taxpayers.
Top Countries of Origin for Immigrants
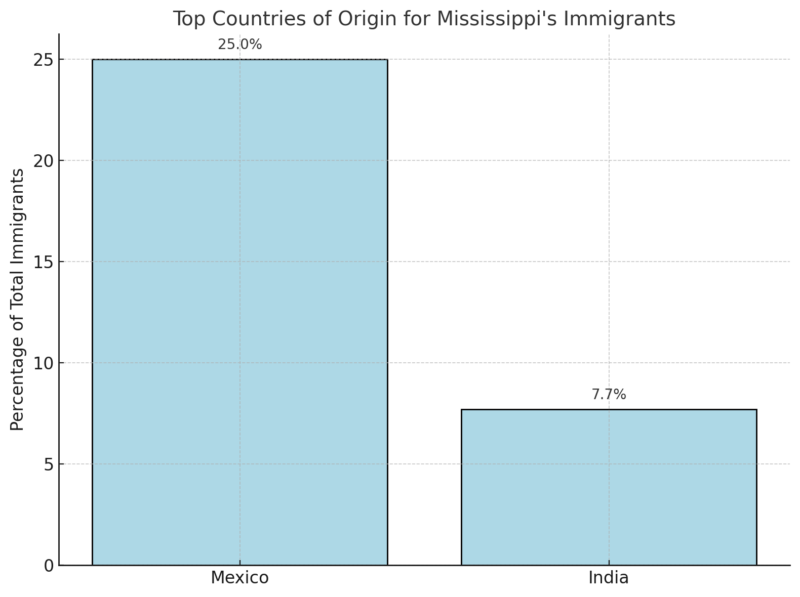
A significant share of Mississippi’s immigrant population originates from Mexico (25.0%) and India (7.7%). These diverse communities enrich the state’s cultural fabric while actively contributing to its economy and labor force.
Real GDP Growth Projections for Mississippi and the U.S. (2024-2026)
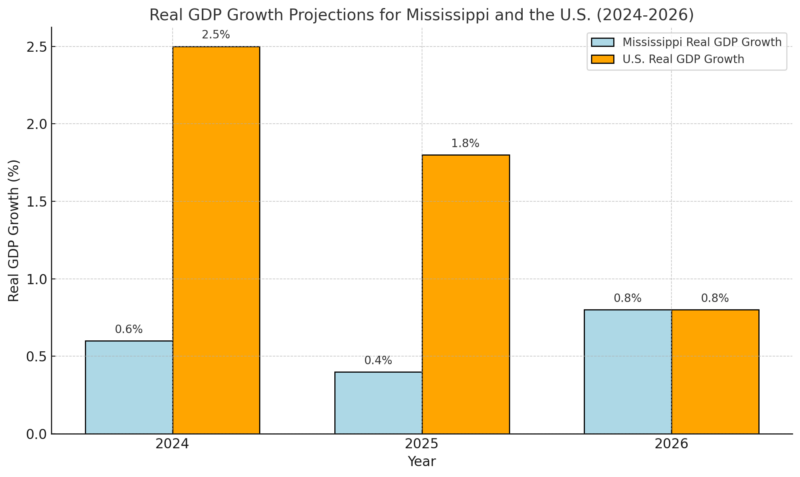
Mississippi’s GDP growth is projected to remain modest compared to the U.S., with a forecasted 0.6% growth in 2024, slightly rising to 0.8% by 2026 as per Mississippi.edu.
In contrast, the U.S. economy is expected to grow more robustly in 2024 (2.5%) but will decelerate to match Mississippi’s growth at 0.8% by 2026.
The disparity highlights Mississippi’s slower economic recovery and dependence on key sectors like manufacturing and government, which are forecast to experience mixed outcomes during this period.
Mississippi Payroll Employment Growth by Year (2024-2026)
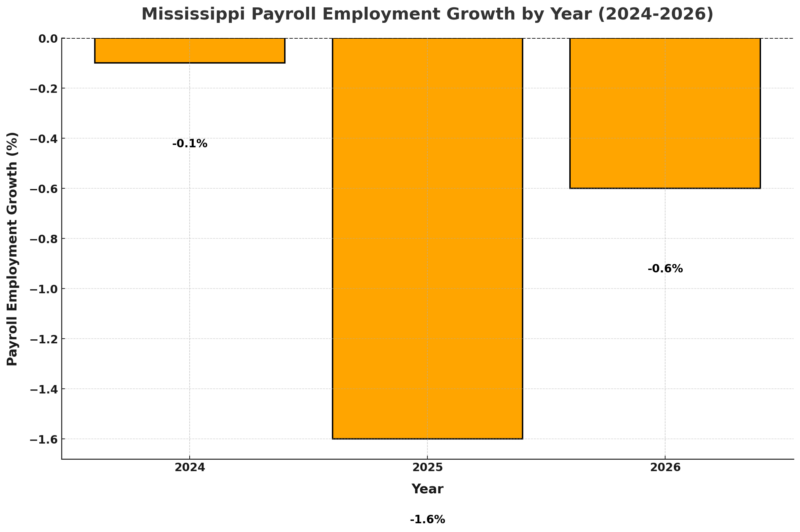
Mississippi’s payroll employment is forecast to decline annually through 2026, with the largest drop (-1.6%) in 2025.
Despite modest improvement in 2026 (-0.6%), the continued decline reflects structural challenges in key sectors such as manufacturing and retail.
However, sectors like mining and oil and gas extraction are expected to experience growth, providing some offset.
This downward trend underscores the need for diversified job creation and economic development initiatives in the state.
Labor Force Data
Month
Civilian Labor Force (in thousands)
Employment (in thousands)
Unemployment (in thousands)
Unemployment Rate (%)
May 2024
1,233.2
1,198.6
34.6
2.8%
June 2024
1,237.8
1,203.7
34.2
2.8%
July 2024
1,241.6
1,208.2
33.4
2.7%
August 2024
1,246.4
1,212.9
33.5
2.7%
September 2024
1,250.7
1,216.0
34.7
2.8%
October 2024 (p)
1,255.7
1,219.0
36.7
2.9%
- Civilian Labor Force: The labor force steadily increased each month, growing from 1,233.2 thousand in May to 1,255.7 thousand in October 2024, indicating a rise in labor market participation.
- Employment: Employment figures also showed consistent growth, rising from 1,198.6 thousand in May to 1,219.0 thousand in October according to the BLS.
- Unemployment: Despite the increase in employment, unemployment figures rose slightly in October (36.7 thousand) compared to earlier months.
- Unemployment Rate: The unemployment rate fluctuated minimally, staying between 2.7% and 2.9%, demonstrating a relatively stable and low unemployment environment during this period.
Housing Market
Metric
Value
Year-over-Year Growth
Median Sale Price
$259,000
+4.7%
Number of Homes Sold
1,616
+7.2%
Median Days on Market
50
+15 days
Number of Homes for Sale
8,784
+12.1%
Number of Newly Listed Homes
2,197
+2.5%
Months of Supply
4
0 (unchanged)
Redfin says that the Mississippi housing market in October 2024 shows moderate growth in home prices and increased market activity.
The median sale price increased by 4.7% year-over-year, reflecting rising home values.
View this post on Instagram
The number of homes sold grew by 7.2%, while the supply of homes for sale expanded by 12.1%, indicating a more balanced market with increasing options for buyers.
However, homes lingered longer on the market, with median days increasing by 15 days compared to the previous year.
Top 10 Mississippi Metros with Fastest-Growing Sale Prices
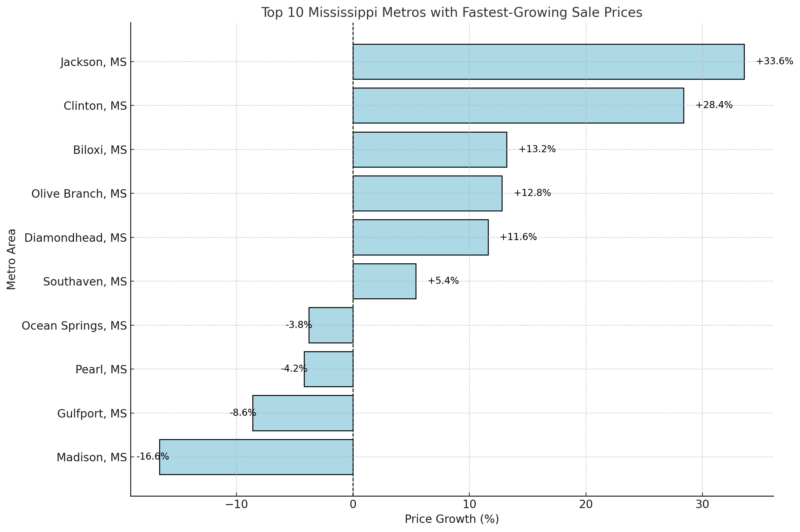
Metro areas like Jackson and Clinton experienced significant price growth, with increases of 33.6% and 28.4%, respectively, suggesting strong demand and possibly limited supply in these markets.
Conversely, areas such as Madison and Gulfport saw price declines, which could indicate weaker demand or an oversupply of homes in these regions.
Housing Demand and Competition Metrics
Metric
Value
Year-over-Year Change
Homes Sold Above List Price
9.7%
-3.1 percentage points
Homes with Price Drops
26.1%
+1.8 percentage points
Sale-to-List Price Ratio
96.7%
-0.011 percentage points
The competitiveness of Mississippi’s housing market appears to be cooling slightly.
The percentage of homes selling above list price declined to 9.7%, and the sale-to-list price ratio dropped slightly to 96.7%.
These changes suggest less frequent bidding wars and a market where sellers may need to adjust prices to attract buyers.
Educational Attainment in Mississippi (Population Aged 25 and Older)
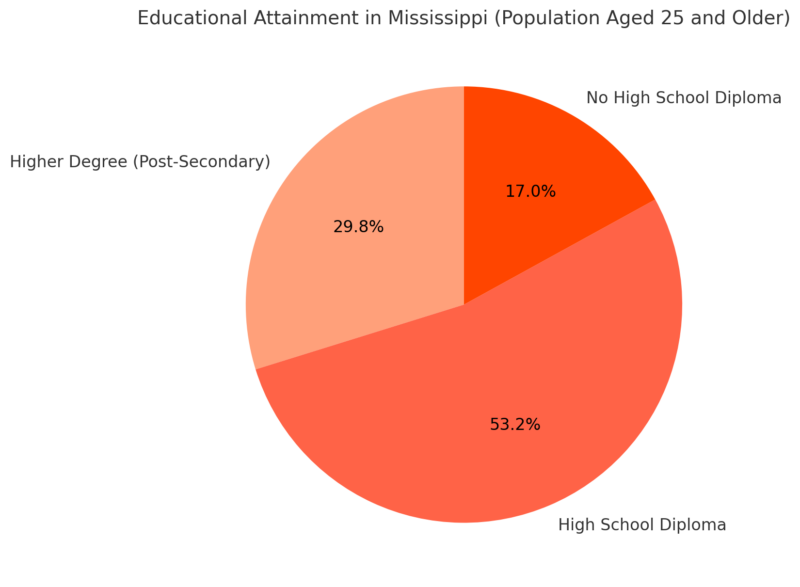
In Mississippi, the majority of the adult population (53.2%) holds a high school diploma as their highest educational qualification, while 29.8% have attained a higher degree, such as a college or post-secondary credential according to the Statistical Atlas.
However, 17.0% of adults lack a high school diploma, indicating a significant need for educational initiatives targeting basic educational attainment.
Relative Educational Attainment (Comparison to U.S. Averages)
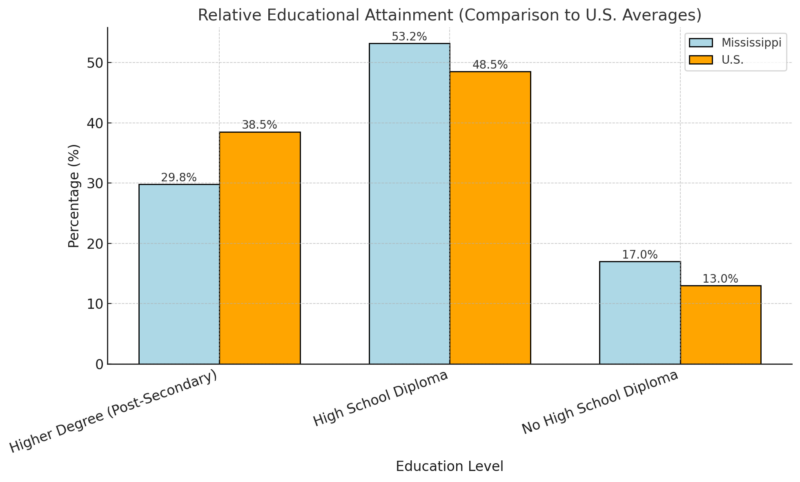
Mississippi lags behind the national average in post-secondary education attainment, with 22.7% fewer adults holding higher degrees compared to the U.S. as a whole.
Conversely, the state has a higher percentage of adults with only a high school diploma (+9.7%) and significantly more individuals without a high school diploma (+30.9%).
This highlights gaps in advanced educational attainment and suggests a need for policies to improve access to higher education and reduce dropout rates.
Medicaid and CHIP in Mississippi
Metric
Value
Total Medicaid and CHIP Enrollment (June 2024)
609,875
Medicaid Spending (FY 2022)
$6.3 billion
Federal Share of Medicaid Costs
82.5%
Total Disenrollments Since March 2023
149,948
Enrollment Increase Since February 2020
4.3%
Mississippi’s Medicaid and CHIP programs play a critical role in providing health coverage to over 600,000 residents.
KFF says that despite the 4.3% increase in enrollment since the pre-pandemic period, the state saw significant disenrollment (149,948) after the end of COVID-19 continuous enrollment policies.
The federal government’s substantial contribution (82.5% of Medicaid costs) underscores the program’s reliance on federal support.
Eligibility Limits (as Percent of Federal Poverty Level)
Category
United States
Mississippi
Parents (Family of Three)
138.0%
27.0%
Other Adults
138.0%
0.0%
Pregnant Women
214.0%
NA
Children
255.0%
214.0%
Mississippi has some of the most restrictive Medicaid eligibility limits in the U.S., particularly for parents (27% of FPL) and other adults (0%). The state has not expanded Medicaid under the Affordable Care Act, leaving many low-income adults ineligible for coverage. Expanding Medicaid could significantly reduce the uninsured population and improve access to care.
ACA Marketplace Coverage in Mississippi
Metric
Value
Marketplace Enrollment (2024)
273,579
Enrollment Growth Since 2020
215%
Enrollees Receiving Tax Credits
99%
Enrollment in ACA marketplace plans has surged by 215% in Mississippi since 2020, reaching over 273,000 residents in 2024.
Almost all enrollees (99%) benefit from advanced premium tax credits, making coverage more affordable.
This increase reflects enhanced subsidies under ARPA and the Inflation Reduction Act, which have been instrumental in reducing the financial burden of premiums for low-income residents.
Learn more & #GetCovered at: https://t.co/6A4k1vZHNE #MarketplaceOE
If you’re in Mississippi and need help signing up for health insurance, call 662-298-3584!#ACA #insurance #Mississippi #health pic.twitter.com/XxxoGA5gJf
— Get Covered Mississippi (@getcoveredms) November 26, 2024
Crime Rates 2025 Mississippi

Mississippi experiences a total crime rate of 19.92 per 1,000 residents, with property crimes accounting for the majority of incidents.
The property crime rate (17.47 per 1,000) is significantly higher than the violent crime rate (2.45 per 1,000) according to the Neighborhood Scout.
Violent Crime Breakdown
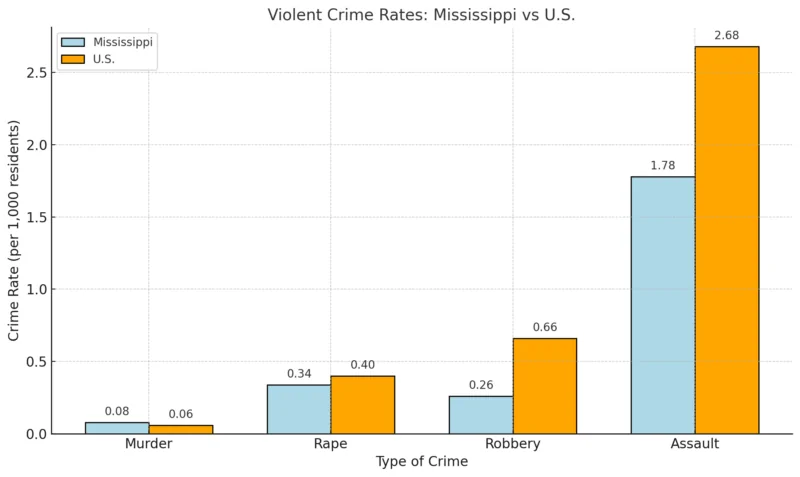
Mississippi’s violent crime rates are slightly lower than national averages, except for murder, which is slightly higher (0.08 per 1,000 vs. 0.06). Assault is the most prevalent violent crime, comprising the majority of incidents in this category.
Property Crime Breakdown
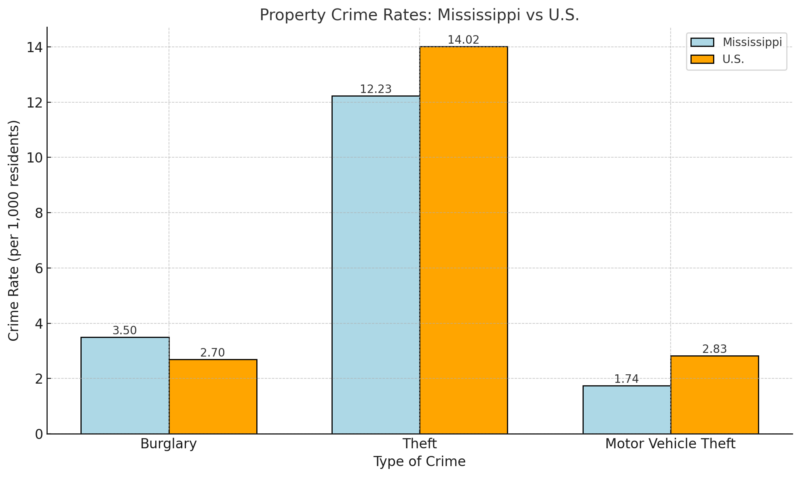
Theft accounts for the largest share of property crimes in Mississippi, with a rate of 12.23 per 1,000 residents. While burglary is higher in Mississippi than the national rate (3.50 vs. 2.70), motor vehicle theft is comparatively lower.
Methodology
- Data was gathered from reliable sources such as the U.S. Census Bureau, Bureau of Labor Statistics, Redfin, and the American Immigration Council.
- Key metrics like population, economic growth, healthcare, education, crime, and housing were analyzed to provide a comprehensive overview.
- Comparative data with national averages highlighted Mississippi’s unique trends and challenges.
- Statistics were condensed into meaningful insights and categorized into population, healthcare, economy, education, crime, and housing.
References
- World Population Review – Mississippi Population 2024
- Neilsberg – Mississippi Population by Age
- U.S. Census Bureau – Educational Attainment in Mississippi
- American Immigration Council – Immigrants in Mississippi
- Mississippi Institutions of Higher Learning – Mississippi Economic Outlook
- Redfin – Mississippi Housing Market
- Neighborhood Scout – Mississippi Crime Rates
- Bureau of Labor Statistics (BLS) – Mississippi Labor Force Data
- Centers for Disease Control and Prevention (CDC) – Mississippi Health Statistics