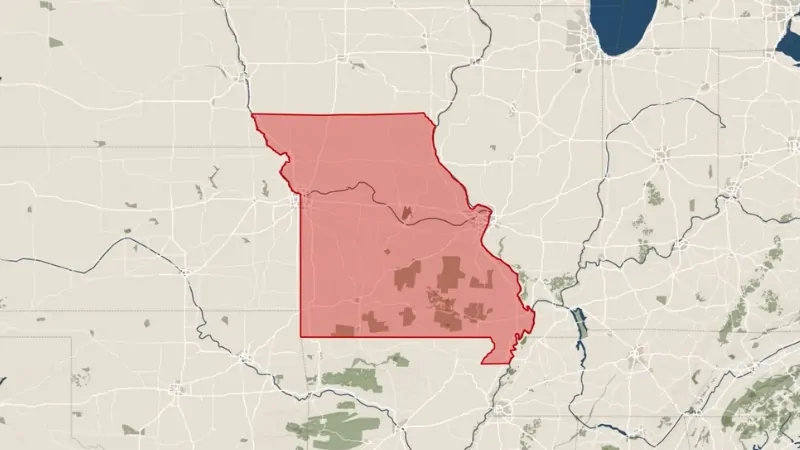
The landlocked state of Missouri, located in the Midwest region of the United States, is home to a population of 6,215,140 in 2025 according to the World Population Review.
While population growth has slowed significantly, with a current growth rate of just 0.28% (ranking 41st nationally), the state has gradually edged past the 6.1 million mark.
Missouri shares its borders with eight states: Iowa to the north, Illinois, Kentucky, and Tennessee to the east, Arkansas to the south, and Oklahoma, Kansas, and Nebraska to the west.
Table of Contents
ToggleKey Takeaways
Population Density in Missouri
New US Census estimates found that Missouri’s population grew 41,267 between April 1, 2020 and July 1, 2023 (a 0.67% increase). That growth was not evenly distributed throughout the state, with some counties growing by as much as 9% and others shrinking by 10% in that timeframe: pic.twitter.com/xSr0MLt9kX
— Missouri Mapper (@Missouri_Mapper) March 14, 2024
Missouri has a moderate population density compared to other U.S. states. With a total land area of 69,704 square miles, the state has an average of 87.1 people per square mile, ranking it 28th in population density nationwide. Despite being the 18th most populous state and 21st largest by land area, Missouri’s population is relatively dispersed.
The state’s largest cities include Kansas City (475,378), St. Louis (315,685), Springfield (166,810), and Columbia (119,108), with Jefferson City serving as the capital.
While urban areas like St. Louis and Kansas City can reach population densities exceeding 5,000 people per square mile, most of Missouri’s counties have densities ranging between 1 and 100 people per square mile.
Notably, Missouri has a higher proportion of rural residents than many states, with about one-third of its population living in rural areas.
Age Structure
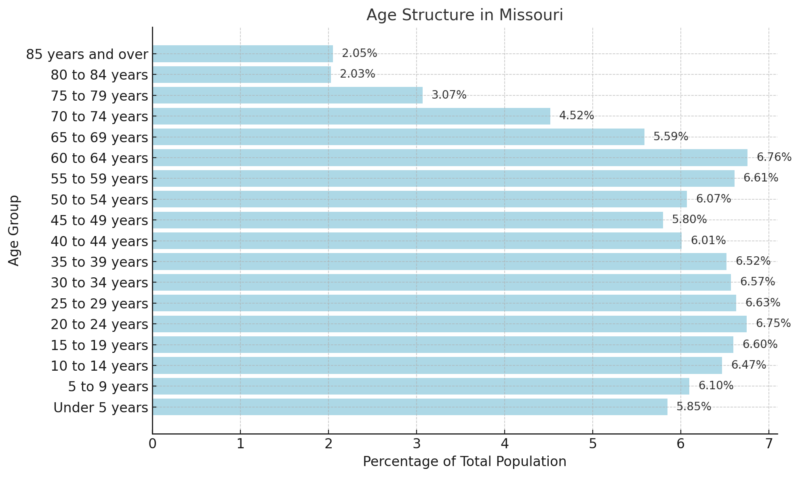
The median age in Missouri is 38.8, according to the 2018-2022 ACS 5-Year Estimates. Of the state’s total population, 18.42% are under 15 years old, while those aged 15 to 29 account for 19.98%.
The largest share of the population, 44.34%, falls within the 30 to 64 age group, highlighting a strong working-age demographic.
Additionally, 15.21% are between 65 and 84 years, and 2.05% are 85 years or older, reflecting Missouri’s significant older adult population.
Age-Dependency Ratios
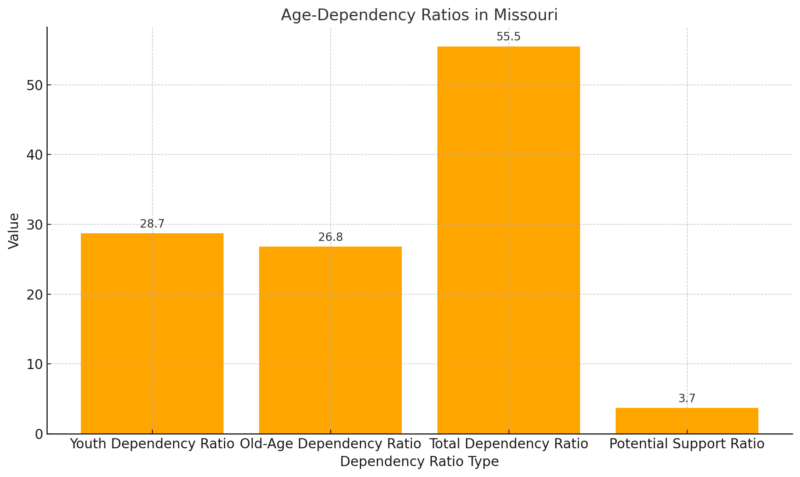
Missouri’s population pyramid reveals a balanced dependency structure with a youth dependency ratio of 28.7, indicating a moderate number of children (0-14) relative to the working-age population. Meanwhile, the old-age dependency ratio of 26.8 reflects a growing elderly population, which places increasing pressure on the working-age group.
The total dependency ratio of 55.5 suggests that for every 100 working-age individuals (15-64), there are approximately 55 dependents (children and elderly combined), which is relatively balanced but signals challenges in maintaining economic productivity and support systems.
The potential support ratio of 3.7 means there are roughly 3.7 working-age individuals for every elderly person, highlighting the strain on social services and healthcare as Missouri’s population continues to age. This ratio underscores the need for policies aimed at supporting the aging population while maintaining workforce growth.
Population by Race
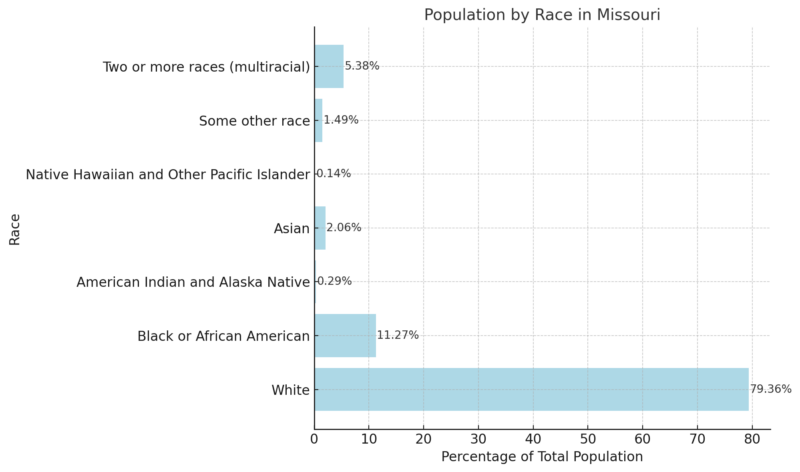
Neilsberg notes that Missouri’s population is predominantly White, comprising 79.36% of the total residents, followed by Black or African American individuals, who account for 11.27%. Smaller racial groups, such as Asian residents (2.06%) and those identifying as Two or more races (5.38%), contribute to the state’s diversity.
The American Indian and Alaska Native population and the Native Hawaiian and Other Pacific Islander groups represent very small portions, at 0.29% and 0.14%, respectively. While Missouri remains less racially diverse than the national average, the growing multiracial population suggests gradual changes in demographic composition.
Missouri Counties 2025
County
Population
County
Population
St. Louis County
983,327
Jackson County
720,902
St. Charles County
419,520
Greene County
306,025
St. Louis City
277,315
Clay County
262,614
Jefferson County
233,240
Boone County
191,205
Jasper County
126,096
Platte County
113,310
Cass County
113,107
Franklin County
107,015
Christian County
95,722
Cape Girardeau County
83,037
Buchanan County
83,021
Cole County
77,600
St. Francois County
67,210
Lincoln County
66,216
Newton County
61,258
Taney County
56,801
Johnson County
55,475
Pulaski County
53,814
Phelps County
45,295
Callaway County
44,739
Camden County
44,328
Pettis County
43,663
Webster County
42,578
Butler County
41,730
Howell County
40,847
Lawrence County
39,055
Warren County
38,322
Scott County
37,910
Laclede County
37,015
Barry County
35,586
Lafayette County
33,425
Stone County
33,182
Polk County
32,901
Stoddard County
28,404
Marion County
28,183
Dunklin County
26,653
Texas County
25,934
Miller County
25,777
Adair County
25,093
Audrain County
24,306
McDonald County
24,213
Washington County
23,676
Randolph County
23,592
Ray County
23,243
Saline County
23,095
Crawford County
22,779
Henry County
22,549
Morgan County
22,154
Clinton County
21,793
Benton County
20,871
Nodaway County
20,675
Vernon County
19,821
Wright County
19,663
Perry County
19,022
Ste. Genevieve County
18,671
Andrew County
18,238
Pike County
18,226
Dallas County
17,949
Cooper County
17,131
Bates County
16,314
Moniteau County
15,252
Macon County
15,246
New Madrid County
15,138
Dent County
14,806
Livingston County
14,779
Cedar County
14,743
Gasconade County
14,638
Pemiscot County
14,361
Osage County
13,538
Madison County
12,639
Douglas County
12,475
Mississippi County
11,979
Barton County
11,767
Linn County
11,756
Montgomery County
11,439
Ripley County
10,898
Wayne County
10,805
Ralls County
10,568
Bollinger County
10,557
Howard County
10,023
St. Clair County
9,909
Grundy County
9,786
Lewis County
9,750
Iron County
9,467
Ozark County
8,986
Caldwell County
8,971
Hickory County
8,861
Monroe County
8,761
Oregon County
8,737
Daviess County
8,645
DeKalb County
8,488
Maries County
8,428
Carroll County
8,362
Harrison County
8,223
Dade County
7,767
Chariton County
7,403
Shannon County
7,260
Clark County
6,567
Gentry County
6,300
Reynolds County
5,904
Shelby County
5,866
Sullivan County
5,778
Carter County
5,352
Atchison County
5,053
Scotland County
4,705
Putnam County
4,614
Holt County
4,242
Schuyler County
4,106
Knox County
3,669
Mercer County
3,472
Worth County
1,874
WPR notes that Missouri has 115 counties, with St. Louis County being the most populous at 996,945 residents in 2019, despite a slight 0.19% decline since 2010. Other major counties include Jackson County (700,307), St. Charles County (399,182), and St. Louis City (302,838), with St. Charles County showing the fastest growth at 10.33%.
The smallest county is Worth County with just 2,040 residents, a decline of -5.20%. Six other counties, including Mercer and Knox, have populations under 5,000, all experiencing declines, with Holt County having the steepest drop at -10.40%.
The fastest-growing county is Platte County, with a growth rate of 14.81%. Other rapidly growing counties include Clay County (10.63%), St. Charles County (10.33%), and Boone County (10.30%). Conversely, Pemiscot County experienced the largest decline, losing 10.94% of its population.
Income Levels
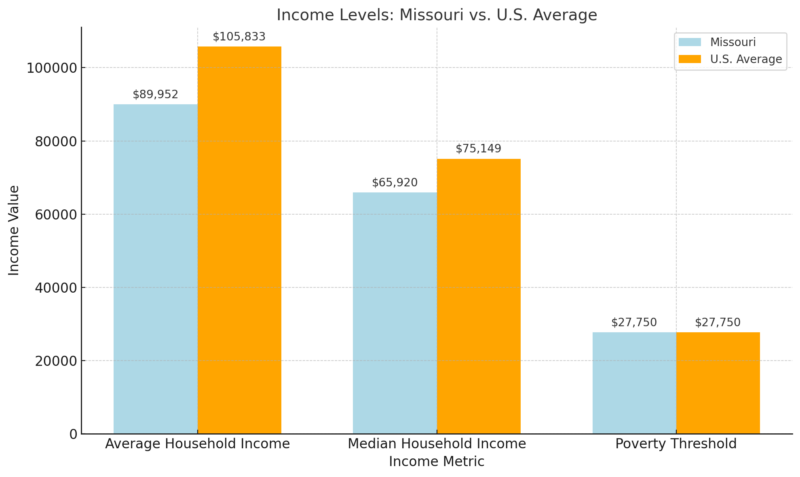
Missouri’s average household income of $89,952 is 15% lower than the national average. Similarly, the median household income stands at $65,920, falling 12% below the U.S. as it is noted by Income By Zip Code—median, reflecting a generally lower income level compared to the national standard.
Richest Zip Codes in Missouri
Rank
Zip Code
Population
Mean Income
Median Household Income
1
63073
1,511
$351,942
$250,001
2
63131
18,531
$325,315
$208,654
3
63124
10,997
$317,192
$177,326
4
63005
19,734
$253,891
$183,260
5
64113
12,446
$220,032
$176,006
6
63038
7,153
$214,878
$173,750
7
63341
3,628
$203,804
$139,293
8
63105
19,003
$197,291
$116,345
9
63141
20,781
$189,522
$120,648
10
63127
5,235
$185,411
$126,199
The wealthiest zip code in Missouri is 63073, with an impressive mean income of $351,942 and a median income of $250,001. St. Louis area zip codes dominate the top rankings, highlighting significant income disparities across the state.
Missouri Salary Data
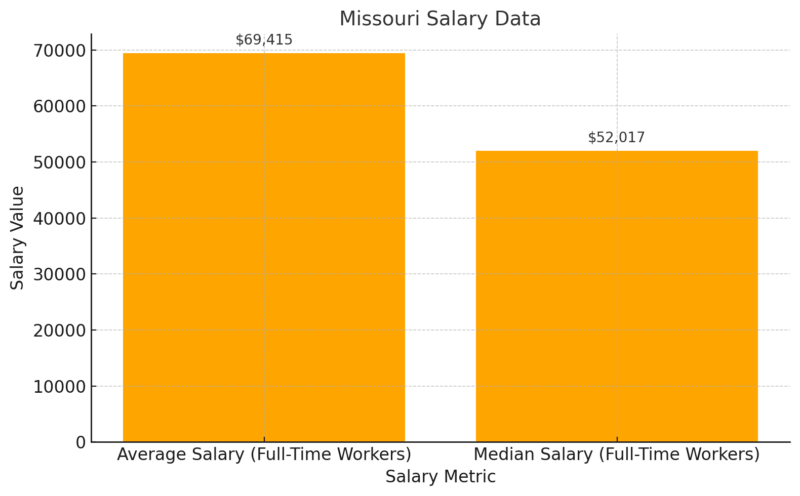
The average salary for full-time workers in Missouri is $69,415, while the median salary is $52,017. The gap between the average and median reflects the influence of higher earners raising the average, while the median gives a better picture of the typical worker’s earnings.
Missouri Individual Incomes
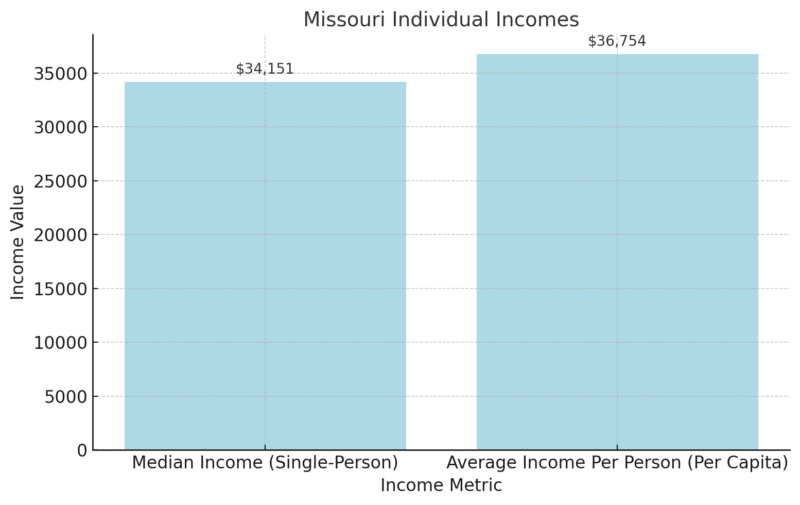
For single-person households, the median income in Missouri is $34,151. The per capita income is slightly higher at $36,754, but remains lower compared to many other states, largely due to Missouri’s overall lower income levels.
Missouri Family Income Data
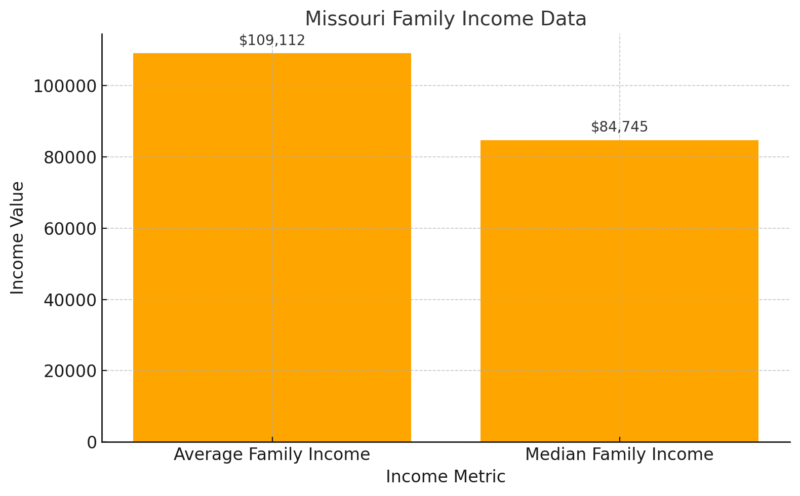
The average family income in Missouri is $109,112, while the median family income stands at $84,745. This data highlights the combined earning power of multiple earners within family households, providing a higher overall income compared to individual or single-person statistics.
Employment
Data Series
May 2024
June 2024
July 2024
Aug 2024
Sept 2024
Oct 2024 (p)
Civilian Labor Force
3,121.2
3,130.5
3,142.4
3,150.2
3,151.6
3,154.4
Employment
3,011.8
3,016.0
3,021.5
3,027.9
3,029.9
3,034.4
Unemployment
109.4
114.5
120.8
122.3
121.6
120.0
Unemployment Rate (%)
3.5%
3.7%
3.8%
3.9%
3.9%
3.8%
Missouri’s civilian labor force grew steadily from 3.12 million in May to 3.15 million by October 2024, reflecting positive labor market engagement. Employment followed a similar trend, rising from 3.01 million in May to 3.03 million in October as noted by BLS.
However, the unemployment rate fluctuated slightly, increasing from 3.5% in May to 3.9% by August, before improving slightly to 3.8% in October. The unemployment figures peaked at 122,300 in August but dropped to 120,000 by October, indicating modest improvements in job availability toward the end of the period.
Educational Attainment in Missouri (Ages 25 and Older)
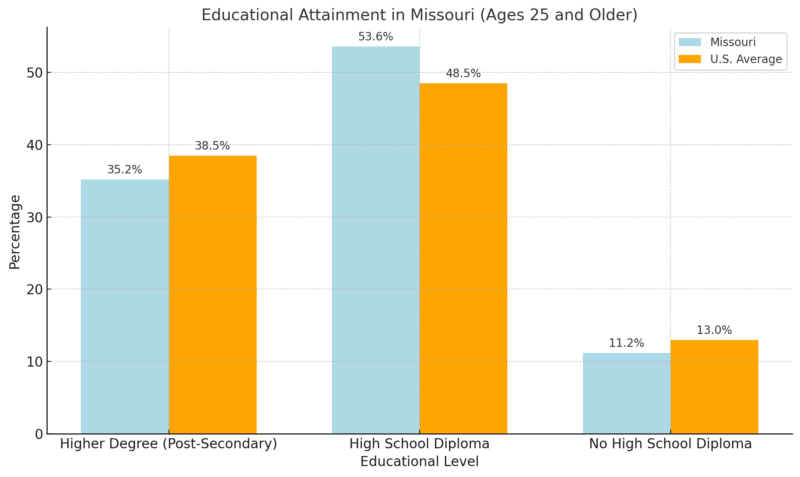
Statistical Atlas notes that only 35.2% of Missouri residents aged 25 and older hold a post-secondary degree, which is 8.6% below the national average of 38.5%, indicating fewer residents with advanced education credentials.
A larger proportion of Missourians, 53.6%, have achieved a high school diploma, 10.6% higher than the U.S. average of 48.5%. This suggests strong attainment at the high school level.
Missouri fares better than the national average in reducing those without a high school diploma. Only 11.2% lack this credential, compared to 13.0% nationally, marking a 14.2% improvement.
Immigrants in Missouri
Metric
Value
Immigrant Share of State Population
4%
Native-Born with at Least One Immigrant Parent
4%
Total Immigrant Population (2018)
258,390
Top Countries of Origin
Mexico (15%), China (8%), India (7%)
Missouri has a small yet growing immigrant population, representing 4% of the state’s total population in 2018. Additionally, 4% of native-born residents have at least one immigrant parent.
The majority of immigrants come from Mexico, followed by China, India, Vietnam, and Bosnia and Herzegovina, reflecting a mix of neighboring and distant origins according to the American Immigration Council.
Immigration and Naturalization
Metric
Value
Naturalized Immigrants
127,336 (49%)
Eligible for Naturalization (2017)
40,787
English Proficiency
84% speak “well” or “very well”
Nearly half (49%) of Missouri’s immigrants have naturalized, highlighting their integration into U.S. society. Furthermore, 84% report speaking English proficiently, indicating high language assimilation. An additional 40,787 immigrants were eligible for naturalization, reflecting further potential for growth in citizen participation.
Education Levels of Missouri Immigrants
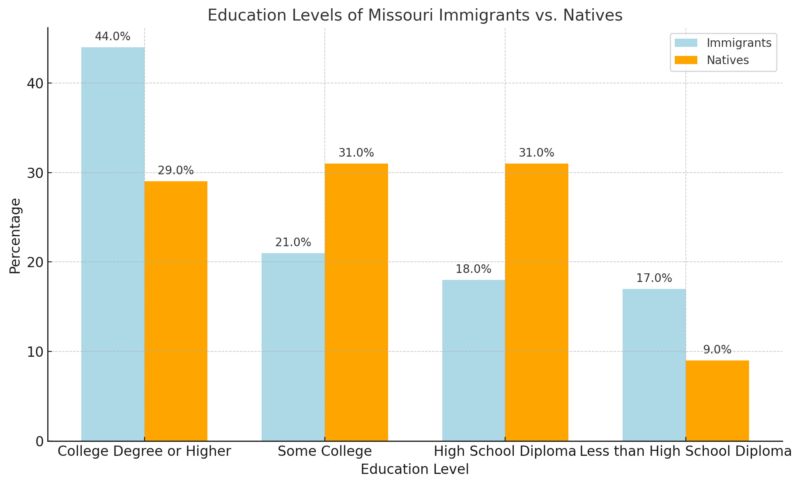
Missouri’s immigrant population is more likely to hold college degrees or higher at 44%, compared to only 29% of native residents. However, a significant portion, 17%, has less than a high school diploma, signaling gaps in educational access among certain immigrant groups.
Undocumented Population in Missouri
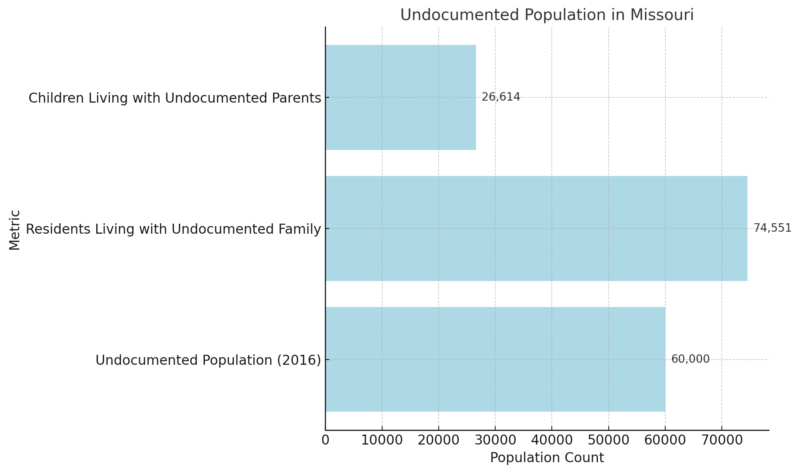
Approximately 60,000 undocumented immigrants reside in Missouri, making up 1% of the total population. Notably, 2% of children in Missouri live with at least one undocumented family member. This data highlights the family-oriented nature of the undocumented population and their integration into Missouri communities.
DACA Recipients in Missouri
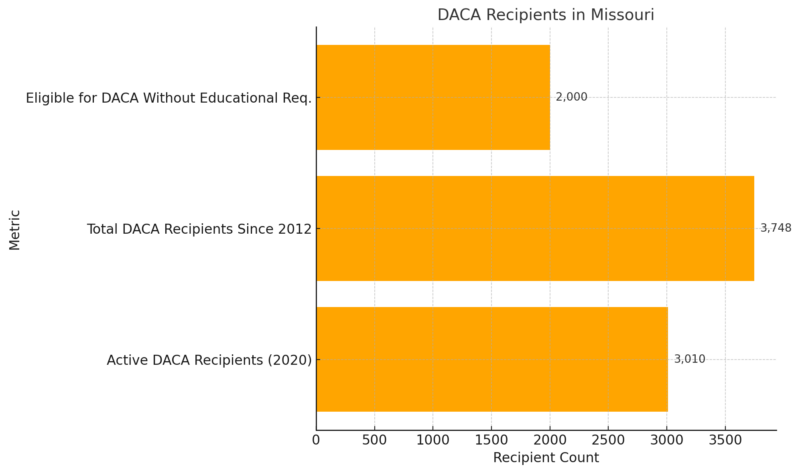
Missouri is home to over 3,000 active DACA recipients, with an additional 2,000 residents eligible pending educational requirements. While DACA participation has been strong, it underscores the importance of addressing barriers such as education to support young undocumented immigrants.
Immigrants in Missouri’s Workforce
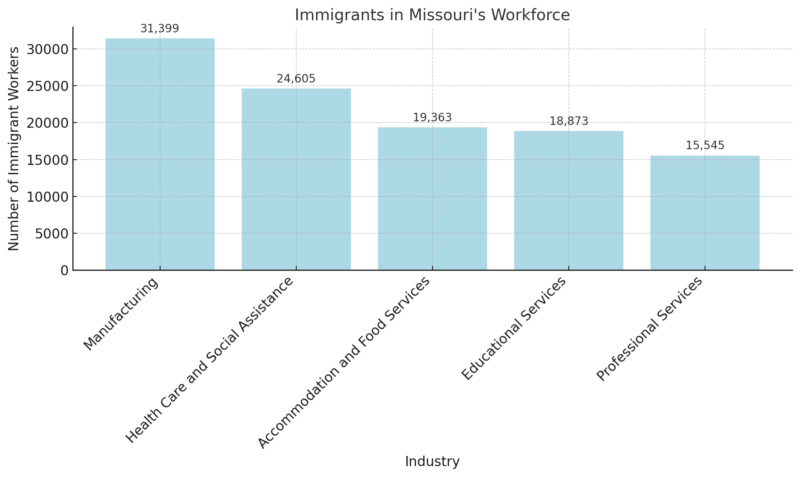
Immigrants play a vital role in Missouri’s workforce, particularly in manufacturing (31,399 workers) and healthcare (24,605 workers). They also contribute significantly to service industries, demonstrating their importance to sectors that drive the state’s economy.
Immigrant Share in Key Industries
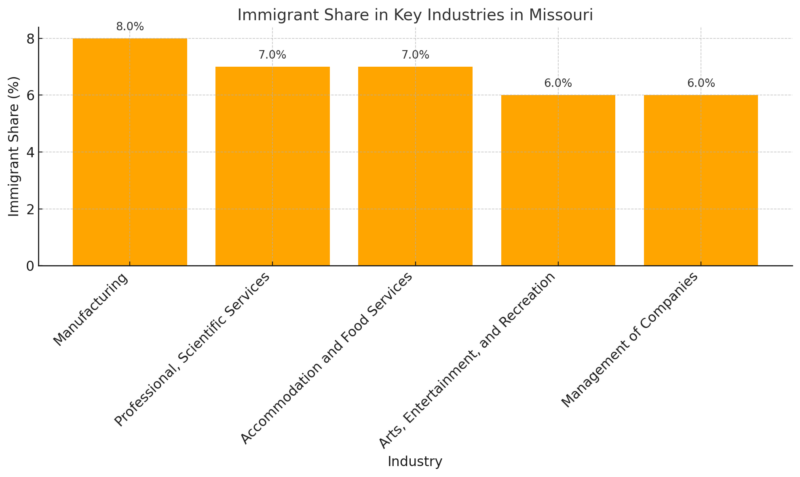
Immigrants make up a notable share of workers in manufacturing (8%) and professional services (7%), two critical sectors for Missouri’s economy. This highlights their significant contributions across a range of industries that sustain economic growth.
Occupations with Highest Immigrant Participation
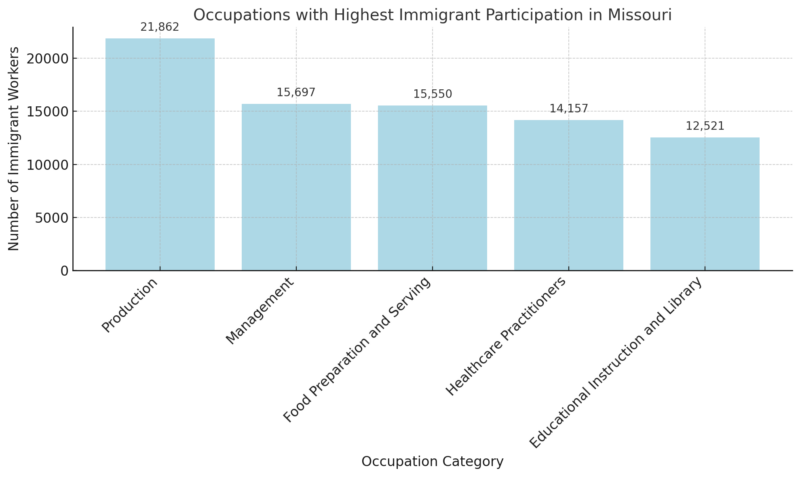
Missouri’s immigrant workforce is concentrated in production (21,862 workers), management, and food services, showcasing their importance in skilled and essential roles. Their participation in healthcare and education also highlights the diversity of their contributions across critical fields.
Key Health Indicators in Missouri
Health Indicator
Value
Fertility Rate
57.7 (per 1,000 women, 15-44)
Teen Birth Rate
16.9 (per 1,000 females, 15-19)
Infant Mortality Rate
6.77 (per 1,000 live births)
Life Expectancy at Birth
74.6 years (2021)
Marriage Rate
5.8 (per 1,000)
Divorce Rate
2.7 (per 1,000)
Leading Cause of Death
Heart Disease
Drug Overdose Death Rate
36.9 (per 100,000)
Firearm Injury Death Rate
24.2 (per 100,000)
Homicide Rate
12.8 (per 100,000)
Missouri’s fertility rate stands at 57.7 births per 1,000 women aged 15-44, with a teen birth rate of 16.9, indicating moderate birth trends. However, the infant mortality rate of 6.77 is slightly above the national average, signaling challenges in maternal and child healthcare according to the CDC.
Life expectancy in Missouri is 74.6 years, lower than the national average, highlighting disparities in overall health outcomes. Leading health concerns include heart disease, a high drug overdose death rate of 36.9 per 100,000, and elevated firearm-related fatalities at 24.2 per 100,000, reflecting public health priorities in Missouri.
Missouri Birth Data
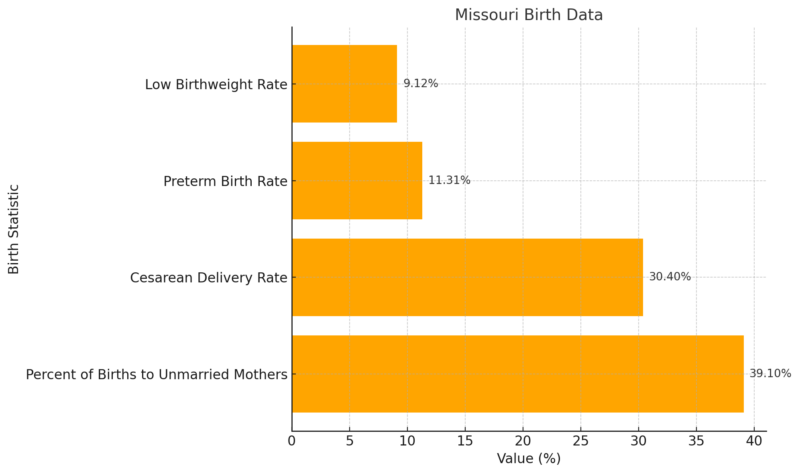
In 2022, 39.1% of births in Missouri were to unmarried mothers, a figure higher than the national average, indicating family structure trends. The Cesarean delivery rate was 30.4%, consistent with national rates.
However, the preterm birth rate of 11.31% and the low birthweight rate of 9.12% suggest ongoing issues in prenatal and maternal healthcare. Addressing these indicators will be critical for improving infant health outcomes and reducing complications at birth.
Methodology
- Data was sourced from authoritative databases like the U.S. Census Bureau, CDC, and American Immigration Council.
- The analysis included key demographic, economic, and health statistics relevant to Missouri in 2025.
- Tables were constructed for clarity, showcasing data such as population, income, and dependency ratios.
- Comparisons were made to national averages to highlight Missouri’s relative position.
- Growth trends, income disparities, and immigrant contributions were analyzed for accuracy and relevance.
- Health indicators were evaluated to identify public health priorities and concerns.
References:
-
- Missouri Population Statistics – World Population Review
- Missouri Counties Population – World Population Review – Counties
- Missouri Age Structure – Neilsberg
- Missouri Population by Race – Neilsberg
- Missouri Income Levels and Zip Codes – Income by Zip Code
- Missouri Labor Market Data – Bureau of Labor Statistics (BLS)
- Missouri Immigration Insights – American Immigration Council
- Missouri Health Statistics – Centers for Disease Control and Prevention (CDC)
Related Posts:
- What Are the Main Causes of Mortality in Missouri?
- New Mexico Population 2025 - Key Insights and Stats
- Washington State Population Boom in 2025 - Key Stats…
- North Carolina Population 2025 - Key Stats And Insights
- Indiana’s Population in 2025 Key Stats and Insights
- Kentucky Population in 2025 - Stats and Insights


