Connecticut’s population in 2025 is estimated to be 3,625,650, reflecting a slight decline at a rate of 0.11% per year according to the World Population Review.
Despite this slight growth early on, Connecticut has experienced a steady decline in recent years, making it one of only seven states with a declining population trend since 2016.
It ranks as the 29th largest state in the United States by population.
Located in the New England region of the northeastern United States, Connecticut borders New York to the west, Massachusetts to the north, and Rhode Island to the east, while Long Island Sound lies to its south, connecting it to the Atlantic Ocean.
Key Takeaways
Population By Age
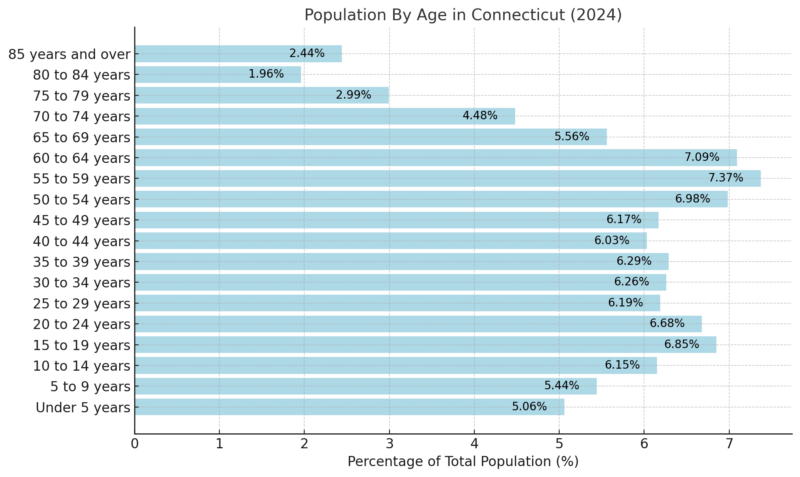
According to the 2018-2022 ACS 5-Year Estimates, the median age in Connecticut is 40.9 years.
The population distribution by age reveals that 16.65% of residents are under the age of 15, 19.72% are aged 15 to 29, 46.19% fall within the 30 to 64 age group, 14.99% are between 65 and 84 years old, and 2.44% are 85 years or older.
Population by Age Cohort and Key Stats
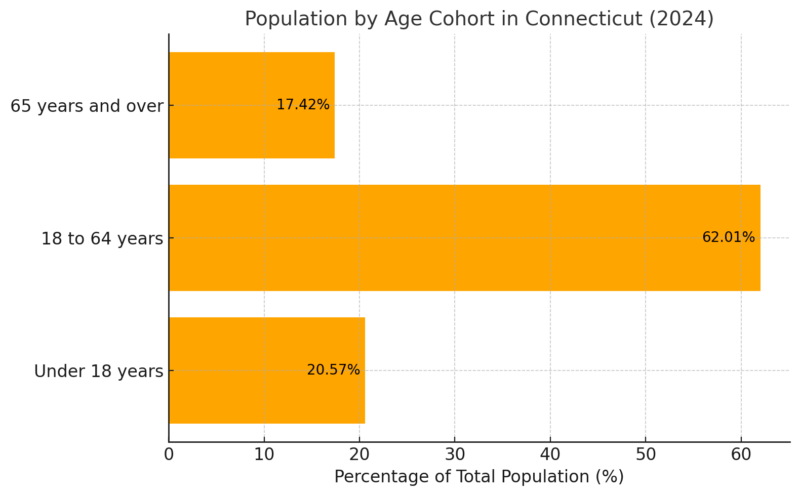
The largest cohort in Connecticut is the working-age population (18 to 64 years), making up 62.01% of the total population, slightly above the national average of 61.36%.
The population under 18 years accounts for 20.57%, which is slightly lower than the national average of 22.11%, suggesting a relatively smaller youth demographic.
The senior population (65 years and older) makes up 17.42%, slightly higher than the national average of 16.53%, indicating a slightly aging population in Connecticut.
Largest Age Group
Largest Age Group
Population
% of Total Population
55 to 59 years
266,117
7.37%
The largest single-age group in Connecticut is the 55 to 59-year cohort, which comprises 7.37% of the population.
This indicates that a significant portion of the population is nearing retirement age, which could have implications for workforce dynamics, healthcare needs, and social services in the near future.
Smallest Age Group
Smallest Age Group
Population
% of Total Population
80 to 84 years
70,912
1.96%
The smallest age group in Connecticut is the 80 to 84 years cohort, making up only 1.96% of the total population.
This reflects the natural decline in population at older ages and may indicate areas for targeted eldercare and support services, as well as the broader societal impact of an aging population.
Key Dependency Ratios
- Youth Dependency Ratio: 25.3 children aged 0-14 per 100 persons aged 15-64.
- Old-Age Dependency Ratio: 26.4 elderly persons aged 65+ per 100 persons aged 15-64.
- Total Dependency Ratio: 51.7 dependents (youth + elderly) per 100 working-age persons.
- Potential Support Ratio: 3.8 working-age individuals per senior.
Population by Race
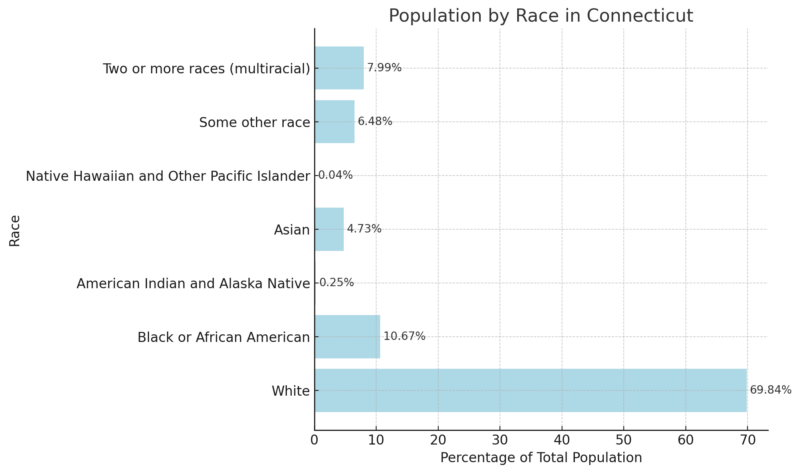
Neilsberg notes that the racial composition of Connecticut is predominantly White, with 69.84% of the population identifying as such, making it the largest racial group in the state.
The second-largest group is Black or African American, accounting for 10.67% of the population, highlighting a significant portion of diversity within the state.
Individuals identifying as Asian make up 4.73% of the population, while those categorized as American Indian and Alaska Native represent a small minority at 0.25%.
Native Hawaiian and Other Pacific Islanders is the smallest racial group, comprising just 0.04% of the population.
Connecticut Counites Population 2025
Planning Region
Population
Growth Rate (%)
Area (sq mi)
Population Density (per sq mi)
Capitol Planning Region
978,588
1.68%
396
953
Western CT Planning Region
624,957
1.07%
205
1,175
South Central CT Planning Region
567,914
0.68%
142
1,547
Naugatuck Valley Planning Region
458,666
2.09%
159
1,111
Greater Bridgeport Planning Region
328,177
1.17%
54
2,344
Southeastern CT Planning Region
280,011
0.60%
231
468
Lower CT River Valley Planning Region
176,448
1.84%
164
416
Northwest Hills Planning Region
113,649
1.29%
304
144
Northeastern CT Planning Region
97,236
2.12%
214
176
Connecticut has nine counties, with Fairfield County being the largest and the only one experiencing growth, increasing by 2.66% since 2010 to 943,823 residents (26.42% of the state’s population).
Hartford County (892,697 people) and New Haven County (857,620 people) are the next largest but are experiencing slight declines of 0.28% and 0.67%, respectively.
Windham County is the least populated (117,027 residents), followed by Tolland (150,921) and Middlesex (162,682), all of which are shrinking at rates of 1.28%, 1.51%, and 1.76%. Litchfield County is declining the fastest, losing 4.58% of its population since 2010.
While Fairfield County grows, the other counties face population declines, with Hartford and New Haven seeing the smallest decreases.
Education Levels
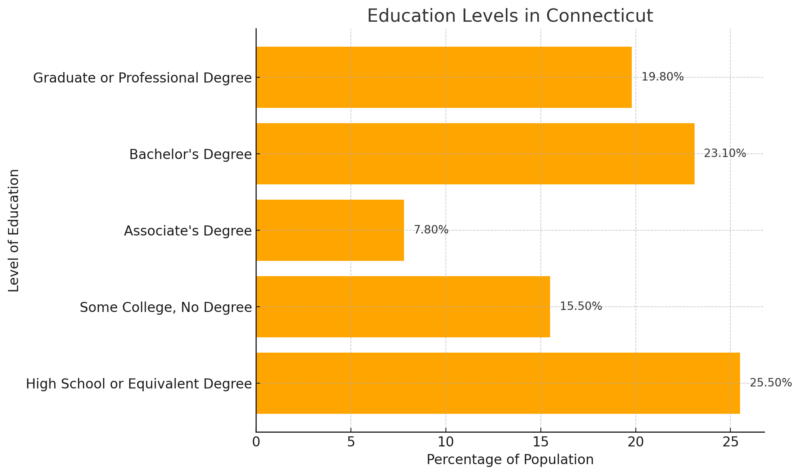
In Connecticut, 42.9% of the population aged 25 and older holds a bachelor’s degree or higher, which is significantly higher than the national average of 36.2%.
Within this group, 23.1% have attained a bachelor’s degree, and 19.8% hold a graduate or professional degree, highlighting the state’s strong educational attainment levels according to the Census Beaureu.
The high school completion rate (25.5%) and “some college, no degree” (15.5%) percentages reflect an overall well-educated population compared to many states.
School Enrollment (Population 3 Years and Over Enrolled in School)
Grade Level
Connecticut (%)
United States (%)
The margin of Error (±)
Kindergarten to 12th Grade
64.5%
67.8%
±0.8% (CT), ±0.1% (US)
In Connecticut, 64.5% of the population aged 3 years and older is enrolled in kindergarten to 12th grade, slightly below the national average of 67.8%.
The margin of error suggests a minor degree of uncertainty but still reflects a relatively comparable school enrollment rate.
These figures suggest that while Connecticut strongly focuses on education, it slightly trails the national average in this specific enrollment category.
Income and Employment
Labor Force Data (May–October 2024)
Month
Civilian Labor Force (thousands)
Employment (thousands)
Unemployment (thousands)
Unemployment Rate (%)
May 2024
1,914.5
1,832.7
81.8
4.3
June 2024
1,913.4
1,838.8
74.6
3.9
July 2024
1,907.8
1,838.5
69.3
3.6
August 2024
1,902.5
1,837.0
65.5
3.4
September 2024
1,900.4
1,839.1
61.4
3.2
October 2024
1,901.4
1,843.7
57.7
3.0
The civilian labor force in Connecticut experienced a slight decline over the six months, dropping from 1,914.5 thousand in May to 1,901.4 thousand in October.
However, employment numbers steadily increased from 1,832.7 thousand to 1,843.7 thousand, resulting in a consistent decrease in unemployment.
Connecticut’s unemployment rate dropped to 3% in October, according to a new report by the state Labor Department, which found unemployment at its lowest level in more than two decades.
Check out Capitol Dispatch Here ➡️ https://t.co/Y97BsZ4ZyU pic.twitter.com/Uysh6Vr4md
— CT Senate Democrats (@CTSenateDems) November 25, 2024
The unemployment rate dropped significantly, from 4.3% in May to 3.0% in October, indicating improved economic conditions and a stronger job market according to the BLS.
Household Income Statistics (2025)
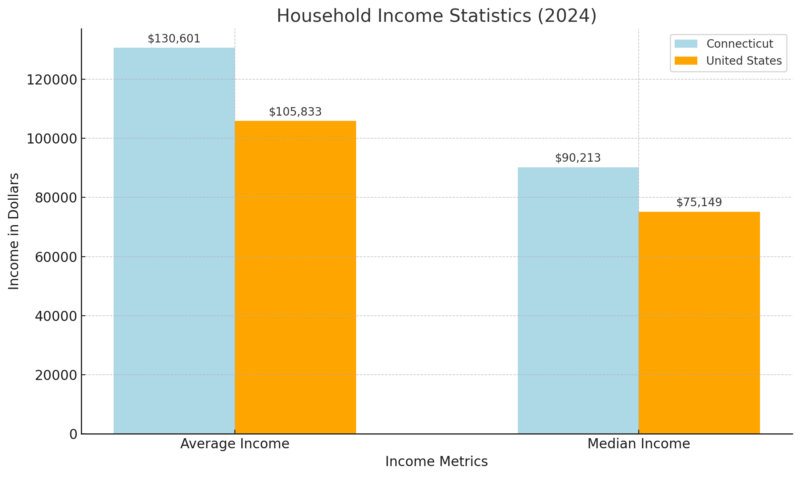
Connecticut households have significantly higher incomes compared to the national average.
The state’s average income of $130,601 is 23% higher than the U.S. average, while its median income of $90,213 is 20% higher as per Income By Zip Code notes.
This reflects Connecticut’s strong earning potential and economic standing relative to other states.
Connecticut Housing Market Overview
Metric
Value
% Change Year-Over-Year
Median Sale Price
$418,200
+5.3%
Number of Homes Sold
3,290
+1.0%
Median Days on Market
39 days
+4 days
Home prices in Connecticut increased by 5.3% year-over-year, reaching a median sale price of $418,200, which matches the national median.
The number of homes sold increased slightly by 1.0%, while the median time homes spent on the market rose by 4 days, suggesting a slightly slower pace in the market despite rising prices as per Redfin notes.
Top 10 Metros in Connecticut with the Fastest-Growing Sales Prices
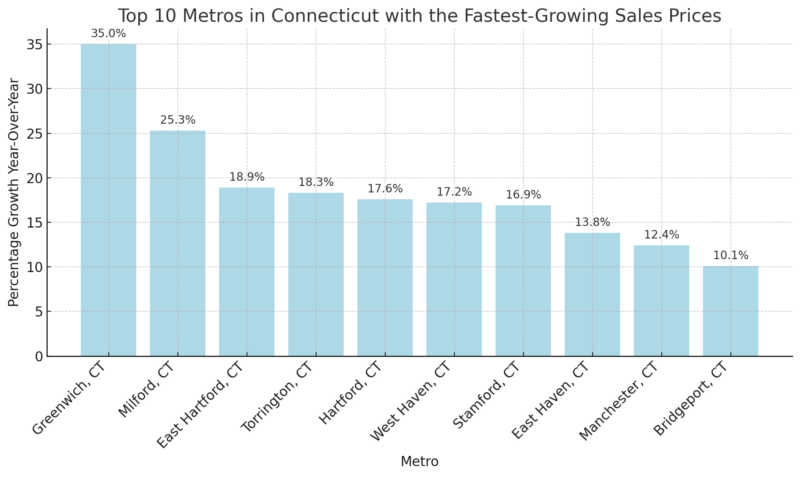
Greenwich led with the fastest-growing home prices in Connecticut at 35.0% year-over-year, indicating particularly strong demand in this upscale market.
Other areas, such as Milford (25.3%) and East Hartford (18.9%), also showed robust price growth, highlighting the competitive nature of these regions.
Connecticut Housing Supply
Metric
Value
% Change Year-Over-Year
Number of Homes for Sale
10,080
-3.2%
Number of Newly Listed Homes
3,276
-8.4%
Months of Supply
2 months
No change
The number of homes available for sale in Connecticut dropped by 3.2%, with newly listed homes falling by 8.4%, indicating tighter inventory.
The months of supply remained steady at 2 months, reflecting a seller’s market where demand continues to outpace supply.
Housing Demand
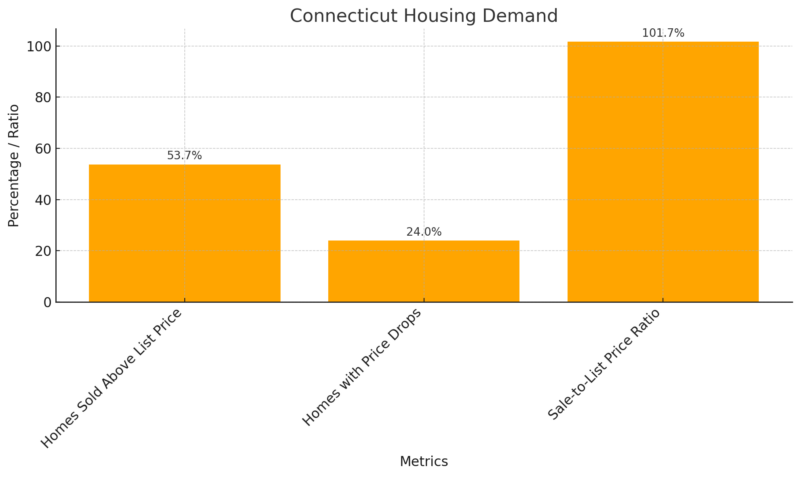
The percentage of homes sold above the list price fell to 53.7%, a drop of 6.7 points, signaling slightly reduced competition compared to the previous year.
Meanwhile, the proportion of homes with price drops rose by 5.3 points to 24.0%, indicating that sellers may be adjusting expectations in a shifting market.
However, the sale-to-list price ratio remained high at 101.7%, reflecting that most homes are still selling above their asking prices.
Top 10 Most Competitive Cities in Connecticut
City
Competition Level
Glastonbury Center, CT
High
Danielson, CT
High
Hazardville, CT
High
Putnam, CT
High
Sherwood Manor, CT
High
Brooklyn, CT
High
Plantsville, CT
High
East Brooklyn, CT
High
Weatogue, CT
High
Broad Brook, CT
High
Cities like Glastonbury Center, Danielson, and Hazardville are among the most competitive housing markets in Connecticut.
These areas likely see strong demand relative to supply, making it challenging for buyers to secure homes.
Migration and Mobility
Metric
Value
Immigrant Share of Population
15.7%
Number of Immigrant Residents
569,300
Immigrant Spending Power
$21.1 billion
Immigrant Taxes Paid
$9.0 billion
Data Year
2022
Immigrants make up 15.7% of Connecticut’s population, totaling 569,300 residents, and contribute significantly to the state’s economy with a spending power of $21.1 billion and tax contributions of $9.0 billion as per American Immigration Council notes in their report.
Demographics of Foreign-Born vs. U.S.-Born Populations
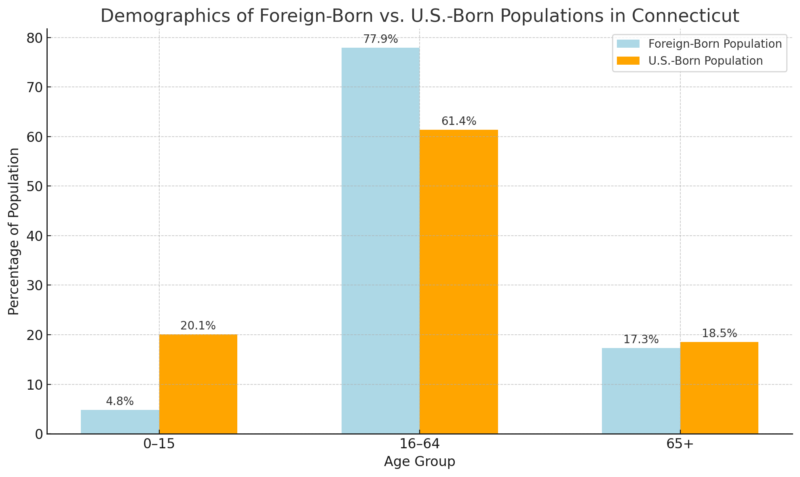
The majority of Connecticut’s immigrant population (77.9%) is of working age (16–64), compared to 61.4% of U.S.-born residents, highlighting immigrants’ significant role in the labor force.
Only 4.8% of immigrants are under 15 years old, compared to 20.1% of U.S.-born residents, reflecting a younger demographic among U.S.-born individuals.
Contributions of Immigrants to Connecticut’s Economy and Workforce
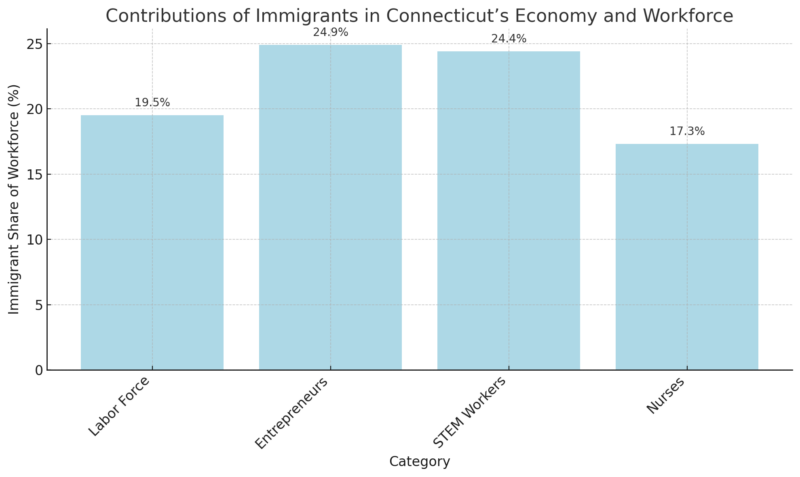
Immigrants account for a significant share of Connecticut’s workforce, including 19.5% of the overall labor force and an impressive 24.9% of entrepreneurs.
They also play critical roles in specialized fields, making up 24.4% of STEM workers and 17.3% of nurses.
These figures illustrate immigrants’ essential contributions to both the state’s economy and its critical industries.
Additional Demographics
Metric
Value
Share of U.S.-Born Residents with Immigrant Parent(s)
8.2%
Share of Immigrant Women
50.4%
Share of Immigrant Men
49.6%
Immigrant Children
32,900
U.S.-Born Residents with Immigrant Parent(s)
249,400
Share of Foreign-Born Proficient in English
81.0%
Approximately 8.2% of Connecticut’s total population comprises U.S.-born residents living with at least one immigrant parent, totaling 249,400 individuals.
The immigrant population is gender-balanced, with 50.4% women and 49.6% men.
Moreover, a large majority (81.0%) of immigrants are proficient in English, demonstrating their integration into Connecticut’s society.
Top Countries of Origin for Immigrants in Connecticut
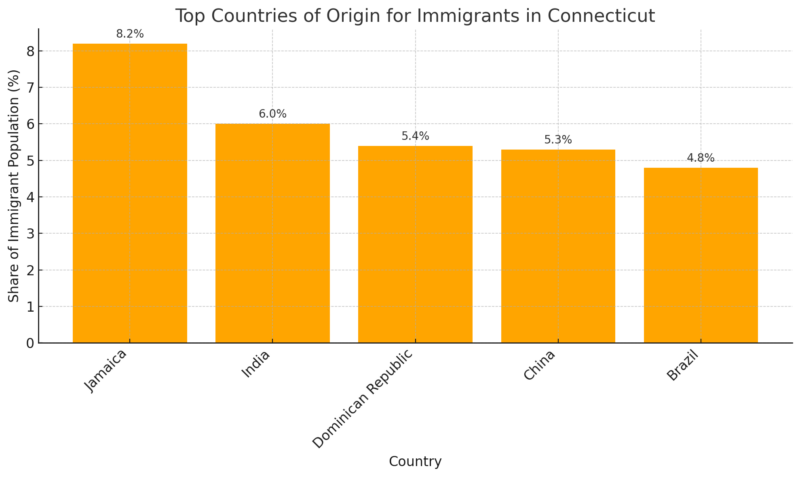
Immigrants in Connecticut come from diverse backgrounds, with the largest groups originating from Jamaica (8.2%), India (6.0%), and the Dominican Republic (5.4%).
This diversity highlights the varied cultural contributions of immigrants to the state.
Methodology
This analysis was crafted using a combination of data sources, including the U.S. Census Bureau, American Community Survey, Bureau of Labor Statistics, and Redfin.
The data was aggregated to present a comprehensive overview of Connecticut’s population, economy, and housing market trends for 2025.
We focused on providing accurate year-over-year comparisons, supplemented by regional and demographic insights to identify patterns in population dynamics, labor contributions, and economic activities.
The article was structured to distill key findings into clear, actionable statistics, ensuring that all information is relevant and backed by authoritative sources.
References
- World Population Review – Connecticut Population 2024.
- Neilsberg – Connecticut Population by Age.
- U.S. Census Bureau – Connecticut: Profile of Selected Social Characteristics.
- Redfin – Connecticut Housing Market Overview.
- American Immigration Council – Immigrants in Connecticut.
- Income By Zip Code – Connecticut Income Statistics.
- Bureau of Labor Statistics (BLS) – Economy at a Glance: Connecticut.
- World Population Review – Connecticut Counties Population 2024.


