

Kentucky has 4,606,864 residents according to the latest U.S. Census Bureau population estimates, making it the 26th most populous state in the country. The figure represents the estimated population on July 1, 2025, and is the most recent official statewide estimate available in 2026.
The state added 22,818 residents between July 2024 and July 2025, an increase of 0.50%. Kentucky has also gained more than 100,000 residents since the 2020 Census, although growth has not been evenly distributed across its 120 counties.
The latest figures tell an interesting story. Kentucky is still growing, but migration is doing much of the work. The population is getting older, several eastern counties continue to lose residents, and areas around Bowling Green, Lexington and northern Kentucky are attracting new people.
According to the U.S. Census Bureau’s Kentucky QuickFacts, residents aged 65 and older now account for 18.8% of the population, compared with 22.1% who are younger than 18. At the same time, housing prices continue to rise, even as homes spend longer on the market.
Key Statistics
| Population Indicator | Latest Figure |
|---|---|
| Total population | 4,606,864 |
| U.S. population ranking | 26th |
| Population in 2024 | 4,584,046 |
| Annual population increase | 22,818 |
| Annual growth rate | 0.50% |
| Population in 2020 | 4,505,836 |
| Population growth since 2020 | 2.2% |
| Residents younger than 18 | 22.1% |
| Residents aged 65 and older | 18.8% |
| Female population | 50.8% |
| Most populous county | Jefferson County |
| Number of counties | 120 |
The population estimates refer to specific dates rather than the number of residents counted in October 2026. The Census Bureau produces annual estimates using birth and death records, migration data and other administrative information.
Kentucky’s population remains smaller than those of neighboring Tennessee, Indiana and Missouri. Readers comparing states can find additional figures in our U.S. population statistics by state.
Population Grown Since 2020
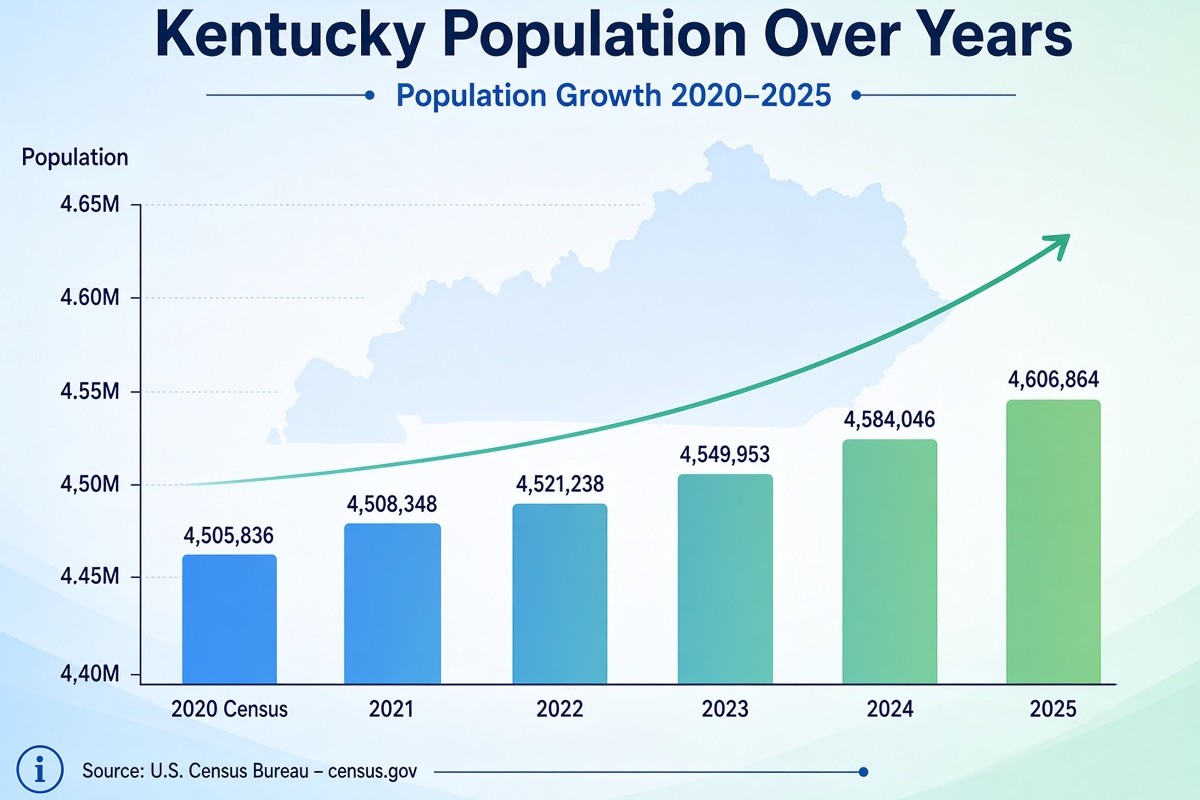
Kentucky counted 4,505,836 residents in the April 2020 Census. By July 2025, the estimated population had reached 4,606,864.
Population growth has continued throughout the first half of the decade, although the annual increases have varied considerably.
The Federal Reserve Bank of St. Louis population series, which reproduces Census Bureau estimates, provides the following figures.
| Year | Kentucky Population |
|---|---|
| 2020 Census | 4,505,836 |
| 2021 | 4,508,348 |
| 2022 | 4,521,238 |
| 2023 | 4,549,953 |
| 2024 | 4,584,046 |
| 2025 | 4,606,864 |
Kentucky gained 34,093 residents between 2023 and 2024, followed by 22,818 in the next year. The slower increase in 2025 follows a period of stronger population gains earlier in the decade.
The figures also show that Kentucky has avoided the prolonged statewide population losses experienced by some other parts of the country. Its challenge is that population growth is concentrated in certain communities, leaving other counties with fewer residents and a shrinking working-age population.
Why Is Kentucky’s Population Growing?
Migration has become an important source of population growth in Kentucky. People moving from other U.S. states and countries are adding residents at a time when the number of births is no longer substantially higher than the number of deaths.
Between July 2024 and June 2025, Kentucky recorded an estimated 52,982 births and 53,065 deaths. Deaths exceeded births by 83, leaving the state with a small natural population decrease.
Migration more than compensated for that loss.
| Component of Population Change | July 2024 to June 2025 |
|---|---|
| Births | 52,982 |
| Deaths | 53,065 |
| Natural population change | -83 |
| Net international migration | +15,709 |
| Net domestic migration | +7,269 |
The figures come from the Census Bureau’s Vintage 2025 estimates, available through the Kentucky State Data Center at the University of Louisville. Small additional adjustments in the population estimation process mean the components do not necessarily sum exactly to the final population increase.
From April 2020 through July 2025, Kentucky experienced a cumulative natural decrease of 18,600 people. During the same period, net international migration added 81,789 residents, and net domestic migration contributed another 35,818.
Without those migration gains, Kentucky would have had a smaller population than it does today.
Kentucky Population by County
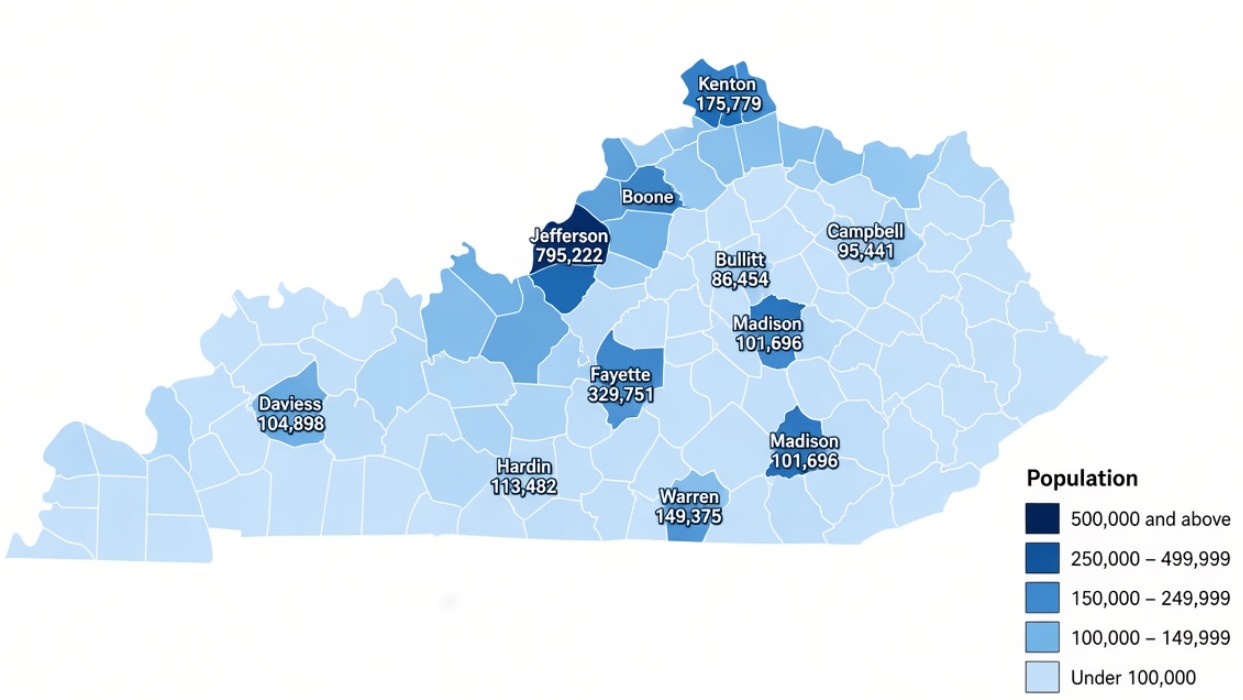
Jefferson County remains Kentucky’s largest county, with 795,222 residents in the July 2025 estimates. Fayette County follows with 329,751 residents, and Kenton County ranks third with 175,779.
The ten largest counties account for a substantial share of Kentucky’s population. They include the state’s two largest urban centers, Louisville and Lexington, along with the growing communities around Bowling Green and northern Kentucky.
The following figures come from the Census Bureau county estimates published by the Federal Reserve Bank of St. Louis.
| Rank | County | 2025 Population | 2024 Population | Annual Change |
|---|---|---|---|---|
| 1 | Jefferson | 795,222 | 794,166 | +1,056 |
| 2 | Fayette | 329,751 | 327,071 | +2,680 |
| 3 | Kenton | 175,779 | 174,441 | +1,338 |
| 4 | Warren | 149,375 | 146,566 | +2,809 |
| 5 | Boone | 145,316 | 143,490 | +1,826 |
| 6 | Hardin | 113,482 | 112,644 | +838 |
| 7 | Daviess | 104,898 | 104,275 | +623 |
| 8 | Madison | 101,696 | 99,600 | +2,096 |
| 9 | Campbell | 95,441 | 94,054 | +1,387 |
| 10 | Bullitt | 86,454 | 85,765 | +689 |
Warren County added more residents than any other county in this group between 2024 and 2025. Its population increased by 2,809, or 1.92%.
Jefferson County, despite having more than five times the population of Warren County, gained only 1,056 residents, an increase of 0.13%.
Madison County also recorded a notable increase, gaining 2,096 residents in one year. The county includes Richmond and Berea, two communities with higher education institutions and access to the Interstate 75 corridor.
Which Kentucky Counties Are Growing the Fastest?
Warren County and Madison County stand out for their recent population gains, but northern Kentucky also continues to expand.
Boone County reached 145,316 residents in 2025, an increase of 6.9% from its April 2020 estimates base. Madison County grew 9.7% over the same period, according to Census Bureau estimates.
Scott County, north of Lexington, reached 62,262 residents in 2025. Its population increased by 538 in the preceding year.
County growth should not be interpreted as proof that every local community is expanding. Residential development, commuting opportunities and housing availability influence where new residents settle.
Which Counties Have the Smallest Populations?
At the other end of the population table, Robertson County remains Kentucky’s smallest county, with just 2,325 residents in 2025.
Owsley County had 3,932 residents, followed by Hickman County with 4,372. These counties have populations smaller than many individual neighborhoods in Louisville or Lexington.
Several counties in eastern Kentucky have also experienced population losses. Pike County fell from 55,358 residents in 2024 to 54,721 in 2025, a decline of 637 people.
The loss of residents has practical consequences for local communities. A smaller population means fewer potential customers for businesses, fewer working-age taxpayers and greater pressure on services that still need to cover large geographic areas.
Kentucky Population by Age
Kentucky is getting older. Residents aged 65 and over account for 18.8% of the population, according to the latest Census QuickFacts estimates.
People younger than 18 account for 22.1%, leaving 59.1% of residents between ages 18 and 64.
| Age Group | Share of Kentucky Population |
|---|---|
| Under 18 | 22.1% |
| 18 to 64 | 59.1% |
| 65 and older | 18.8% |
The 18-to-64 figure is calculated by subtracting the two published age-group percentages from 100%. It is a population share, not an employment rate or a count of people participating in the labor force.
Another useful figure is the proportion of young children. Those younger than five represent 5.8% of Kentucky’s population.
Growing numbers of older residents affect the demand for healthcare, retirement services and long-term care. At the same time, school districts in counties losing young families must plan around smaller student populations.
Kentucky Population by Gender
Women account for 50.8% of Kentucky’s population, leaving men at 49.2%.
That works out to roughly 97 men for every 100 women. The female population has a modest numerical advantage, particularly because women tend to have longer life expectancies.
The statewide figures do not mean the same gender balance exists in every county or age group. Communities with large universities, military installations or specialized industries can have their own demographic characteristics.
Kentucky Population by Race and Ethnicity
Kentucky remains a predominantly White state, although its population includes growing Hispanic and Asian communities.
The Census Bureau reports the following racial and ethnic shares.
| Race or Ethnicity | Share of Population |
|---|---|
| White alone | 84.4% |
| Black or African American alone | 8.7% |
| Asian alone | 2.2% |
| American Indian and Alaska Native alone | 0.5% |
| Native Hawaiian and Other Pacific Islander alone | 0.1% |
| Two or more races | 4.1% |
| Hispanic or Latino, any race | 6.1% |
| White alone, not Hispanic or Latino | 79.6% |
Hispanic or Latino is an ethnicity rather than a separate racial category in Census reporting. Hispanic residents can belong to any racial group, so the Hispanic percentage should not be added to the racial percentages in the table.
Across Kentucky, 4.7% of residents were born outside the United States, according to the 2020–2024 American Community Survey figures. Another 6.8% of people aged five and older speak a language other than English at home.
The data show a state that remains less internationally diverse than the United States as a whole, but whose population growth increasingly includes people arriving from other countries.
Education Statistics
Educational attainment is an important part of Kentucky’s demographic profile, particularly for employers looking to hire workers with specialized skills.
Among residents aged 25 and older, 88.9% have completed high school or earned an equivalent qualification. The share with at least a bachelor’s degree is 27.6%.
Both figures come from the Census Bureau’s 2020–2024 American Community Survey period.
The two percentages describe overlapping groups. Adults with bachelor’s degrees are included among those who completed high school, so they should not be added together.
Kentucky’s percentage of college graduates remains below the national average. That gap is relevant to discussions about earnings, business recruitment and access to higher-paying occupations.
However, a bachelor’s degree is not the only route into skilled employment. Manufacturing, transportation, healthcare support and construction also employ workers with technical certificates, apprenticeships and other forms of training.
Employment and Unemployment in 2026
Kentucky’s unemployment rate stood at 4.7% in August 2026, according to the Kentucky Center for Statistics.
The rate was unchanged from July and 0.2 percentage points higher than in August 2025. National unemployment stood at 4.1% in the same month.
The Kentucky Education and Labor Cabinet’s August 2026 employment report provides a closer look at the state’s workforce.
| Labor Market Indicator | August 2026 |
|---|---|
| Kentucky unemployment rate | 4.7% |
| U.S. unemployment rate | 4.1% |
| Civilian labor force | 2,109,516 |
| Employed residents | 2,010,261 |
| Unemployed residents | 99,255 |
| Change in labor force from July | +5,625 |
Kentucky had 99,255 unemployed residents in August, based on the difference between the reported labor force and employment totals.
The unemployment rate measures people actively participating in the labor force who do not have jobs. It does not include every adult who is not working, such as retirees or people who are not actively seeking employment.
For readers following national trends, the Bureau of Labor Statistics August 2026 state employment release places Kentucky’s figures alongside the other 49 states and Washington, D.C.
Housing Market in 2026
Video: A detailed review of all factors affecting the housing market in Kentucky.
Kentucky’s housing market is still seeing higher prices, but buyers have more listings available than they did a year earlier.
In August 2026, the median home sale price reached $284,000, an increase of 3.3% from August 2025. The number of completed sales fell 3.4%, and homes spent a median of 50 days on the market.
According to Redfin’s Kentucky housing market data for August 2026, the number of homes available for sale increased to 19,040, up 7.6% year over year.
| Housing Indicator | August 2026 | Annual Change |
|---|---|---|
| Median sale price | $284,000 | +3.3% |
| Homes sold | 3,790 | -3.4% |
| Homes for sale | 19,040 | +7.6% |
| Median days on market | 50 | +4 days |
| Homes sold above asking price | 16.3% | -2.1 percentage points |
| Homes with price reductions | 20.9% | +2.4 percentage points |
There is a useful contrast between the statewide housing market and the longer-term Census figures.
For 2020–2024, the Census Bureau reported a median owner-occupied home value of $205,600 and median gross monthly rent of $967. The median monthly owner cost for households with a mortgage was $1,433.
Those figures describe housing costs and values over a multiyear survey period. Redfin’s $284,000 figure measures the median price of homes actually sold during August 2026, so the two numbers are not direct substitutes.
Housing affordability remains an important issue in growing counties. More residents create demand for homes, but higher borrowing costs and prices influence how many households can afford to buy.
Income and Poverty Statistics
The median household income in Kentucky was $63,726 in the 2020–2024 Census survey period, expressed in 2024 dollars.
Median income is the point at which half of households earn more and half earn less. It is not the average salary of an individual worker.
Per capita income was $35,821, and 15.6% of Kentucky residents lived below the poverty threshold.
| Economic Indicator | Kentucky |
|---|---|
| Median household income | $63,726 |
| Per capita income | $35,821 |
| Population living in poverty | 15.6% |
| Owner-occupied housing rate | 68.3% |
| Median gross monthly rent | $967 |
| Average commute to work | 24.0 minutes |
The figures help explain why population growth alone is not enough to measure economic progress. Kentucky has gained residents, but a substantial share of households still face financial pressure.
County-level income figures are also worth examining because conditions in Louisville, Lexington and northern Kentucky are not representative of every rural community.
Birth Rates, Life Expectancy and Health Statistics
Kentucky recorded a fertility rate of 60.3 births per 1,000 women aged 15 to 44 in 2024, according to the Centers for Disease Control and Prevention.
The teen birth rate was 20.4 per 1,000 females aged 15 to 19. Infant mortality stood at 5.88 deaths per 1,000 live births.
The CDC’s Kentucky health statistics, reviewed in April 2026, provide the latest final statewide figures for several birth and death indicators.
| Health Indicator | Latest Reported Value |
|---|---|
| Fertility rate | 60.3 births per 1,000 women aged 15–44 |
| Teen birth rate | 20.4 births per 1,000 females aged 15–19 |
| Infant mortality rate | 5.88 deaths per 1,000 live births |
| Preterm births | 11.74% |
| Low birthweight | 8.77% |
| Cesarean deliveries | 34.5% |
| Drug overdose death rate | 33.5 per 100,000 |
| Firearm injury death rate | 18.5 per 100,000 |
| Life expectancy at birth | 73.6 years |
Most of the CDC figures refer to 2024, the latest year for which the agency has published final data on the listed indicators. The life expectancy figure refers to 2022.
Heart disease remains the leading cause of death in Kentucky, followed by cancer and chronic lower respiratory disease.
Drug overdose deaths also remain a serious public health concern. Kentucky’s age-adjusted overdose death rate of 33.5 per 100,000 residents illustrates the continued impact of substance use disorders.
Our national analysis of drug overdose deaths in the United States provides additional context for the state figures.
The Future Trends Are Not So Clear
Kentucky enters the second half of the decade with a larger population, but its growth is being shaped by migration rather than a sustained excess of births over deaths.
The population gains are also uneven. Warren and Madison counties are expanding, Jefferson County is growing slowly, and parts of eastern Kentucky continue to lose residents.
Those changes will influence school enrollment, housing construction, healthcare demand and local tax revenue. Communities attracting new residents need additional housing and infrastructure, whereas counties with declining populations face the challenge of maintaining public services with fewer people.
The aging population is another factor. With 18.8% of residents already aged 65 or older, Kentucky will face growing demand for healthcare and support services for older adults.
International and domestic migration will continue to influence the state’s population totals. The Census Bureau’s latest figures show that new arrivals have more than offset Kentucky’s natural population decrease since 2020.
Kentucky’s next official statewide population estimate will establish how those trends continued after July 2025. For now, the verified figure of 4,606,864 residents provides the clearest measure of the state’s population in 2026.
Methodology
Population totals and demographic percentages are drawn from the U.S. Census Bureau’s Vintage 2025 estimates and American Community Survey data. County figures use the Census Bureau’s July 1, 2025 estimates, also available through the Federal Reserve Bank of St. Louis.
Employment statistics refer to August 2026 and come from the Kentucky Center for Statistics and the Bureau of Labor Statistics. Housing market figures describe August 2026 sales and listings reported by Redfin.
Income, educational attainment and household characteristics use the 2020–2024 Census survey period. Health statistics come from the CDC, with the reference year identified where it is not 2024.
Annual population estimates, decennial Census counts, household surveys and monthly economic reports measure separate aspects of Kentucky’s population. Each figure is presented with its reporting period so readers can compare figures without confusing the dates or populations being measured.
Editorial note: We used the latest available statistics from official sources. Some figures are from 2024 and 2025 because newer data has not yet been released. We will update the article as new figures become available.