
Louisville, located in Jefferson County, Kentucky, has a 2025 population of 620,004. The city is experiencing a population decline at an annual rate of -0.48% and has seen a total decrease of -1.88% since the most recent census in 2020, which recorded a population of 631,912 according to World Population Review.
However, the metro area population of Louisville in 2025 is estimated to be 1,136,000, reflecting a 0.89% increase from 2024 according to Macrotrends.
While some sources argue variations in the exact numbers for the metro area’s population, the core city remains a key driver of growth.
Key Takeaways
Age and Sex Distribution in Kentucky and Louisville
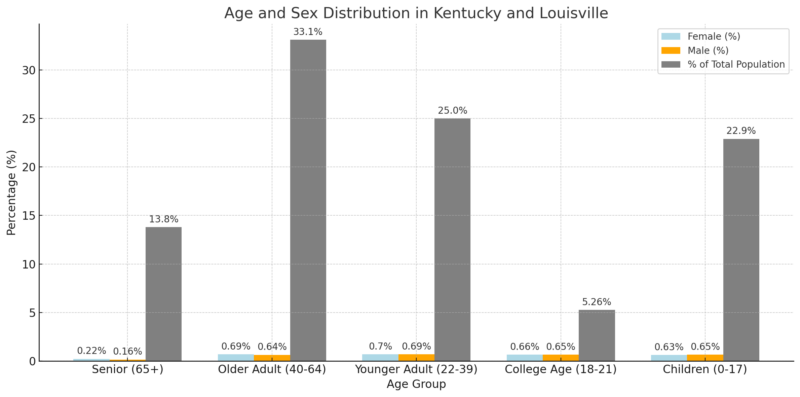
The largest segment of the population falls within the Older Adult (40-64) category at 33.1%, followed by Younger Adults (22-39) at 25.0%.
Children and Seniors comprise 22.9% and 13.8% of the population, respectively.
The distribution of males and females remains fairly balanced across all age groups, with minor variations according to Statistical Atlas.
Detailed Age and Sex Breakdown in Louisville
Age Group
Female (%)
Male (%)
% of Total Population
85+
0.08%
0.04%
1.93%
80-84
0.23%
0.14%
1.85%
75-79
0.27%
0.19%
2.34%
70-74
0.36%
0.28%
3.17%
67-69
0.44%
0.35%
2.39%
65-66
0.55%
0.49%
2.07%
62-64
0.61%
0.56%
3.52%
60-61
0.65%
0.56%
2.43%
55-59
0.74%
0.68%
7.10%
50-54
0.74%
0.69%
7.15%
45-49
0.67%
0.64%
6.53%
40-44
0.65%
0.62%
6.35%
35-39
0.62%
0.62%
6.22%
30-34
0.72%
0.70%
7.12%
25-29
0.75%
0.74%
7.49%
22-24
0.69%
0.69%
4.13%
21
0.71%
0.66%
1.37%
20
0.73%
0.69%
1.42%
18-19
0.60%
0.63%
2.46%
15-17
0.61%
0.65%
3.77%
10-14
0.64%
0.65%
6.42%
5-9
0.60%
0.63%
6.18%
0-4
0.65%
0.66%
6.55%
The highest percentages belong to ages 50-54 (7.15%) and 55-59 (7.10%), reflecting a significant portion of the older workforce and pre-retirement demographic.
The youngest age group (0-4) makes up 6.55%, indicating a steady birth rate.
The senior population (65+) accounts for nearly 14%, with a higher concentration of females in older age groups due to longer female life expectancy.
Younger adult populations (25-34) are among the largest segments, demonstrating an economically active population.
Male-to-Female Ratio in Louisville by Age Groups
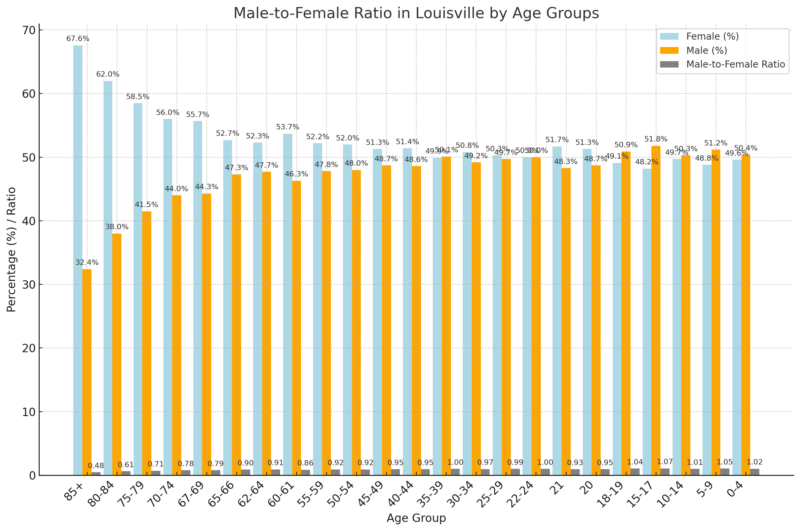
Females outnumber males significantly in older age groups (65+), particularly in the 85+ category, where 67.6% of individuals are female.
The male-to-female ratio equalizes in younger adult groups (22-34), suggesting a balanced workforce population.
Males outnumber females slightly in childhood and teenage years, but the trend shifts with age.
The increased percentage of older females is reflective of higher female life expectancy.
Race and Ethnicity Distribution in Louisville
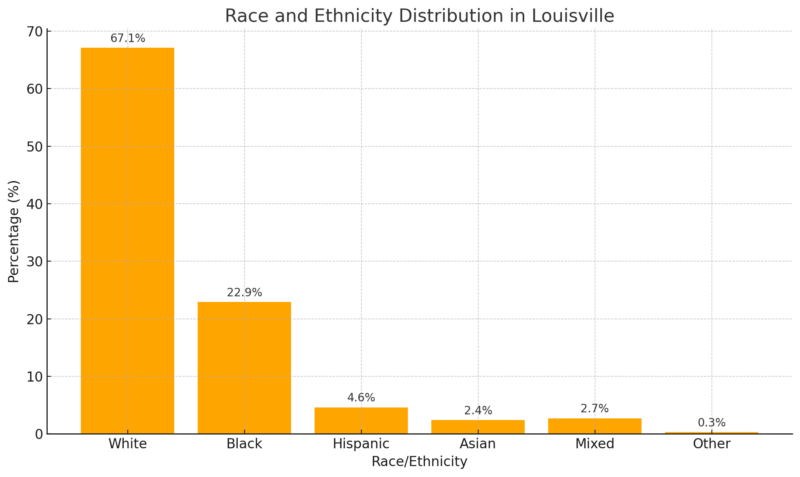
Statistical Atlas notes that the majority racial group in Louisville is White (67.1%), followed by Black (22.9%), indicating a significant representation of these communities.
Hispanic (4.6%) and Asian (2.4%) populations make up smaller but notable portions of the city.
Mixed-race individuals account for 2.7%, reflecting growing diversity.
Other racial groups (0.3%) have minimal representation.
The data showcases a diverse but predominantly White population, with notable Black and Hispanic communities contributing to the city’s demographic landscape.
Historical Population Trends
View this post on Instagram
Approximately 30% of Kentucky’s total population growth occurs in Louisville’s CSA counties. The consolidation of Louisville and Jefferson County led to an 189% population increase between 2000 and 2010.
The city’s steady growth is driven by job opportunities, a low cost of living, and affordable housing.
Additionally, migration from Kentucky’s rural areas has contributed to urban expansion, as the state’s overall growth was only 6% during the same period.
Louisville’s location at the Falls of the Ohio made it a key settlement, with the first European presence established on Corn Island in 1779.
The town charter was approved in 1781, and the city was named after King Louis XVI of France in recognition of French support during the American Revolution. However, early settlers relocated due to Indian raids in the 1780s.
By the 1800s, Louisville’s economy thrived as riverboats had to bypass the falls, leading to the city’s incorporation in 1828 with a population of 7,000.
It became a major shipping hub and a refuge for escaped slaves, later serving as a Union stronghold during the Civil War.
In World War II, Louisville played a crucial role in war production, which later evolved into manufacturing tractors and agricultural equipment.
Like many older U.S. cities, the 1960s saw suburban migration, leading to shifts in population dynamics.
Economic Impact
Unemployment rose slightly (4.4%) in Louisville while the U.S. rate remained stable (3.5%).
Wages in Louisville are below national levels across all industries and occupations.
Job growth is highest in leisure, hospitality, and service industries.
Living costs, especially housing, remain lower than the U.S. average, making it a more affordable location despite lower wages according to the BLS Economic Summary report.
Unemployment Rates (November 2024)
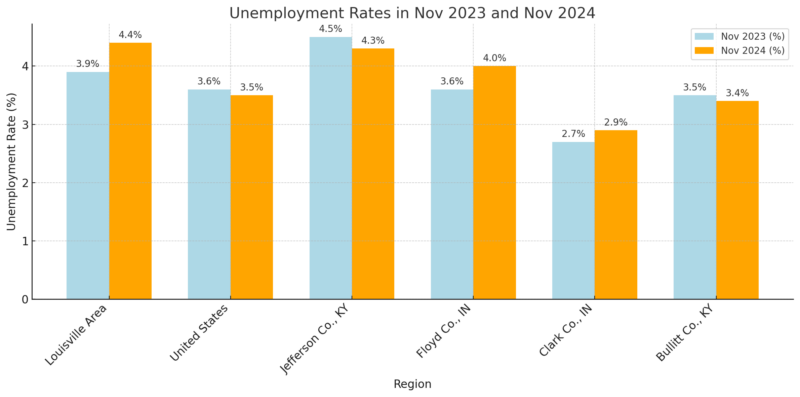
The Louisville area’s unemployment rate rose from 3.9% to 4.4%, while the national rate slightly declined from 3.6% to 3.5%.
Jefferson County (Louisville’s core) had the highest unemployment rate (4.3%) but improved from 4.5% in 2023.
Surrounding counties, particularly Clark and Floyd in Indiana, had lower unemployment levels, indicating stronger job stability in those areas.
Average Weekly Wages (Q2 2024)
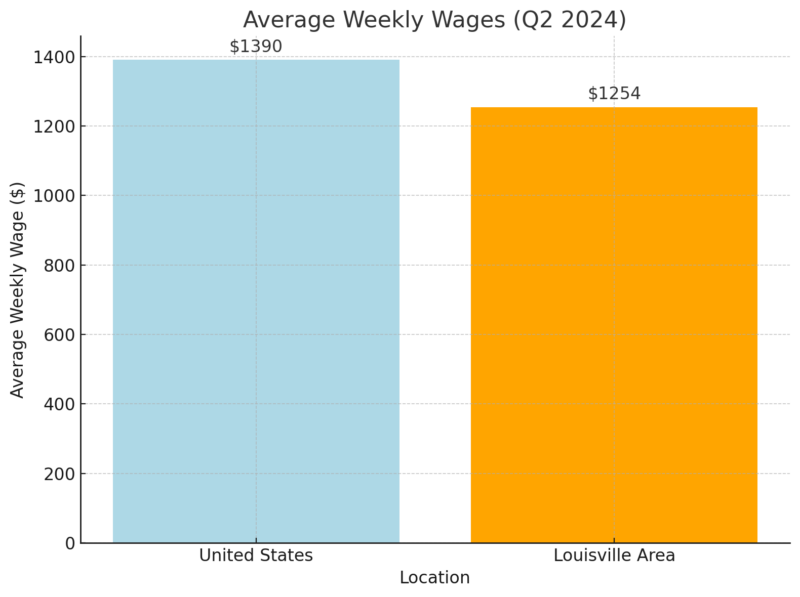
Louisville’s average weekly wage ($1,254) is lower than the national average ($1,390), suggesting a more affordable labor market with lower living costs.
This may attract businesses but could also indicate wage stagnation in comparison to national trends.
Employment by Industry in Louisville (Nov. 2024)
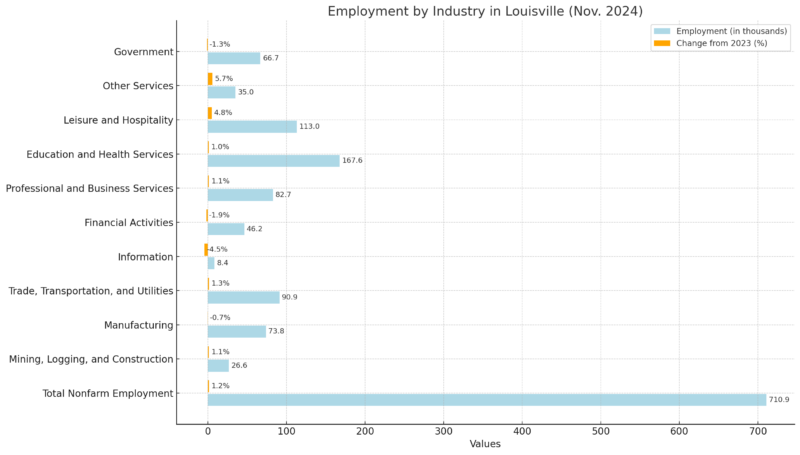
Leisure & Hospitality (4.8%) and Other Services (5.7%) saw the highest job growth, driven by tourism, events, and local businesses.
Manufacturing (-0.7%), Financial Activities (-1.9%), and Information (-4.5%) sectors experienced job declines, signaling industry shifts.
Education and Health Services remain the largest sector with 167.6K jobs, reinforcing its role as a core industry.
Average Hourly Wages for Selected Occupations (May 2023)
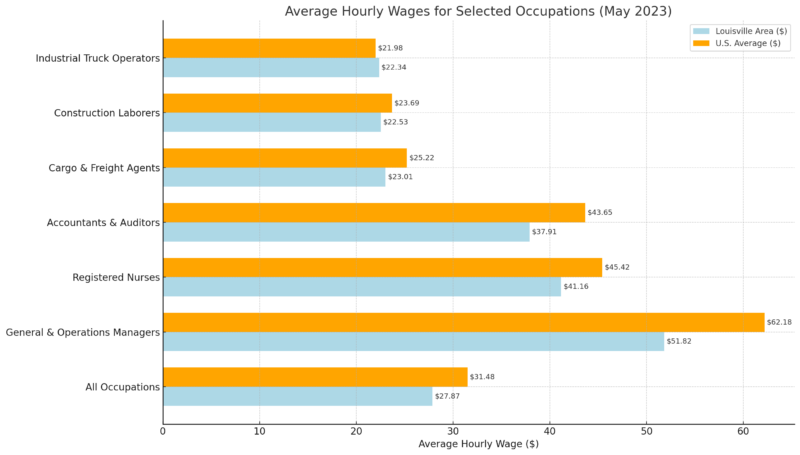
All occupations in Louisville earn below the national average, with a notable gap in management roles ($51.82 vs. $62.18).
Registered nurses ($41.16) and accountants ($37.91) earn close to the national average, reflecting competitive wages in high-demand fields.
Industrial truck operators in Louisville ($22.34) slightly outperform the national average ($21.98), showing strength in logistics and warehousing.
Employer Costs Per Hour Worked (September 2024)
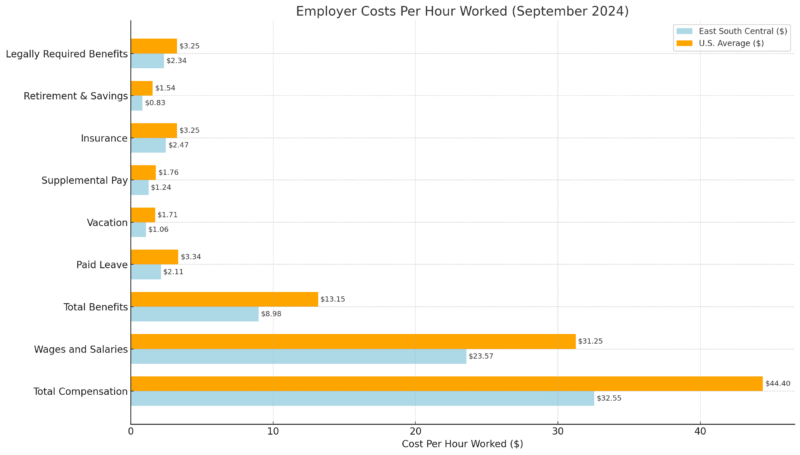
Louisville employers have lower labor costs than the national average ($32.55/hr vs. $44.40/hr), making it an attractive market for businesses.
Wages & salaries are lower than the national norm ($23.57 vs. $31.25), aligning with lower cost of living trends.
Retirement & savings contributions are nearly half the national average ($0.83 vs. $1.54), suggesting weaker long-term benefits.
Average Annual Household Spending
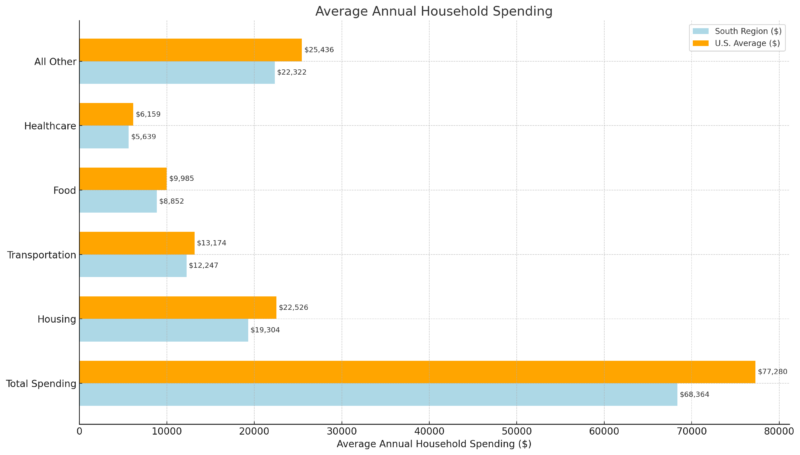
Southern households (including Louisville) spend $8,916 less annually than the national average, reflecting lower costs.
Housing costs are nearly $3,000 lower than the U.S. average, a key factor in attracting residents.
Healthcare spending is also below national levels ($5,639 vs. $6,159), indicating more affordable medical care.
12-Month Percent Change in Consumer Prices
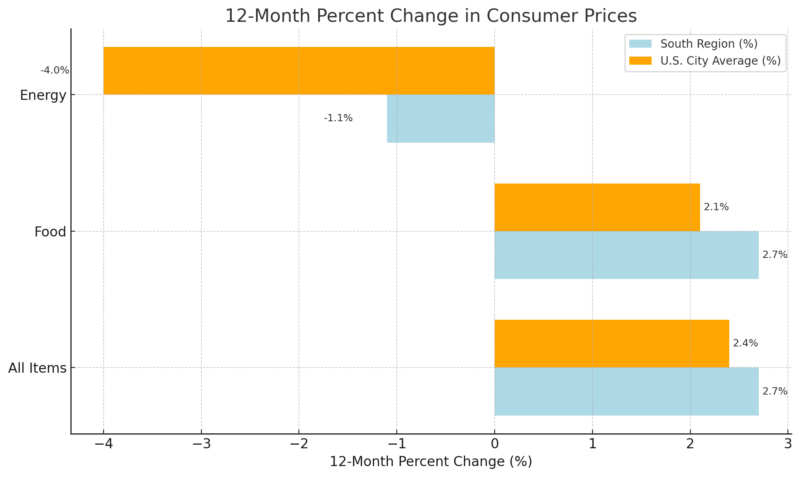
Inflation in the South (2.7%) slightly outpaces national levels (2.4%).
Food prices increased at a faster rate than the national average (2.7% vs. 2.1%).
Energy prices fell by -1.1% regionally but by a greater -4.0% nationwide.
Education and Literacy
Category
Details
Acceptance Rate
77.2%
Application Deadline
Rolling
Application Fee
$65
Full-Time Tuition (In-State)
$14,222 per year
Full-Time Tuition (Out-of-State)
$28,906 per year
Part-Time Tuition (In-State)
$791 per credit
Part-Time Tuition (Out-of-State)
$1,606 per credit
Graduate Student-to-Faculty Ratio
2.4:1
Full-Time Faculty
59
The acceptance rate of 77.2% indicates a moderately selective admissions process.
In-state students pay significantly lower tuition ($14,222/year) compared to out-of-state students ($28,906/year) according to US News.
Part-time tuition costs per credit are also higher for non-residents ($1,606 vs. $791).
A low graduate student-to-faculty ratio (2.4:1) suggests a strong faculty presence and individualized attention.
The rolling application deadline allows flexibility for applicants.
Education School Rankings & Performance
Ranking & Assessment
Score
Best Education Schools (National Rank)
#67 (tie)
Overall Score
75
Peer Assessment Score (out of 5)
3.3
Educational Professionals Assessment Score (out of 5)
3.6
Ranked #67 among 255 education schools, Louisville’s College of Education & Human Development is recognized for its academic excellence.
A peer assessment score of 3.3/5 indicates a solid academic reputation among other institutions.
@campus.insider University of Louisville @University of Louisville ?⚪️ #louisville #louisvillekentucky #cardinals #universityoflouisville #uofl #ul #kentucky #ky #cards #fyp #foryou #foryoupage #college #collegecampus #campus #university #collegeadmissions #collegeadvice ♬ Stolen Dance (Instrumental) – Milky Chance
The educational professional’s assessment score of 3.6/5 suggests strong approval from professionals in the field.
With Bachelor’s, Master’s, Ph.D., and certificate programs, the university provides diverse education pathways.
Housing and Living Conditions
Key Housing Market Metrics
Metric
Value
Year-over-Year Change (%)
Median Sale Price
$255,000
+9.3%
Median Sale Price per Sq. Ft.
$157
+9.0%
Number of Homes Sold
716
+13.5%
Median Days on Market
36
-3 days
The median sale price in Louisville rose by 9.3%, indicating a strong appreciation in home values.
Redfin notes that the price per square foot also increased by 9.0%, reinforcing rising housing costs.
Homes are selling faster, with the median time on the market dropping from 39 days to 36 days compared to last year.
Home sales increased by 13.5%, suggesting higher demand despite rising prices.
The Louisville market remains competitive, with homes receiving an average of two offers before selling.
Methodology
Data sourced from authoritative reports, including the U.S. Census, BLS, Redfin, and Macrotrends.
Population trends were analyzed using the World Population Review and Statistical Atlas.
Housing trends derived from real estate sales reports and pricing data.
Economic indicators sourced from the Bureau of Labor Statistics (BLS).
University rankings and tuition data pulled from U.S. News & World Report.
Insights summarized based on year-over-year changes and expert assessments.
References
- World Population Review – Louisville, Kentucky Population 2025
- Macrotrends – Louisville Metro Area Population 1950-2025
- Statistical Atlas – Age and Sex Distribution in Louisville
- Statistical Atlas – Race and Ethnicity in Louisville
- U.S. Bureau of Labor Statistics (BLS) – Louisville Area Economic Summary
- U.S. News & World Report – University of Louisville – Best Education Schools Rankings
- Redfin – Louisville Housing Market Trends