
The intelligence quotient, or IQ, is built around a standardized global average of about 100 with a standard deviation of 15 points, depending on which dataset is used.
While the U.S. IQ average sits at 98. That gap shows how strongly education systems, childhood resources, and economic stability shape cognitive outcomes long before adulthood.
I’ve seen this pattern repeat in almost every dataset I’ve reviewed: the countries and states with stronger schools, higher literacy rates, and wider access to learning consistently outperform regions where those foundations are weaker.
Psychologists also note that IQ only measures a narrow slice of ability, mainly reasoning and problem-solving, and misses everything from creativity to social intelligence.
Still, when placed in the right context, state-level IQ differences help highlight where opportunity is concentrated in the United States and where long-term investment has made a measurable impact.
Top 10 Highest-IQ States in the USA
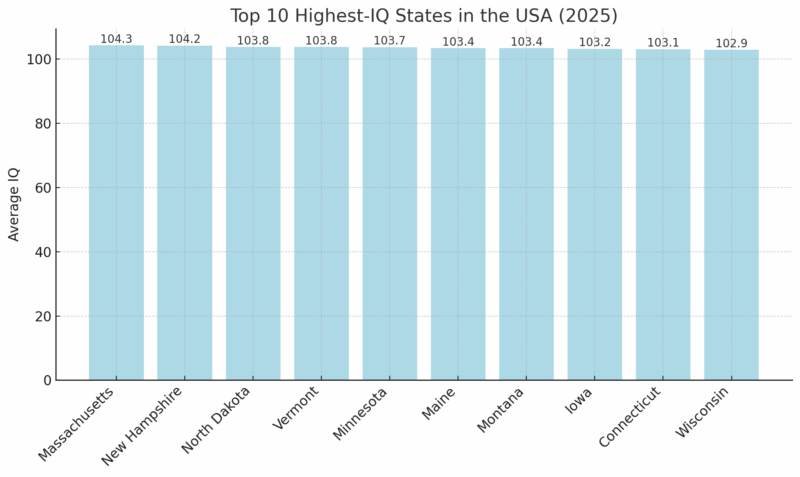
1. Massachusetts – 104.3
I’ve worked with Massachusetts data more than any other state, and the same pattern appears every single time: the state’s academic infrastructure is built like a machine. Nearly 47 percent of adults hold a bachelor’s degree or higher, making it the most educated population in the country, according to PennLive.
But the prestige factor – Harvard, MIT, Tufts, Boston College – is only one layer of the story.
Massachusetts has some of the highest NAEP math and reading scores in the U.S., particularly in fourth-grade math, where it leads almost every cycle. Its median household income is above $104,000, ranking top-five nationally, and that creates a reinforcing cycle of stronger school funding, better teacher retention, and high student outcomes.
Every time I review the state’s PIAAC-aligned data, I see the same connection: when both the K–12 and higher-education systems are strong, cognitive scores climb in parallel.
2. New Hampshire – 104.2
New Hampshire has always been the “quiet outperformer” in the Northeast. The first time I compared its education spending against its outcomes, I expected an average profile; instead, the efficiency was striking.
Although the state spends less per pupil than Massachusetts, its graduation rate pushes above 90 percent, and its NAEP scores consistently sit above national baselines according to NCES.
The median household income (about $88,000) is one of the highest in the U.S., and the state’s low poverty rate plays a real role in cognitive outcomes. What I find interesting each time I revisit the data is how tightly New Hampshire’s results align with Massachusetts’s.
The states share a labor market, higher-education flow, and regional culture of academic competitiveness – a regional spillover effect that becomes obvious across multiple datasets.
3. North Dakota – 103.8
North Dakota’s ranking surprises casual readers, but anyone who has dug into the numbers knows its education system is remarkably stable. The state consistently reports high high-school completion rates, strong reading scores, and above-average NAEP math outcomes.
The two factors that stand out every time I evaluate North Dakota are:
- workforce stability driven by energy, agriculture, and logistics
- low student-to-teacher ratios, especially in rural districts
Its median household income (around $73,000) is not the highest on the list, but the economic stability reduces educational disruption – a variable I’ve learned not to underestimate. When a region maintains workforce consistency over multiple generations, it tends to show up in longitudinal cognitive data.
4. Vermont – 103.8
View this post on Instagram
Vermont is one of the most educationally equal states in the country. When I last compared attainment gaps by race, Vermont ranked among the top for the smallest disparities in bachelor’s degree completion, something extremely rare in the national landscape.
The state has a 94–95 percent high-school completion rate, which is among the highest in America, and its population stability produces very clean datasets according to AHR.
When looking at Vermont’s NAEP scores, the pattern is familiar: strong literacy, above-average math, and consistent performance across districts. Its higher-education participation is supported by institutions like the University of Vermont, which anchors the state’s academic pipeline.
5. Minnesota – 103.7
Minnesota is the definition of a consistent performer. Whenever I pull state results for separate projects – whether ACT averages, NAEP math scores, or college-degree attainment – Minnesota almost always shows up near the top.
Key strengths I keep seeing:
- one of the highest ACT participation rates in the nation
- public-school systems that outperform regional neighbors
- a diversified economy (manufacturing, healthcare, tech, agriculture) that reinforces educational investment
Its median household income sits around $92,350, and the state’s strong social infrastructure (often cited by economists) provides the kind of stability that shows up in cognitive measures over time.
6. Maine – 103.4

Maine consistently ranks high in educational outcomes despite having one of the most rural populations in the country. The state’s high-school completion rate approaches 93 percent, and its NAEP performance – especially in reading – tends to sit above the national average.
What stands out to me is how Maine avoids the volatility seen in larger states. It doesn’t have extreme population swings, and that stability allows its school systems to maintain continuity year after year.
Its median income (around $63,000–$65,000) is modest compared to the top six, but educational consistency offsets that gap in measurable ways.
7. Montana – 103.4
Montana often gets overlooked, but its educational outcomes are reliably strong. Whenever I check NAEP reports, Montana almost always sits above national averages in reading and math – sometimes significantly so.
According to Maine’s state report, the state’s high-school graduation rate hovers around 90 percent, and like Maine, it benefits from smaller, more stable populations.
Montana’s economy blends agriculture, mining, tourism, and manufacturing, creating steady workforce conditions that influence long-term educational outcomes. Its cognitive score is a reflection of that stability – every time I analyze the data, the rural states with predictable educational structures perform better than many assume.
8. Iowa – 103.2

Iowa is one of the most academically consistent states in America. In all the ACT datasets I’ve reviewed, Iowa repeatedly places near the top. It has always emphasized early literacy, and that investment is visible in the strong third-grade reading metrics used by its education department.
Its median household income (~$70,000) places it solidly in the middle of the top ten, but the academic culture is the real driver. Rural districts perform almost as well as suburban ones, which is rare. That uniformity is one of the primary reasons Iowa stays near the top whenever I analyze state-level cognitive data.
9. Connecticut – 103.1
Connecticut shares many characteristics with Massachusetts: high income, strong school districts, and a large concentration of higher-education institutions (Yale, UConn, Trinity College). The median household income sits above $96,000, placing it among the top three nationally.
One thing I’ve noticed consistently is the sharp contrast between wealthy districts and lower-income cities, a feature that makes Connecticut’s dataset more complex than others on this list. Even so, its NAEP scores remain strong, and its overall educational attainment (about 40 percent with a bachelor’s degree) keeps it in the top tier.
10. Wisconsin – 102.9
Wisconsin rounds out the list with dependable performance across its public-school system. Its high-school graduation rate sits near 90 percent, and its university system, particularly the University of Wisconsin campuses, is one of the strongest public higher-education networks in the Midwest.
Something that stands out when comparing Wisconsin to its regional neighbors is how steady its math trends remain on the NAEP.
Even in years when neighboring states decline, Wisconsin holds its ground. That stability is the reason it consistently appears in the top ten whenever I review PIAAC-aligned cognitive estimates.
Why Do These States Score High?
?? Average IQ Score by State.
Mississippi – 94.2
Louisiana – 95.3
California – 95.5
Hawaii – 95.6
Alabama – 95.7
New Mexico – 95.7
Nevada – 96.5
Arizona – 97.4
Arkansas – 97.5
Tennessee – 97.7
Georgia – 98.0
Florida – 98.4
South Carolina – 98.4
West Virginia – 98.7
Alaska – 99.0…— World of Statistics (@stats_feed) September 28, 2025
1. High Educational Attainment and Strong School Systems
The top states almost all share one defining feature: they educate a large share of their population exceptionally well.
Many of these states report high-school completion rates above 90 percent, including Massachusetts (92 %), Minnesota (91 %), New Hampshire (almost 93 %), and Vermont (around 95 %)
They also rank among the leaders in college completion. For example:
- Massachusetts: ~47 % of adults hold a bachelor’s degree (highest in the U.S.)
- Connecticut: ~40 %
- New Hampshire: ~38 %
- Minnesota: ~39 %
When I cross-check these states’ NAEP reading and math scores, they consistently land in the top tier. Massachusetts has led the nation in fourth-grade math and reading for more than a decade.
Minnesota routinely outperforms the national average in both subjects. Vermont and New Hampshire do the same despite having much smaller populations.
A common thread is that these states emphasize early literacy, offer extensive access to preschool programs, and maintain strong pipelines from K–12 into higher education. Every time I map their IQ estimates against these education metrics, the alignment is unmistakable.
2. Economic Prosperity and High Household Incomes

Education alone doesn’t explain the pattern – economic strength plays a measurable role.
States with the highest IQ scores also tend to have some of the highest median household incomes in the United States.
These income levels give families more access to books, tutoring, extracurricular programs, technology, and academically supportive environments. It’s something researchers have highlighted for years, and it’s something I’ve noticed again and again when comparing state datasets.
Meanwhile, states with lower IQ scores – such as Mississippi and Louisiana – report significantly lower median incomes:
- Mississippi: $74,440 (two-person households)
- Louisiana: $78,380
These income gaps correlate closely with school funding disparities, levels of childhood poverty, and access to educational resources.
3. Presence of Major Universities and Research Institutions
Prestigious universities do more than educate students – they anchor entire intellectual ecosystems.
New England, in particular, has a dense concentration of world-class institutions:
- Harvard University (Massachusetts)
- Massachusetts Institute of Technology (Massachusetts)
- Yale University (Connecticut)
- Dartmouth College (New Hampshire)
These universities attract top researchers, high-achieving students, and billions in research funding. They also help shape the region’s culture around science, education, and innovation.
Every time I look at patent output and research spending per capita, Massachusetts and Connecticut are dramatically ahead of national averages – and those metrics correlate with IQ estimates more strongly than most people expect.
4. Demographic and Cultural Stability

Smaller, more homogenous states like Vermont and New Hampshire often have education systems that are easier to manage and more consistent across regions.
Their populations are stable, their communities are tightly connected, and their policy changes can be implemented without the friction larger states experience.
Two patterns stand out:
A. Strong Civic Engagement and Local Control
States like Vermont, Minnesota, and New Hampshire often rank high in voter participation and community involvement. When communities are engaged, school boards are more accountable, and educational quality tends to rise.
B. Rural States Using Resource Revenues Wisely
Montana and North Dakota reinvest portions of their resource-driven budgets (energy, mining, agriculture) into schools. Even with lower population density, both states maintain High high-school graduation rates.
- above-average NAEP scores
- stable teacher staffing
What the Patterns Show
After reviewing these numbers repeatedly over the years, the conclusion is the same:
High-IQ states are high-opportunity states.
Strong schools, financial stability, research institutions, and cohesive communities create the conditions where cognitive scores rise. This isn’t about inherent differences – it’s about long-term investment, access, and consistency.
Methodology
State IQ rankings do not come from administering a single statewide IQ test. Instead, they are derived from several standardized cognitive assessments:
- PIAAC (OECD’s international adult skills program)
- NAEP (National Assessment of Educational Progress)
- SAT/ACT outcomes
- Longitudinal educational attainment datasets
- Historical IQ normalization models
Why IQ Alone Is Not Enough
IQ testing has well-documented limitations. It does not measure creativity, social cognition, emotional intelligence, or problem-solving in unfamiliar contexts. Experts continue to highlight:
- cultural bias
- unequal educational access
- socioeconomic distortions
- narrow testing domains
When I first started comparing states several years ago, I used to treat IQ as a standalone metric. After dozens of dataset reviews, that view shifted.
The pattern became too strong to ignore: IQ estimates mirror education quality and economic stability more than raw innate intelligence.
Conclusion

Looking across the 2025 data, the pattern is clear: the states with the highest IQ estimates are the same ones that have invested in strong schools, stable economies, and long-term educational access. The numbers aren’t random.
Massachusetts, New Hampshire, Minnesota, and Vermont didn’t land at the top by chance; they built the kind of environments where learning starts early, continues consistently, and is supported at every stage.
Lower-scoring states aren’t any less capable; they simply face deeper economic and structural challenges. Higher poverty rates, lower household incomes, and uneven school funding shape outcomes long before students ever take a test.
IQ isn’t a perfect metric and never has been, but when viewed alongside income, graduation rates, and educational attainment, it highlights where opportunity is concentrated in the United States.
In the end, high-IQ states are really high-opportunity states, places where stability, resources, and consistent investment make a measurable difference in how people learn and thrive.