

What it means to be middle class in America right now depends entirely on where you live. The average middle class income does not represent the same value in each state. In some of them, it won’t be enough even for regular needs, especially for famillies with kids.
For instance, a $100,000 household income stretches toward the upper limits of comfort in Mississippi. However, that exact same income barely hits the midpoint in California, and it actually falls below the median household income in places like Massachusetts and New Jersey.
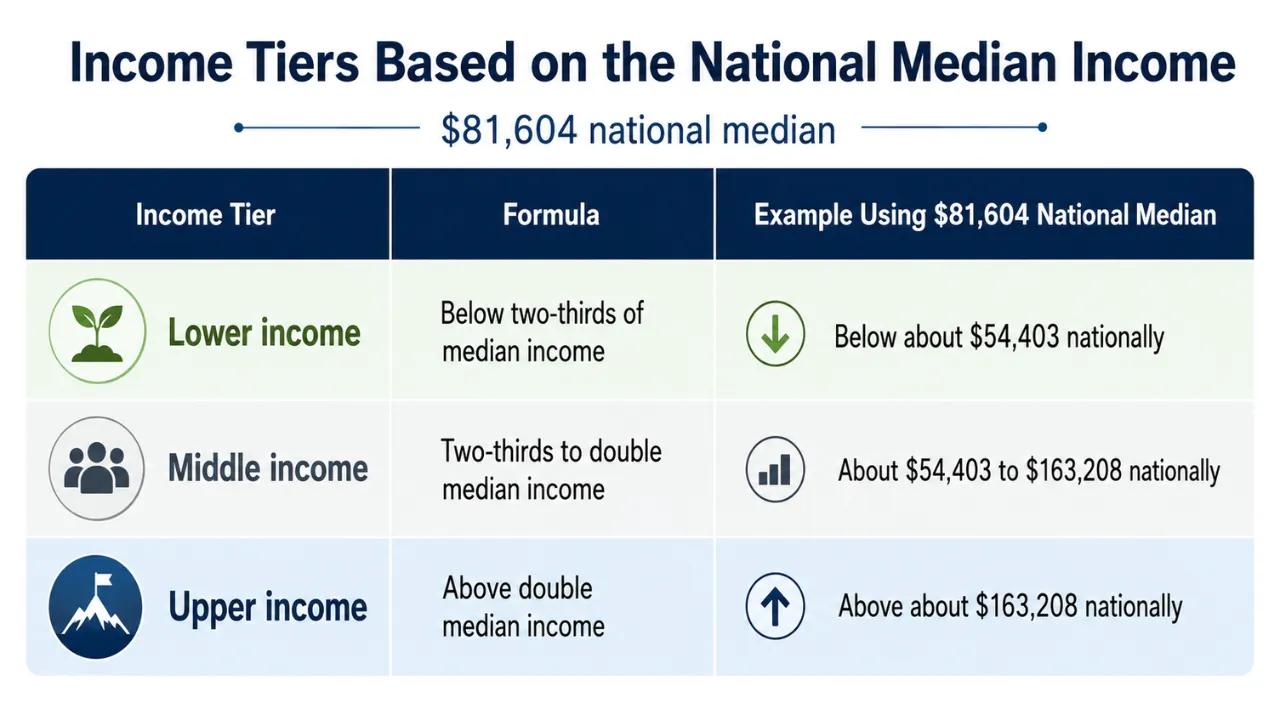
A closer look at the data shows exactly how these financial lines are drawn. The latest SmartAsset 2026 middle-class study, which analyzes the U.S. Census Bureau’s American Community Survey data, defines the middle class using a standard economic formula.
Under this rule, a household falls into the middle class when earning between two-thirds and double its state’s median household income. Reporting from Yahoo Finance also covered the same 2026 state data, highlighting the stark and growing regional disparities in what it takes to maintain a middle-class lifestyle today.
On a national level, the average middle class income is between $54,403 and $163,208, built around a U.S. median household income of $81,604. If you take the midpoint of that national range, you get about $108,806. This number serves as a realistic average for middle-class earnings, even as the official median baseline sits a bit lower.
But the gap between the highest and lowest-cost states is massive. Mississippi charts the lowest entry point for the middle class, with a range of $39,418 to $118,254.
On the flip side, Massachusetts sets the highest bar, requiring anywhere from $69,885 to $209,656. High-cost strongholds like New Jersey, Maryland, Hawaii, and California also see their upper middle-class tiers stretch past the $200,000 mark.
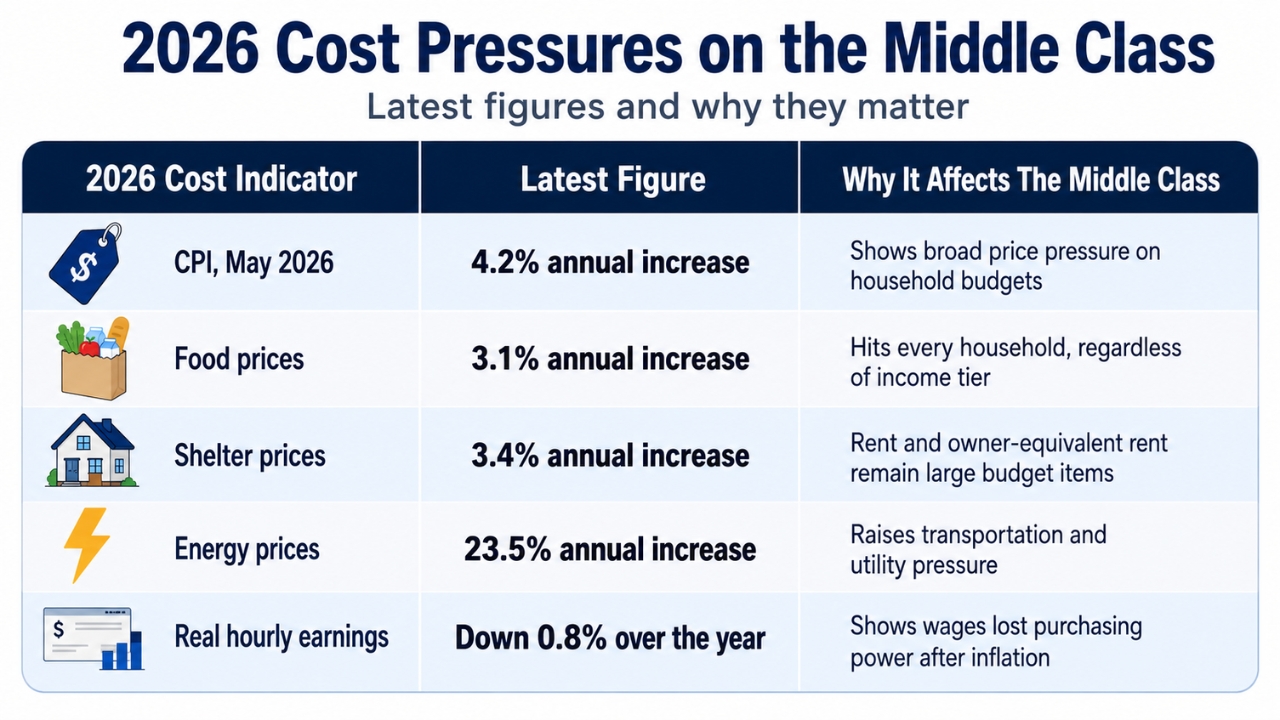
Of course, a salary number only tells half the story because everyday expenses dictate the rest. According to the Bureau of Labor Statistics May 2026 CPI report, consumer prices climbed 4.2% over the past year. Families are feeling that hit directly, with grocery bills up 3.1%, housing up 3.4%, and energy costs jumping a staggering 23.5%.
The average 30-year fixed mortgage rate rose to 6.52% for the week ending June 11, up from 6.48% the prior week, as a stronger-than-expected jobs report and inflation hitting a three-year high of 4.2% dimmed prospects for a Fed rate cut this year.
Read: https://t.co/8MX5HKcddL pic.twitter.com/GbqMRX958i
— Realtor.com (@realtordotcom) June 11, 2026
Buying a home does not offer much relief either. Data from Freddie Mac shows the average 30-year fixed mortgage rate holding at 6.52% for the week of June 11, 2026, while Zillow places the average U.S. home value at $370,320 after a 0.7% increase over the last 12 months.
A salary might place a family in a comfortable statistical bracket on paper, but the costs of housing, childcare, insurance, groceries, and healthcare are what determine whether a household is truly financially secure or just getting by.
What Defines the Middle Class Today?
Measure
2026 Figure
What It Means
National median household income
$81,604
The midpoint for U.S. household income in the Census ACS benchmark used in the 2026 calculation
National middle-class range
$54,403 to $163,208
Two-thirds to double the national median household income
Midpoint of the national middle-class range
$108,806
A rough average inside the middle-class band
Lowest state middle-class range
Mississippi: $39,418 to $118,254
The lowest state range in the 2026 SmartAsset data
Highest state middle-class range
Massachusetts: $69,885 to $209,656
The highest state range in the 2026 SmartAsset data
The highest city range in the SmartAsset study
San Jose, California: $98,817 to $296,452
Shows how much local metro costs and incomes can exceed state averages
As you can see, the average middle-class income in the United States currently sits around $108,806, assuming you look at the exact midpoint of the national middle-class bracket.
However, the most accurate answer requires looking at state-by-state and local data. A salary that secures a comfortable life in Cleveland, Memphis, or rural West Virginia simply will not buy the same lifestyle in high-cost cities like Boston, San Jose, Dallas, Miami, or Honolulu.
Most researchers define the middle class by looking at the median income in a specific area.
Take the Pew Research Center, for example. Their setup puts middle-income households between two-thirds and double the local median, adjusting those numbers based on how many people live in the house.
SmartAsset uses the same two-thirds to double rule for every state. It is a straightforward way to look at the numbers, and it does a great job of showing how much life changes from one state to the next.
The gap between the top and bottom of this bracket is huge because the middle class is not one-size-fits-all.
A family on the lower end might rent their home, carry some debt, and have zero savings. Another family near the top might own a house and save for retirement, but still stress over childcare bills or a medical emergency. Even though their lives look totally different, the math groups them together.
Also, talking about an average middle-class income usually confuses people because averages and medians are different things.
A regular average can look way higher than it actually is because a few mega-rich earners pull the number up. That is why economists stick to the median household income. It tells you where the actual middle of the population sits.
What it Takes to Be Middle Class in Every State?
Where you live completely changes what it takes to be middle-class.
In cheaper states, a modest income secures a spot in the middle tier, while high-cost states require near-six-figure earnings just to get through the door.
Every state runs on a completely different budget, so the income brackets follow suit.
State
Low End Of Middle Class
High End Of Middle Class
Median Household Income
Alabama
$44,439
$133,318
$66,659
Alaska
$63,777
$191,330
$95,665
Arizona
$54,324
$162,972
$81,486
Arkansas
$41,404
$124,212
$62,106
California
$66,766
$200,298
$100,149
Colorado
$64,742
$194,226
$97,113
Connecticut
$64,033
$192,098
$96,049
Delaware
$58,356
$175,068
$87,534
Florida
$51,823
$155,470
$77,735
Georgia
$53,327
$159,982
$79,991
Hawaii
$67,163
$201,490
$100,745
Idaho
$54,111
$162,332
$81,166
Illinois
$55,474
$166,422
$83,211
Indiana
$47,973
$143,918
$71,959
Iowa
$50,334
$151,002
$75,501
Kansas
$50,343
$151,028
$75,514
Kentucky
$43,017
$129,052
$64,526
Louisiana
$40,657
$121,972
$60,986
Maine
$50,961
$152,884
$76,442
Maryland
$68,603
$205,810
$102,905
Massachusetts
$69,885
$209,656
$104,828
Michigan
$48,259
$144,778
$72,389
Minnesota
$58,078
$174,234
$87,117
Mississippi
$39,418
$118,254
$59,127
Missouri
$47,726
$143,178
$71,589
Montana
$50,227
$150,680
$75,340
Nebraska
$50,917
$152,752
$76,376
Nevada
$54,089
$162,268
$81,134
New Hampshire
$66,521
$199,564
$99,782
New Jersey
$69,529
$208,588
$104,294
New Mexico
$45,211
$135,632
$67,816
New York
$57,213
$171,640
$85,820
North Carolina
$49,305
$147,916
$73,958
North Dakota
$51,914
$155,742
$77,871
Ohio
$48,141
$144,424
$72,212
Oklahoma
$44,099
$132,296
$66,148
Oregon
$56,813
$170,440
$85,220
Pennsylvania
$51,697
$155,090
$77,545
Rhode Island
$55,669
$167,008
$83,504
South Carolina
$48,233
$144,700
$72,350
South Dakota
$51,254
$153,762
$76,881
Tennessee
$47,998
$143,994
$71,997
Texas
$53,147
$159,442
$79,721
Utah
$64,439
$193,316
$96,658
Vermont
$55,153
$165,460
$82,730
Virginia
$61,393
$184,180
$92,090
Washington
$66,259
$198,778
$99,389
West Virginia
$40,532
$121,596
$60,798
Wisconsin
$51,659
$154,976
$77,488
Wyoming
$50,355
$151,064
$75,532
Top 10 States Where the Middle Class Earns the Most
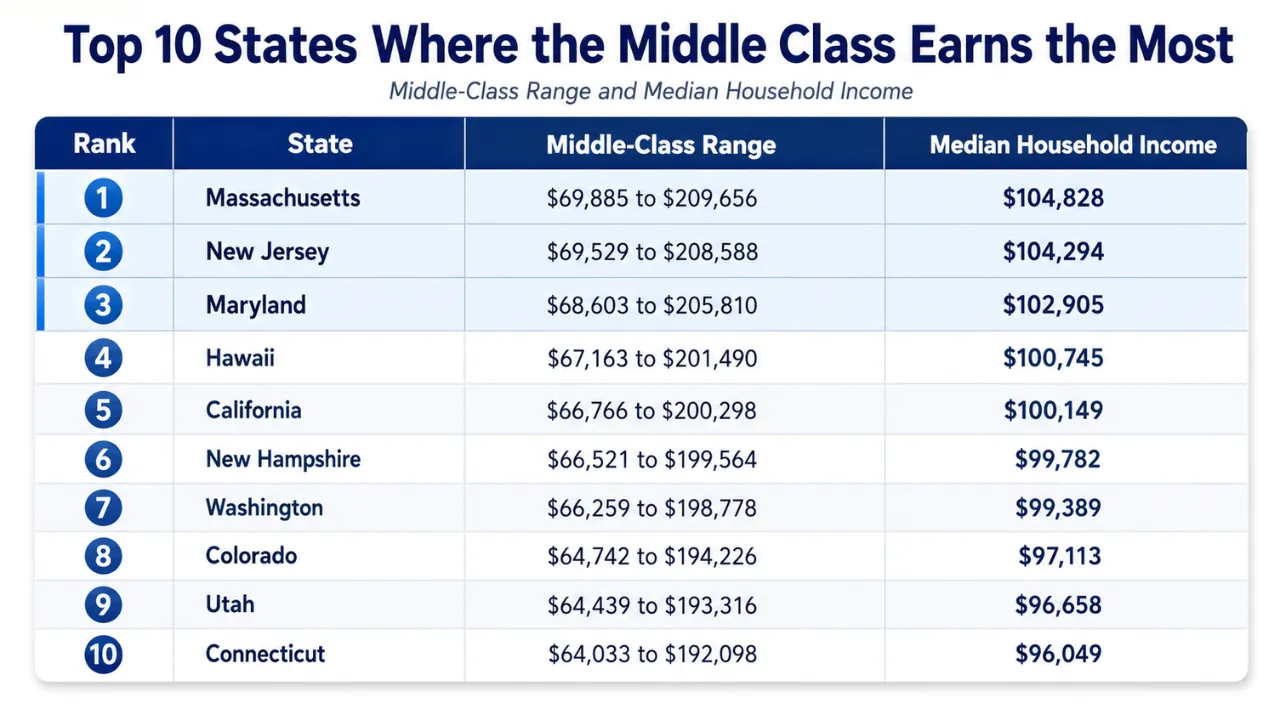
The middle-class income is highest in states with expensive housing and big corporate job markets. Massachusetts takes the top spot, followed by New Jersey, Maryland, Hawaii, and California.
The catch is that bigger paychecks get eaten up immediately by local expenses. While a typical family in Massachusetts or New Jersey makes over $104,000, their housing and daily bills make life tighter than it would be in the Midwest or South.
The local job markets are what push these numbers up. Maryland relies on federal agencies and defense contractors around D.C. Out west, tech giants and entertainment companies keep wages high in California and Washington, but they also trigger massive housing shortages.
Hawaii is a different story, where importing everything across the ocean makes basic living costs a fortune.
That is why five states, Massachusetts, New Jersey, Maryland, Hawaii, and California, now have middle-class limits that cross over $200,000. A family making $190,000 a year sounds rich in most states, but in these places, that money just keeps you average.
US States Where the Middle Class Earns the Least
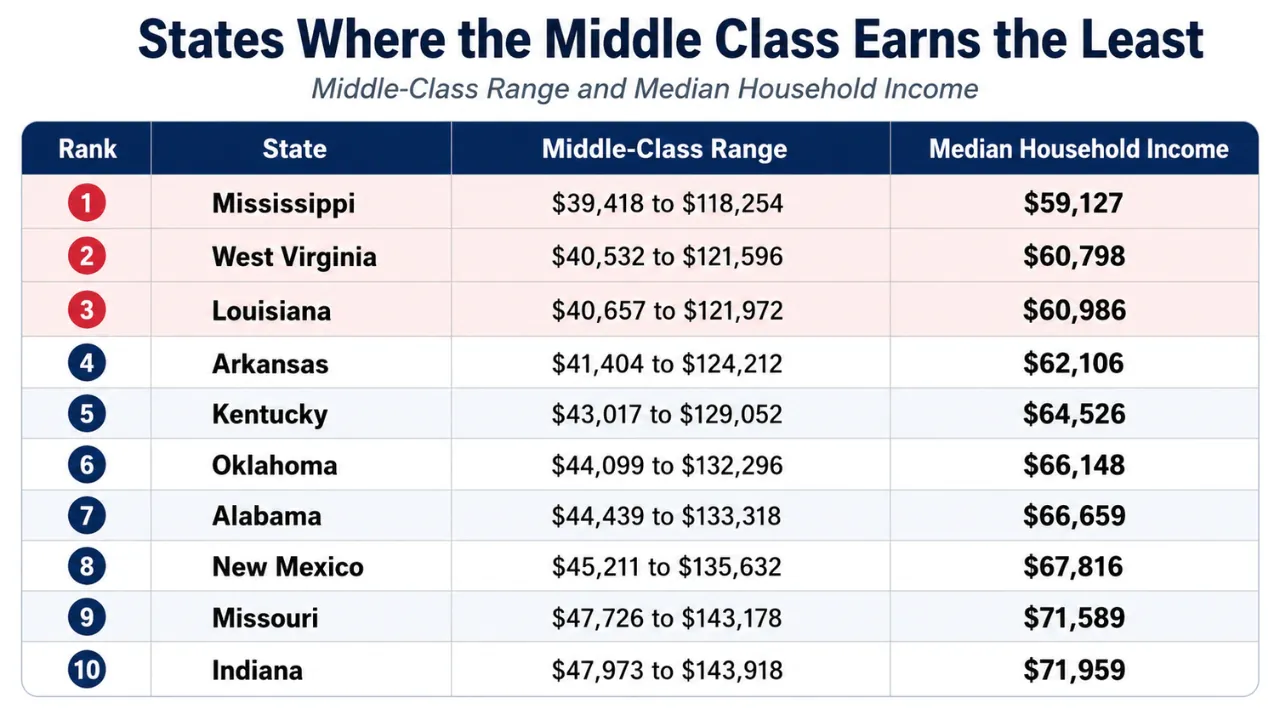
Mississippi sits at the bottom of the list, followed by West Virginia, Louisiana, Arkansas, and Kentucky.
The lower brackets simply mean the median income in these states is lower. Local wages, home prices, rent, and taxes exist on a completely different scale than the high-cost coasts.
To put it in perspective: a $100,000 salary pushes the top edge of the middle class in Mississippi, West Virginia, Louisiana, and Arkansas.
In Massachusetts, New Jersey, Maryland, Hawaii, or California, that same $100,000 does not even reach the state average.
What A $100,000 Income Represents In Different States?
A $100,000 household income is one of the easiest ways to see the problem with national labels. The same income changes in meaning by state.
State
Middle-Class Range
Median Household Income
Where $100,000 Falls
Mississippi
$39,418 to $118,254
$59,127
Near the upper end
West Virginia
$40,532 to $121,596
$60,798
Upper part of the range
Texas
$53,147 to $159,442
$79,721
Above the state median
Florida
$51,823 to $155,470
$77,735
Above the state median
New York
$57,213 to $171,640
$85,820
Above the state median, but local costs vary sharply
California
$66,766 to $200,298
$100,149
Near the state median
Massachusetts
$69,885 to $209,656
$104,828
Below the state median
New Jersey
$69,529 to $208,588
$104,294
Below the state median
This is why many people earning six figures still describe themselves as middle class.
Six figures no longer automatically mean financial comfort, especially for families paying current housing, childcare, and insurance costs.
How Middle-Class Income Has Changed Over Time?

The middle class did not shrink overnight. It happened across distinct eras: the 1970s inflation shocks, the widening wealth gaps of the 1980s and 1990s, the severe asset damage from the Great Recession, and the current 2026 cost squeeze on housing, groceries, and debt.
Data from the Pew Research Center tracks adult populations across income tiers since 1971. Their 2024 middle-class report shows the middle tier remains far below its 1970s baseline.
The breakdown below outlines this long-term shift. Figures from 1971 to 2011 use Pew’s historical adult income-tier data. The 2023 number acts as the latest long-term endpoint, while the 2026 state brackets come from SmartAsset’s 2026 state-by-state middle-class study.
Era
Lower-Income Share
Middle-Income Share
Upper-Income Share
What Changed
Early 1970s
25% (1971)
61% (1971)
14% (1971)
The middle class made up a solid majority of American adults. A single income routinely supported an entire household, and buying a home was realistic for most families.
Early 1980s
26% (1981)
59% (1981)
15% (1981)
The middle class began to thin out under the weight of high inflation, double-digit mortgage rates, and early-decade recessions.
Early 1990s
27% (1991)
56% (1991)
17% (1991)
The middle tier kept shrinking while the top tier grew, leaving a more fragmented income structure after the 1980s economic expansion.
Early 2000s
28% (2001)
54% (2001)
18% (2001)
Despite the wage gains of the late 1990s, the middle class entered the new millennium significantly smaller than it was thirty years prior.
Early 2010s
29% (2011)
51% (2011)
20% (2011)
The housing crash wiped out middle-class net worth. Even families that stayed in the middle bracket lost their home equity and savings.
Late 2010s
29% (2019)
51% (2019)
20% (2019)
The middle-class share leveled off at 51%, but wage growth favored high earners, keeping the wealth gap wide despite job market recoveries.
2020s
30% (2023)
51% (2023)
19% (2023)
The issue shifted from the size of the middle class to sheer affordability. By 2026, everyday costs like housing, food, and insurance dictate actual living standards.
Income Growth By Era
While overall household income rose over the decades, the timeline was choppy. Median income climbed through the 70s, 80s, and 90s, but stagnated or dropped in the 2000s.
Post-2000 wage growth slowed down drastically compared to the previous three decades.
Year
Adjusted Median Household Income
Trend
The Impact
1970
$44,845
Baseline
The middle class was large, but soon hit a wall of 1970s stagflation.
1980
$50,307
Up from 1970
Incomes grew on paper, but severe inflation and interest rates ate up the gains.
1990
$56,319
Up from 1980
The total income pie grew, but the actual percentage of middle-class households shrank.
2000
$63,277
Up from 1990
The 1990s tech boom and strong job market delivered the biggest income gains in this sequence.
2010
$59,127
Down nearly 7% from 2000
The 2000s turned into a lost decade due to the dot-com crash, a weak job market, and the Great Recession.
2018
$74,600
49% higher than 1970
Wages finally recovered from the 2008 crash, but long-term growth remained sluggish compared to the pre-2000 era.
2026 Context
$54,403 to $163,208
SmartAsset 2026 study calculations
Raw income numbers don’t tell the whole story anymore. Tax brackets don’t show if a family can actually afford a mortgage or childcare.
The year 2000 was a major turning point. Median household income grew much faster from 1970 to 2000 than it did afterward. Hit by back-to-back recessions in 2001 and 2008, household incomes took until the mid-2010s just to climb back to where they started the millennium.
How Middle-Class Wealth Shifted
Wages only tell part of the story; net worth is what keeps a family afloat. True wealth comes down to home equity, savings, and retirement funds minus accumulated debt.
Period
Median Wealth Trend
The Real-World Impact
1983 to 2001
Middle-class median wealth rose from $102,000 to $144,600 (in 2018 dollars).
A strong era for the middle class, driven by climbing home values and steady market growth.
1992 to 2001
Middle-income median net worth jumped from $90,846 to $129,582 (in 2011 dollars).
The 90s expansion built up strong family balance sheets right before the housing crash.
2001 to 2010
Middle-income wealth collapsed from $129,582 down to $93,150 (in 2011 dollars).
The housing market crash hit the middle class hardest because the bulk of their wealth was tied up in home equity.
2001 to 2016
Middle-income wealth dropped 20%, while top-tier wealth increased.
The wealth gap widened instantly because wealthier families held assets that recovered faster in the stock market.
2020s
A sharp divide emerged between legacy homeowners and everyone else.
Financial security is no longer just about your salary; it is about whether you locked in a low mortgage rate years ago.
The 1990s built up middle-class nest eggs, the 2000s wiped them out, and the 2020s split the demographic in two: families who bought property before interest rates spiked vs. those stuck trying to buy at 2026 prices.
View this post on Instagram
Era-By-Era Breakdown
Era
Economic Drivers
The Reality for Families
1970s
Stagflation, energy crises, and shrinking family sizes.
The middle class was massive, but keeping up with basic living costs became a constant uphill battle.
1980s
Rising income inequality and lopsided wage growth.
The middle-class share dropped from 59% to 56% as high-income earners pulled away.
1990s
Rapid job growth, real estate gains, and the dot-com boom.
Middle-class families gained wealth, but top earners gained vastly more, stretching the income gap.
2000s
Two recessions, a housing crash, and a major financial crisis.
The middle class shrank to 51% while family net worth took a direct hit.
2010s
Slow post-crash recovery and falling unemployment.
The middle-income share stabilized at 51%, but wealth inequality stayed high and homeownership grew tougher.
2020s
Pandemic aftermath, inflation spikes, high mortgage rates, and debt.
You can easily land in the middle-class income bracket on paper but still live paycheck-to-paycheck due to fixed costs.
Why the 2026 Economy Feels Different
The historical trend shows a shrinking class size, but the modern problem is pure affordability. Nominal salaries are higher than ever, but the actual bills required to live a middle-class life have grown much faster.
2026 Cost Pressures
Latest Data
The Direct Impact
Inflation
May 2026 CPI up 4.2% year-over-year
Prices keep climbing on top of the steep increases from previous years.
Food
May 2026 grocery prices up 3.1% year-over-year
Basic food bills leave families with less money to put into savings.
Housing
May 2026 shelter costs up 3.4% year-over-year
Rent and housing continue to eat up the single largest share of monthly income.
Energy
May 2026 energy prices up 23.5% year-over-year
Spiking utility bills and fuel costs make commuting and running a home more expensive.
Mortgage Rates
June 2026 30-year fixed rate at 6.52%
Prospective homebuyers face massive monthly payments that crush their purchasing power.
Home Prices
Average U.S. home value at $370,320
High prices make down payments nearly impossible for renters to save up for.
Household Debt
Q1 2026 total debt hits $18.8 trillion
Servicing credit cards, car loans, and student debt drains income before bills are paid.
This is why the middle-class conversation cannot just be about income lines. A family making $110,000 with a 3% mortgage and no daycare costs might feel completely secure.
Another household with that exact same $110,000 income facing current market rents, child care fees, and student loans is likely struggling every month.
Our team at NCH Stats detailed these price trends in our full analysis of inflation in the U.S., showing why income rankings and real-world financial pressure can look so wildly different.
Ultimately, the middle class spent decades shrinking, lost its share of total income, reclaimed a bit of ground in the late 2010s, and then ran straight into a wall of 2020s price hikes. In 2026, the question isn’t just what your salary is. It’s whether that salary can still cover the core pillars of a stable life: a home, a car, childcare, healthcare, and a retirement fund.
Inflation In 2026 Still Shapes The Middle-Class Budget
Headline inflation stood at 4.2% from a year earlier. Food rose 3.1%, shelter rose 3.4%, and energy rose 23.5%.
The energy increase is significant because it can move through a household budget quickly. Gasoline, electricity, airline fares, shipping costs, and delivery costs affect more than one line item.
Middle-income households usually cannot ignore those increases because they spend a large share of their income on necessary purchases.
The BLS real earnings report for May 2026 adds another layer. Real average hourly earnings for all employees decreased 0.8% from May 2025 to May 2026 after inflation adjustment.
That means nominal pay can rise while purchasing power still falls.
Housing Is the Biggest Divider in Middle-Class Life
Housing is the largest single expense for most families, creating a massive financial divide between long-term homeowners, new buyers, and renters.
Anyone who bought or refinanced before interest rates spiked is locked into a low, predictable monthly payment. Meanwhile, anyone trying to buy in 2026 faces a brutal combination of peak prices and high borrowing costs.
With Freddie Mac putting the average 30-year fixed mortgage rate at 6.52% and Zillow tracking the average U.S. home value at $370,320, the math has completely changed.
This combination destroys purchasing power. You can easily earn a solid middle-class salary and still get priced out of the exact same home you could have comfortably bought just a few years ago, simply because a massive chunk of your monthly check now goes toward interest instead of principal.
The S&P CoreLogic Case-Shiller U.S. National Home Price Index shows exactly why the real estate market is splitting the middle class in two. Prices skyrocketed after 2020, and even when the pace of growth slows down, the baseline remains so high that the barrier to entry is completely unrealistic for fewer and fewer families.
How Childcare Expenses Redefine the Middle Class

Childcare costs are often the single factor that pushes a family from comfortable to completely broke.
While the Economic Policy Institute childcare cost database notes that the federal affordability guideline says childcare shouldn’t take up more than 7% of your budget, the reality on the ground is completely different.
Most families pay much more. The financial hit is brutal for parents with infants or toddlers.
A household making $120,000 looks great on paper, but writing giant checks to a daycare center every month completely wipes out the money that should be going into a savings account, retirement, or a down payment on a house.
Household Type
Why the Same Income Feels Different
Single adult
A single paycheck only needs to cover one person’s food, rent, and insurance bills.
Couple without children
Two separate incomes are being pooled together to pay for a single living space.
Family with one child
The budget immediately tightens up under medical bills, grocery spikes, and basic gear.
Family with two young children
Daycare bills frequently match or exceed the cost of a monthly mortgage payment.
Single-parent household
A single income handles multiple dependents, leaving zero flexibility for work hours or emergency costs.
This is exactly why raw income data doesn’t tell the whole story. A state-by-state tier list can show you the mathematical brackets, but it tells you absolutely nothing about how many people are trying to survive on that single pool of money.
The Debt and Savings Trap Crushing the Middle Class
A solid salary means absolutely nothing if most of it gets sucked out of your account to pay off past bills.
A family bringing in $130,000 with zero credit card debt and cheap housing has plenty of breathing room. But put that exact same $130,000 income into a household juggling current market rent, massive student loans, two car payments, and a growing credit card balance, and they are drowning every single month.
The macroeconomic data show just how deep the borrowing problem goes.
The New York Fed Household Debt and Credit Report clocked total household debt at a ridiculous $18.8 trillion in early 2026, with mortgages devouring $13.19 trillion of that total. While late payments on credit cards and auto loans finally leveled off, mortgage defaults actually started creeping up.
At the same time, the latest Federal Reserve SHED report released in May 2026 says 73% of adults claim they are “doing okay” or living comfortably. But look closer at that exact same data: relentless price hikes still rank as the absolute number one threat to daily peace of mind.
This is the massive gap between what you make on paper and how you actually survive. Falling perfectly into the middle-class bracket doesn’t mean a thing if monthly interest payments bleed your check dry before you can even think about saving.
How the Middle Class Changes Depending on Where You Live

1. Northeast
The Northeast is home to some of the highest financial hubs in the country.
States like Massachusetts, New Jersey, New Hampshire, and Connecticut constantly top the charts because high-paying fields, like finance, healthcare, tech, and corporate services, drag up the statewide median.
The tradeoff is that brutal property taxes and expensive real estate instantly chew into those larger paychecks.
New York is the perfect example of why statewide averages can be misleading.
The official middle-class bracket sits at $57,213 to $171,640, but that single range forces NYC, its wealthy suburbs, and rust-belt upstate towns into the same box.
A salary that lets you live as royalty in Buffalo or Syracuse will barely cover a cramped apartment in Manhattan, Brooklyn, or Westchester County.
2. West Coast
California and Washington sit right near the peak of the cost curve.
Both states are driven by massive, high-wage metro hubs built around tech giants, global trade, and healthcare.
We have looked at this dynamic before in our breakdown of California population growth, where ongoing migration shifts directly dictate how tight the local housing market gets.
Just like New York, the state numbers hide the extreme local realities. In tech hubs like San Jose and San Francisco, the local middle-class thresholds dwarf the rest of the state.
Pulling in a six-figure salary sounds like wealth to the rest of the country, but in these cities, that kind of money barely buys you a basic, middle-class life.
3. South
The South is completely split between hyper-growth metros and deeply entrenched, lower-income regions.
While Texas, Florida, Georgia, and North Carolina sit right around the national average, states like Mississippi, Louisiana, Arkansas, Alabama, and Kentucky consistently anchor the bottom of the list.
The massive influx of new residents is rapidly rewriting the rules in certain pockets.
For instance, our look at Texas population trends shows that the heavy boom in cities like Austin, Dallas, and Houston is driving up wages and infrastructure demands, but it is also triggering the exact same real estate price pressures that people used to flee the coasts to avoid.
4. Midwest
The Midwest offers a much more stable, moderate financial baseline, though there is still a noticeable gap between states like Minnesota or Illinois and cheaper spots like Indiana, Ohio, or Missouri.
The biggest selling point for the Midwest is still real estate sanity.
A household pulling in $90,000 in Ohio, Indiana, Missouri, or Iowa has access to housing options that are completely out of reach on the coasts.
The catch, however, is that you generally face slower long-term wage growth and a much smaller pool of high-paying corporate sectors.
5. Mountain West
Colorado and Utah have surged ahead as high-income, high-cost states, leaving places like Idaho, Montana, Nevada, and Wyoming closer to the national average.
The entire region has been turned upside down by a massive wave of remote workers, tech transplants, and outdoor tourism.
The main issue here is that incomes and housing prices skyrocketed at the exact same time.
While that makes the statewide median look great on paper, it has created a brutal environment for local renters and first-time buyers who are completely priced out of the communities they grew up in.
The Massive Income Disconnect Between Cities
State averages mask the real extremes. When you look at individual cities, the income gaps are staggering.
San Jose, California, holds the highest financial bar in the country, forcing households to make anywhere from $98,817 to $296,452 just to be considered middle class.
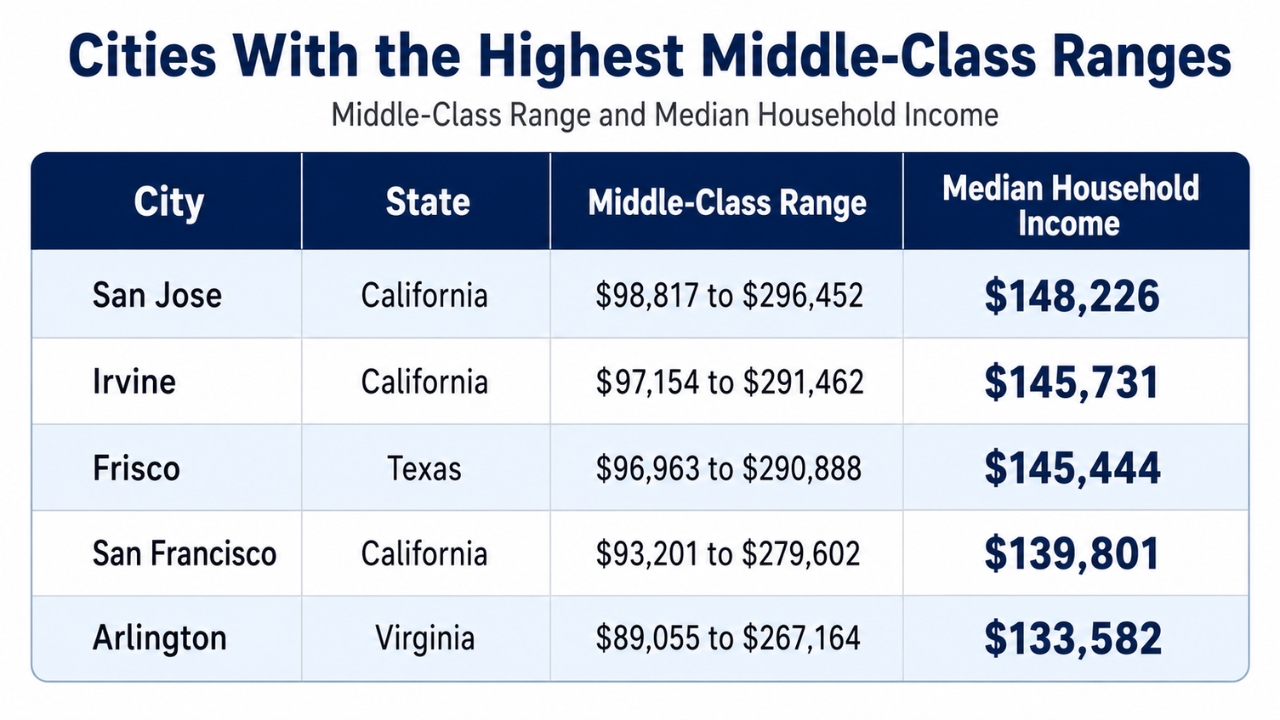
These numbers prove why a single state benchmark is useless for actual financial planning. While San Jose and San Francisco technically share a state with towns in the Central Valley, their local economies operate in an entirely different financial universe.
Lowest Large-City Entry Points
Lower End Of Middle Class
What It Shows
Cleveland, Ohio
$28,922
The absolute lowest entry bar for any major U.S. city.
Toledo, Ohio
$33,708
An economy built on a much lower wage and cost scale than the coasts.
Buffalo, New York
Below $35,000
Proof of how cheap New York gets once you leave NYC and the suburbs.
Memphis, Tennessee
Near the bottom
A low-cost urban market with a much lower median income line.
St. Louis, Missouri
Near the bottom
An entry threshold that sits far below national and coastal averages.
City data is what actually impacts daily life because jobs, rent, and childcare are strictly local. A state-level chart might give you a broad overview, but your actual household budget is entirely captive to your specific metro area.
Where Your Paycheck Disappears After Taxes and Insurance
Gross salary doesn’t tell you what actually hits your bank account. State income taxes, property taxes, sales taxes, and local fees change your actual spending power from state to state.
Living in a state with no income tax doesn’t automatically save you money. Those states often make up for it with brutal property tax rates, high insurance premiums, or inflated housing prices. The real question isn’t just what you earn on paper, but what you actually get to keep after the local government takes its cut.
Insurance has also turned into a massive budget killer. What you pay for home, auto, and health coverage varies wildly depending on where you live.
Local weather risks, car theft rates, medical costs, and repair bills have driven premiums up across the board, adding another fixed expense that eats into a family’s monthly budget.
The Great Homeownership Divide

Buying a house used to be the default way to build middle-class wealth, but that path is completely blocked for first-time buyers. High mortgage rates have inflated monthly payments, and spiked home values mean saving up a down payment takes years longer.
This has split the middle class into two entirely different groups. On one side, you have families who bought or refinanced before interest rates shot up. They enjoy cheap, fixed monthly payments and growing equity.
On the other side, families with the exact same salary are stuck paying current market rents or trying to stretch their budget to buy at the high interest rates present today.
Because older homeowners refuse to sell and lose their low rates, housing inventory stays completely choked.
How Remote Work and Migration Redrew the Financial Map
The explosion of remote work after 2020 completely disrupted local real estate markets. Higher-earning professionals moved out of expensive coastal hubs and flooded into cheaper states, bringing big-city salaries into small-town housing markets.
In parts of the Mountain West, the Southeast, and Texas, this sudden demand sent home prices through the roof.
Local workers who depend on local wages suddenly found themselves priced out of their own towns. This is exactly why living costs are skyrocketing even in states that used to be considered cheap compared to California or New York.
This migration wave is also breaking down local infrastructure. Rapidly growing towns are struggling to keep up with overcrowded schools, jammed roads, strained utilities, and a lack of open hospital beds.
Meanwhile, slower-growth areas keep housing cheap but offer far fewer career opportunities.
Methodology
The state-by-state data throughout this article comes from the SmartAsset 2026 middle-class study.
To build the brackets, SmartAsset used numbers from the U.S. Census Bureau’s American Community Survey and applied the standard Pew Research formula, which defines the middle class as households making between two-thirds and double the local median income.
To match these numbers with the broader economy, national income baselines are from the U.S. Census Bureau household income report.
Real-time inflation metrics come from the Bureau of Labor Statistics CPI release, while standard purchasing power trends are pulled from the BLS real earnings report.
Real estate and debt figures are pulled from several market benchmarks: Freddie Mac mortgage rates, Zillow home values, and the S&P CoreLogic Case-Shiller U.S. National Home Price Index.
Debt data relies on the New York Fed Household Debt and Credit Report and the Federal Reserve SHED report.
Daycare and early education numbers come from the Economic Policy Institute childcare cost database.
Just keep in mind that these charts show where you fall on an income bracket, not how far your money actually goes.
A real household budget depends entirely on local rent prices, mortgage terms, property taxes, daycare costs, commutes, and insurance premiums.
Bottom Line

A national average is useless when $40,000 gets you by in Mississippi but $200,000 leaves you struggling on the coast. Where you live decides what your money is actually worth.
A salary also fails to show if you are actually making it. The real divide comes down to your fixed monthly bills.
You can easily land right in the middle-class bracket on paper, but if you are stuck paying current market rent, mortgage rates, daycare, and high insurance premiums, you are still going to live paycheck to paycheck.