

In 2022, approximately 31% of adults worldwide, about 1.8 billion people, did not meet the recommended physical activity levels outside of work, i.e., at least 150 minutes of moderate or 75 minutes of vigorous activity per week, according to the CDC.
In the United States, data from the National Health Interview Survey and CDC show that 25.3 % of U.S. adults reported no leisure‑time physical activity outside their jobs (averaged from 2017–2020).
These figures reflect a major public‑health concern: large segments of adults are inactive beyond work hours, increasing risks for chronic diseases without even structured exercise.
1. Global Inactivity Affects Over 1.8 Billion Adults (31.3%)
View this post on Instagram
As of 2022, the World Health Organization reported that 31.3% of adults worldwide, approximately 1.8 billion people, do not meet the minimum recommended levels of physical activity outside of work.
This includes not achieving 150 minutes of moderate-intensity or 75 minutes of vigorous-intensity activity per week. This statistic highlights a staggering issue: nearly a third of the global adult population leads a lifestyle that lacks the movement necessary to maintain health.
According to the WHO, inactivity now qualifies as a “silent pandemic,” especially given its correlation with heart disease, obesity, type 2 diabetes, and mental health decline.
Sedentary habits, such as prolonged TV watching, phone scrolling, and seated transportation, have replaced traditional daily movement, especially in urbanized societies where desk-based jobs dominate. This trend reflects systemic issues like poor city planning, limited green space, and digital dependence.
Year
Global Inactivity Rate
Number of Inactive Adults
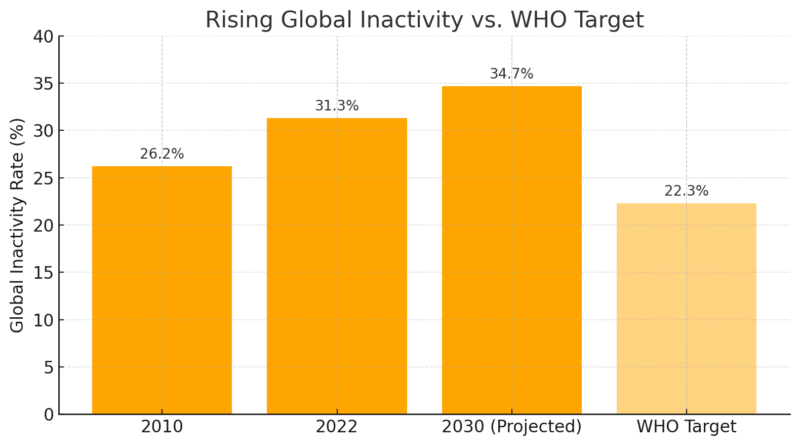
2010
~26.2%
~1.4 billion
2022
31.3%
~1.8 billion
2030*
~34.7% (projected)
~2.2 billion (projected)
2. 25.3% of U.S. Adults Are Inactive Outside Work
According to the CDC’s Behavioral Risk Factor Surveillance System (BRFSS) survey, conducted between 2017 and 2020, 25.3% of American adults report no physical activity outside of their job duties. This figure only includes leisure-time exercise such as walking, running, or going to the gym, not work-related activity or house chores.
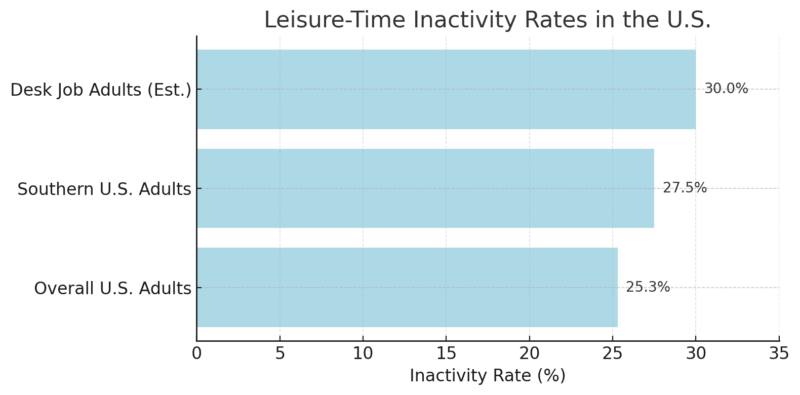
While this number is slightly lower than the global average, it still represents over 1 in 4 Americans failing to engage in any exercise during their free time.
Physical inactivity outside work is not only about skipping the gym; it also reflects a wider problem: insufficient walking, low daily step count, and poor cardiovascular engagement. This trend is tied to longer commutes, digital entertainment, and reduced social sports participation.
3. Disparities by Race and Ethnicity in the U.S.
Leisure-time inactivity is not evenly distributed. According to CDC reports, Hispanic adults had the highest rate of inactivity (32.1%), followed by non-Hispanic Black adults (30.0%), while non-Hispanic White adults were at 23.0%, and Asian Americans had the lowest rate (20.1%). These differences reflect broader systemic inequities.
Communities of color often face reduced access to parks, trails, and affordable gyms. Moreover, cultural norms and work patterns (e.g., holding multiple jobs or shift work) can further reduce time and energy for exercise. Structural racism in urban planning also plays a role; many historically marginalized communities have fewer safe walking or biking spaces.
Race / Ethnicity
Inactivity Rate (%)
Hispanic
32.1%
Black (non-Hispanic)
30.0%
White (non-Hispanic)
23.0%
Asian
20.1%
4. State-by-State Inactivity: Colorado vs. Puerto Rico
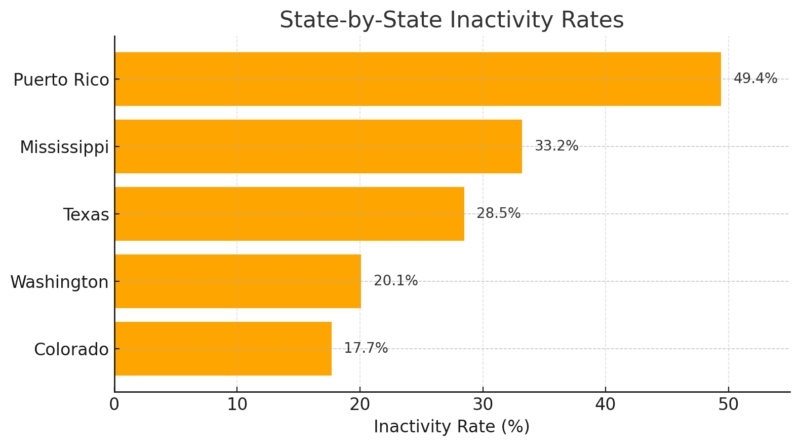
The U.S. shows massive variation in inactivity rates by state, with Colorado having the lowest at 17.7% and Puerto Rico the highest at 49.4%, according to the CDC’s 2022 BRFSS data.
The Southern U.S. has disproportionately high inactivity rates due to several factors: lower investment in recreation infrastructure, higher rates of poverty, and hotter climates that discourage outdoor activity.
Colorado consistently ranks as one of the most active states due to its culture of outdoor recreation, walkable urban areas, and public investment in fitness. In contrast, areas like Puerto Rico and Mississippi lack similar resources and public health outreach.
5. Inactivity Rises with Age: Adults 75+ Most Affected
Data from the National Health Interview Survey shows that inactivity increases sharply with age, particularly beyond age 50. Among adults aged 50–64, around 27.5% are inactive. This climbs to 35.3% for adults aged 75+.
Several factors contribute to this, including mobility limitations, chronic conditions, social isolation, or a fear of injury. But experts stress that regular physical activity, even light walking, can extend mobility and independence well into old age.
Unfortunately, older adults often lack access to age-appropriate fitness programs, especially outside urban centers.
Age Group
Inactivity Rate (%)
50–64
~27.5%
65–74
~30.4%
75+
~35.3%
6. Gender Disparity: Women Are Less Active Than Men
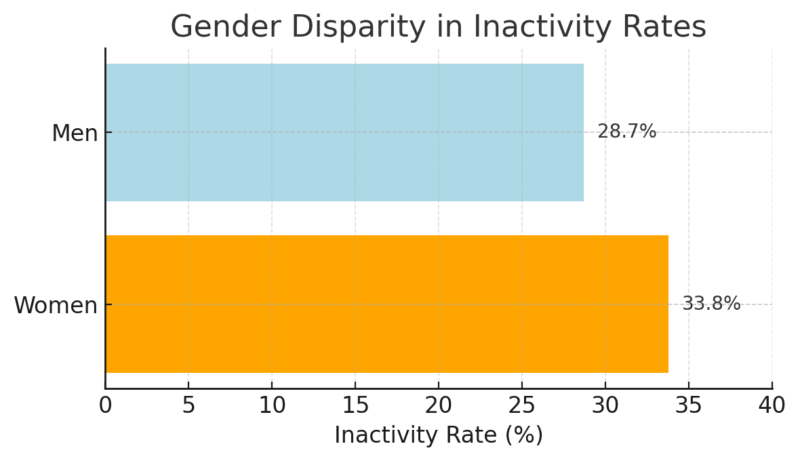
Globally, women are significantly more inactive than men. WHO data shows 33.8% of women vs. 28.7% of men are inactive outside work. Gender roles, caregiving responsibilities, safety concerns, and a lack of inclusive recreational opportunities often create barriers for women.
For example, in regions where public harassment or poor lighting make walking or jogging uncomfortable or dangerous, female participation drops. Additionally, the “fitness industry” often caters to male interests or high-intensity goals, which alienates some women seeking inclusive, gentle activity.
7. Sedentary Time Is Increasing Worldwide
@justin_agustin Just a little reminder ☺️ #healthandwellness #fitnessadvice ♬ Lo-fi hip hop – NAO-K
Beyond structured workouts, total sedentary time is also climbing. The average adult now sits 4.7 to 6.5 hours daily, outside of sleep. In the U.S., the average increased from 7.0 hours per day in 2007 to 8.2 hours in 2016, and continues to rise.
Prolonged sitting, even with workouts, still poses cardiovascular and musculoskeletal risks. Office work, streaming media, and transportation are major contributors. This “active couch potato” phenomenon shows that gym time doesn’t erase a sedentary baseline; it must be balanced with daily movement.
Year
Average Sitting Time
2007
7.0 hours/day
2016
8.2 hours/day
2025 (est.)
8.6 hours/day
8. Inactivity Leads to Major Health Burdens
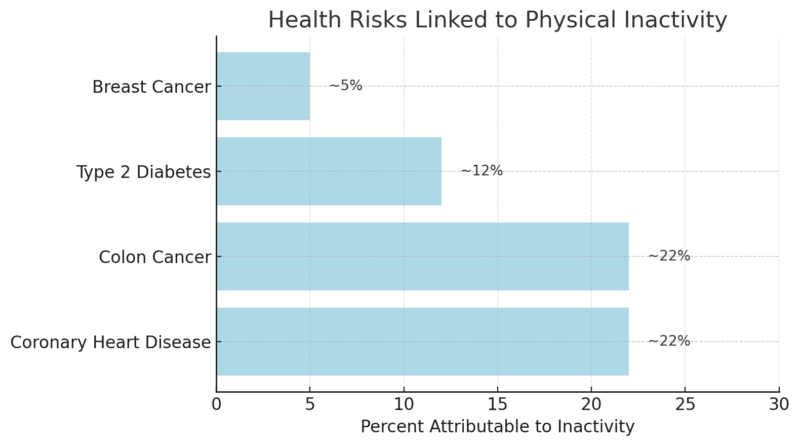
Physical inactivity is associated with 12% of type 2 diabetes cases, 22% of heart disease, and 5% of breast and colon cancers, according to the American Journal of Medicine. These are not just correlations; causal mechanisms include poor metabolic regulation, reduced insulin sensitivity, and increased inflammation.
Even mild activity like brisk walking can cut disease risk dramatically. When inactivity combines with poor diet and stress, chronic disease risk compounds across the lifespan.
Some care networks have addressed this by linking mobility data with chronic care management through custom healthcare software development solutions already embedded in patient portals or EHR-connected apps.
For example, a system managing post-stroke patients might automatically flag when daily step counts fall below baseline, triggering a check-in from the care team.
9. The Economic Cost: $300 Billion by 2030
The WHO estimates that by 2030, global health systems will spend $300 billion treating conditions linked to inactivity. This cost includes direct healthcare (hospitalizations, medications) and indirect losses from productivity declines, disability, and early death.
Countries with aging populations will bear the heaviest burden. On a smaller scale, even a sedentary workforce leads to higher insurance premiums and reduced work output, making inactivity both a personal and economic threat.
Year Range
Estimated Cost of Inactivity
2020–2030
$300 billion globally
U.S. annually
$24–27 billion
10. Despite Declines in Some Areas, Global Inactivity is Rising
While certain U.S. subpopulations, such as rural women and adults aged 45–64, have shown modest improvements, the global trend remains upward. From 2010 to 2022, inactivity increased by ~5 percentage points globally.
Without intervention, the world will miss WHO’s goal to reduce inactivity by 15% by 2030. This reality points to the need for large-scale environmental, policy, and cultural changes that promote movement at every age and income level.
Methodology
- We sourced the most recent global and U.S.-based data on physical inactivity from trusted institutions like the World Health Organization (WHO) and the Centers for Disease Control and Prevention (CDC).
- National surveys such as the BRFSS and National Health Interview Survey were referenced for U.S. inactivity statistics.
- Every statistic was validated against official reports or peer-reviewed studies to ensure accuracy and context.
- Tables were created to help readers quickly compare numbers across demographics, geography, and time.
Bottom Line
A quarter of U.S. adults and nearly one-third of the global adult population are inactive outside of work, a trend that continues to grow. This inactivity fuels rising healthcare costs, prevents disease prevention efforts from succeeding, and reflects deeper social inequalities.
Women, older adults, and lower-income communities are disproportionately affected, often due to barriers like unsafe neighborhoods or a lack of access to parks or fitness options. Sitting more than 6 hours daily, even with occasional gym sessions, is now the norm, not an exception.
To reduce the $300 billion cost projected by 2030, public health policies must focus on making physical activity safe, accessible, and culturally inclusive. For individuals, even small daily changes, like brisk walking, standing more, or home exercises, can significantly lower long-term health risks.


