

As of 2025, Arkansas population stands at approximately 3,089,060.
This marks a significant increase from the 2010 official census count of 2,915,918.
According to World Population Review, these figures place Arkansas as the 32nd largest state in terms of population within the United States.
The steady uptick in population numbers reflects consistent growth trends observed annually.
Various factors such as birth rates, migration patterns, and economic opportunities contribute to this increment.
The demographic breakdown by racial and ethnic composition highlights that 72.66% of residents are white, while 15.13% identify as Black or African American, among other groups.
Key Takeaways
- Arkansas’s population reached 3,089,060 in 2025, reflecting steady growth from the 2010 Census count of 2.91 million.
- In 2022, 86,375 people moved to Arkansas, with Texas contributing over 17,000 newcomers. However, 74,000 residents left, mostly for Texas, resulting in a net population gain.
- Arkansas is predominantly White (74.08%), with Black or African Americans accounting for 15.24%. Other minority groups, including Asians and Native Americans, represent smaller shares.
- The average household income is $79,592, 25% below the U.S. average. The median rent in Arkansas is $1,101.25, significantly lower than the national median of $1,529.01.
- Arkansas saw employment growth in 2023, with the unemployment rate improving to 3.3%. The manufacturing and construction sectors benefit heavily from immigrant labor.
- 17.22% of residents are aged 65+, leading to an old age dependency ratio of 28.2 and signaling future healthcare needs.
Historical Growth Rates

- Source: Youtube/Screenshot, In 1810, Arkansas had a population of only 1,062 residents

Arkansas covers an area of 53,179 square miles (137,733 square kilometers). Based on the 2010 Census, the population density was 56 people per square mile, ranking it 34th in the U.S. for population density.
The population of Arkansas has grown steadily since the 19th century. In 1810, the state had just 1,062 residents. By 1820, the population had jumped to 14,273—a growth of 1,244% in ten years. From then until 1940, the state’s population increased steadily, driven largely by immigration according to World Population Review.
Between 1940 and 1960, however, Arkansas experienced population declines, primarily due to World War II and post-war migration as per the Cato Institute. After 1960, the population began growing again, maintaining an average annual growth rate of just over 1% until 2010.
Recent data from the World Population Review indicates that the growth rate has slowed since 2012.
Projected Growth Trends
Recent data from Arkansas State Data Center indicates that the growth rate has slowed since 2012. Projections suggest that Arkansas will surpass 3 million residents by the 2020 Census, with estimates ranging between 3.03 million and 3.2 million, depending on the growth trend.
Age Structure and Dependency Ratios

- Age structure Of Arkansas chart
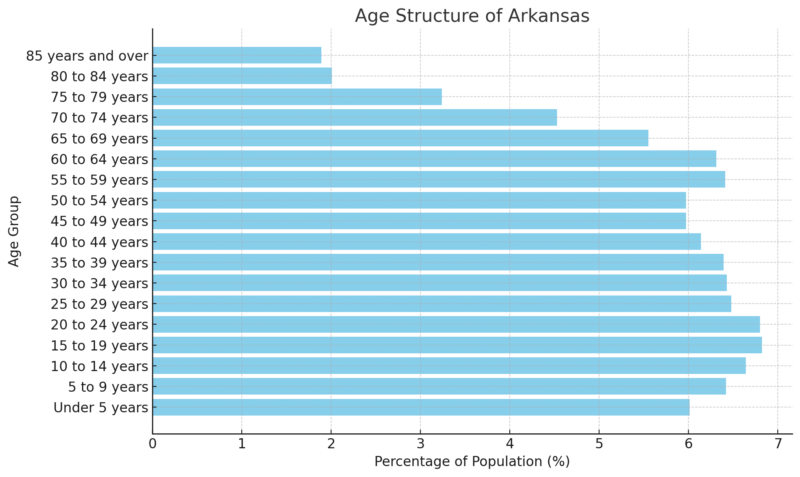
Arkansas population shows a balanced distribution across different age groups.
The young population, aged 0-19 years, makes up 25.89% of the total, indicating a solid foundation for future workforce growth.
The working-age population, between 20 and 64 years, accounts for 61.09%, with a significant concentration in the 15-24 age range, reflecting a mix of students and early-career individuals according to Neilsberg.
Meanwhile, the older population, aged 65 and above, comprises 17.22%, signaling the need for increased healthcare and retirement services as this group continues to grow.
Overall, Arkansas benefits from a strong working-age demographic, but the rising elderly population suggests that the state will need to prepare for higher dependency rates and expanded senior care services in the future.

- Age dependency ratios in Arkansas chart
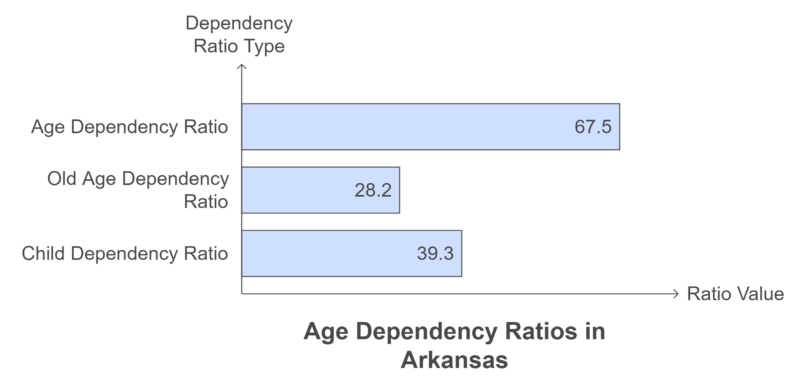
- Age Dependency Ratio: For every 100 working-age individuals (20-64 years), there are 67.5 dependents (children and elderly combined).
- Old Age Dependency Ratio: 28.2 elderly dependents (65+ years) per 100 working-age individuals.
- Child Dependency Ratio: 39.3 child dependents (under 20 years) per 100 working-age individuals.
Arkansas Population by Sex

- Gender distribution in Arkansas chart
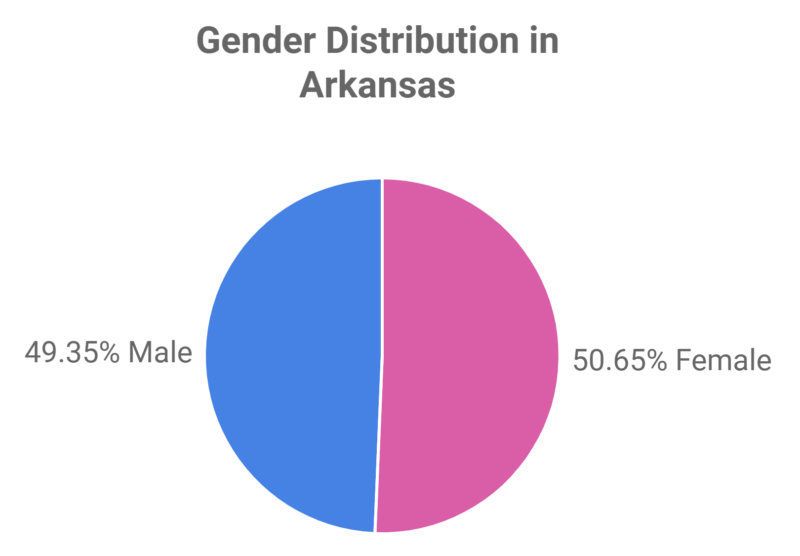
Arkansas has a balanced sex distribution, with females making up 50.65% of the population and males accounting for 49.35%. This near-equal ratio suggests a fairly even demographic composition across genders, with a slightly higher number of females.
Ethnic Composition

- Racial and ethnic composition of Arkansas chart
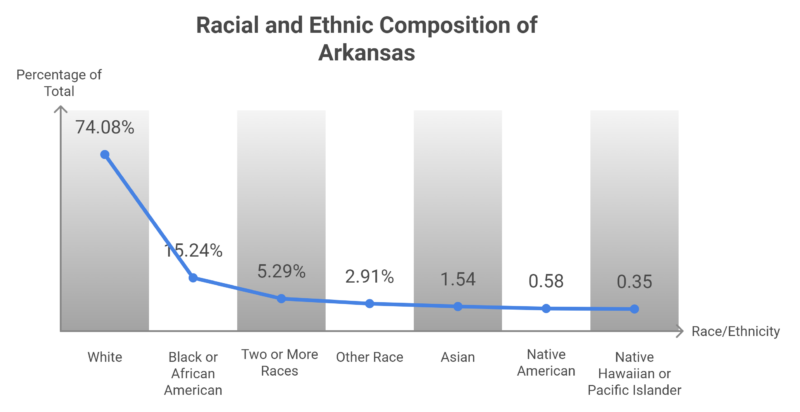
Arkansas population is predominantly White, accounting for 74.08% of the total population. The second-largest group is Black or African American, making up 15.24%. Individuals identifying with two or more races represent 5.29% of the population, followed by other races at 2.91%.
Smaller racial groups include Asians (1.54%), Native Americans (0.58%), and Native Hawaiians or Pacific Islanders (0.35%). This racial distribution reflects a largely homogenous population, though there is also a growing presence of people identifying with multiple or minority racial backgrounds.
Population By County 2025
| Rank | County | Population |
|---|---|---|
| 1 | Pulaski County | 400,009 |
| 2 | Benton County | 311,013 |
| 3 | Washington County | 261,549 |
| 4 | Faulkner County | 129,951 |
| 5 | Saline County | 129,574 |
| 6 | Sebastian County | 129,098 |
| 7 | Craighead County | 113,993 |
| 8 | Garland County | 99,784 |
| 9 | White County | 78,452 |
| 10 | Lonoke County | 75,944 |
| 11 | Pope County | 64,593 |
| 12 | Jefferson County | 63,661 |
| 13 | Crawford County | 61,891 |
| 14 | Crittenden County | 47,139 |
| 15 | Greene County | 46,743 |
| 16 | Baxter County | 42,875 |
| 17 | Miller County | 42,415 |
| 18 | Mississippi County | 38,663 |
| 19 | Boone County | 38,530 |
| 20 | Independence County | 38,320 |
| 21 | Union County | 37,397 |
| 22 | Hot Spring County | 33,258 |
| 23 | Carroll County | 28,814 |
| 24 | Johnson County | 26,129 |
| 25 | Cleburne County | 25,445 |
| 26 | Poinsett County | 22,397 |
| 27 | Columbia County | 22,150 |
| 28 | St. Francis County | 22,101 |
| 29 | Ouachita County | 21,793 |
| 30 | Logan County | 21,400 |
| 31 | Clark County | 21,274 |
| 32 | Conway County | 21,077 |
| 33 | Yell County | 20,044 |
| 34 | Polk County | 19,436 |
| 35 | Hempstead County | 19,343 |
| 36 | Randolph County | 18,907 |
| 37 | Grant County | 18,383 |
| 38 | Ashley County | 18,262 |
| 39 | Sharp County | 17,968 |
| 40 | Madison County | 17,775 |
| 41 | Marion County | 17,514 |
| 42 | Franklin County | 17,468 |
| 43 | Drew County | 16,945 |
| 44 | Jackson County | 16,784 |
| 45 | Cross County | 16,420 |
| 46 | Lawrence County | 16,318 |
| 47 | Arkansas County | 16,307 |
| 48 | Van Buren County | 16,142 |
| 49 | Sevier County | 15,632 |
| 50 | Phillips County | 14,961 |
| 51 | Clay County | 14,201 |
| 52 | Izard County | 14,169 |
| 53 | Lincoln County | 12,898 |
| 54 | Stone County | 12,671 |
| 55 | Howard County | 12,533 |
| 56 | Fulton County | 12,421 |
| 57 | Little River County | 11,805 |
| 58 | Desha County | 10,479 |
| 59 | Pike County | 10,208 |
| 60 | Perry County | 10,184 |
| 61 | Bradley County | 10,104 |
| 62 | Scott County | 9,851 |
| 63 | Chicot County | 9,538 |
| 64 | Montgomery County | 8,620 |
| 65 | Lee County | 8,201 |
| 66 | Nevada County | 8,120 |
| 67 | Prairie County | 8,036 |
| 68 | Searcy County | 7,806 |
| 69 | Cleveland County | 7,378 |
| 70 | Newton County | 7,071 |
| 71 | Monroe County | 6,512 |
| 72 | Dallas County | 6,185 |
| 73 | Lafayette County | 6,095 |
| 74 | Woodruff County | 5,964 |
| 75 | Calhoun County | 4,641 |
This table shows the population distribution across Arkansas counties in 2024. Pulaski County ranks highest with 400,009 residents, while Calhoun County is the least populated with 4,641 residents, demonstrating a wide range in population density throughout the state according to demographics.com.
Educational Attainment
Arkansas has historically ranked low in educational attainment compared to other states. According to a study by WalletHub, it ranks 47th, outpacing only three other states.

- Educational attainment in Arkansas chart
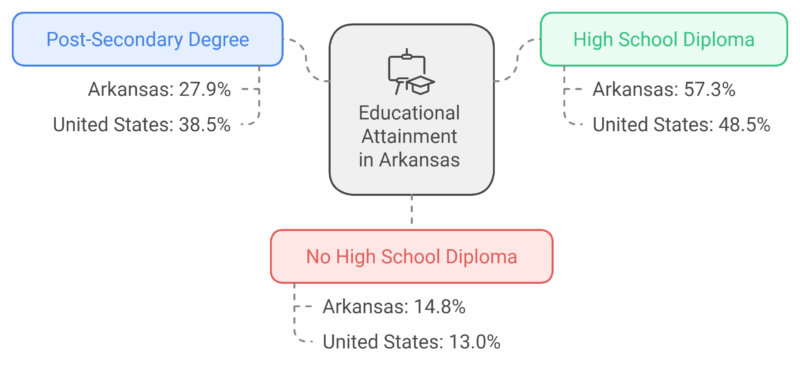
Arkansas has a higher percentage of residents with only a high school diploma and fewer with post-secondary degrees compared to the national average, indicating room for educational growth.
Bachelor’s Degrees by Age Group

- Bachelor’s degrees by age group in Arkansas chart
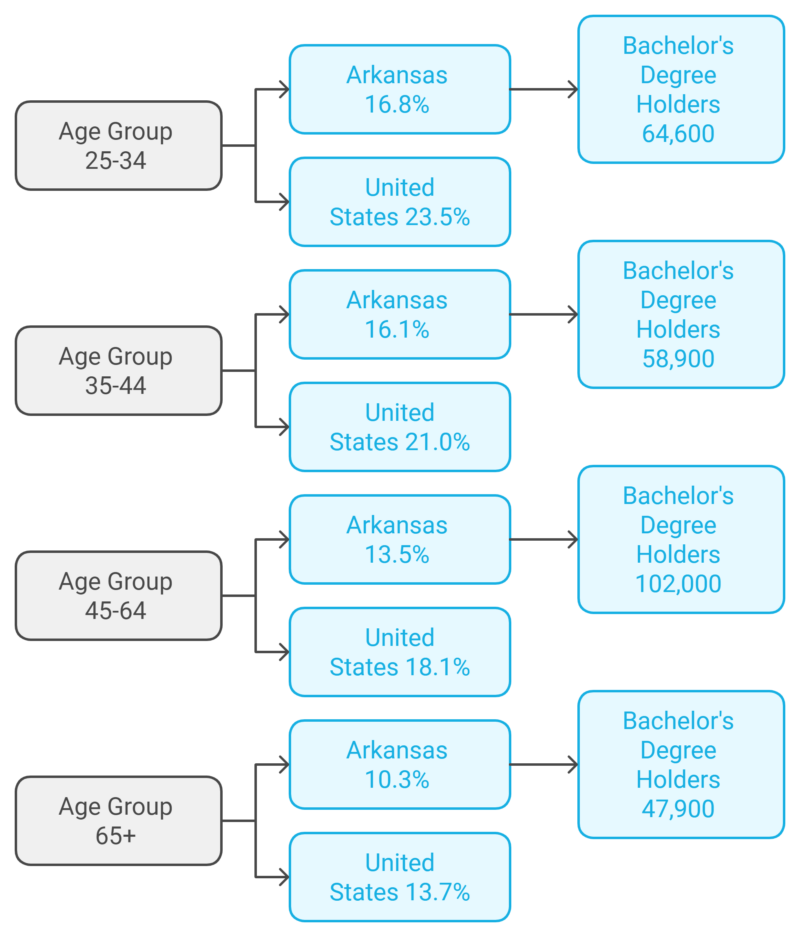
Arkansas lags behind the national average for bachelor’s degree holders across all age groups, particularly in younger cohorts, suggesting a potential challenge in higher education attainment as per Statistical Atlas.
Bachelor’s Degrees by Gender and Age

- Bachelor’s degrees by gender and age in Arkansas chart
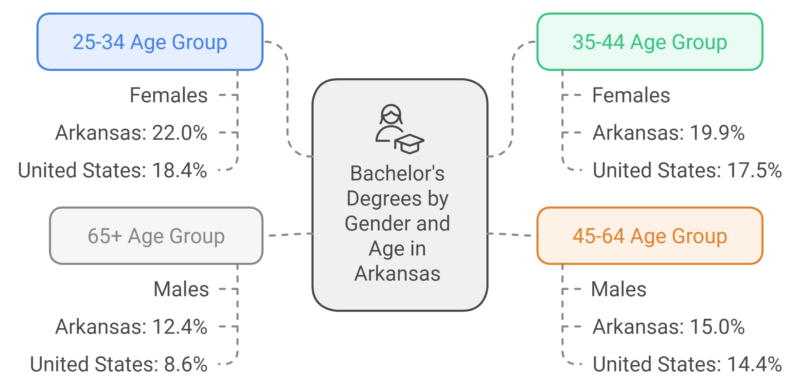
In Arkansas, younger women (ages 25-44) are more likely to hold bachelor’s degrees than men, while men have a higher degree attainment in older age groups (45+).
Age Dependency Ratios in Arkansas

- Age dependency ratios in Arkansas chart
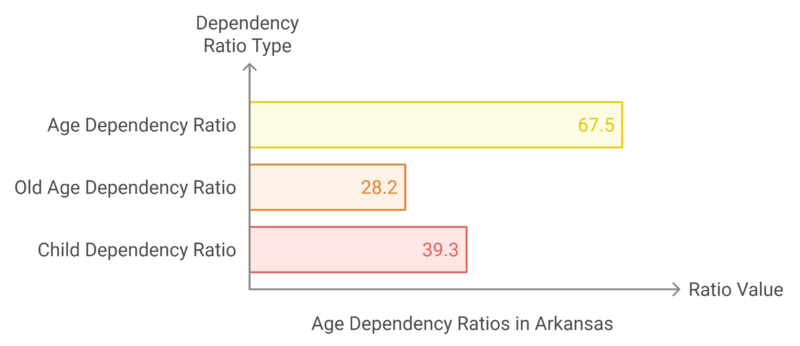
Arkansas has 67.5 dependents for every 100 working-age adults, with a higher burden from children (39.3) than the elderly (28.2). This suggests the need for strong education and social services to support dependents.
Economic Factors
Employment and Unemployment Rates
| Metric | 2023 Jan | 2023 Feb | 2023 Mar | 2023 Apr | 2023 May | 2023 Jun (Preliminary) |
|---|---|---|---|---|---|---|
| Civilian Labor Force (1) | 1,385.6 | 1,388.4 | 1,391.2 | 1,396.3 | 1,401.4 | 1,405.5 |
| Employment (1) | 1,337.3 | 1,340.8 | 1,344.2 | 1,349.8 | 1,354.6 | 1,358.7 |
| Unemployment (1) | 48.3 | 47.5 | 46.9 | 46.5 | 46.8 | 46.7 |
| Unemployment Rate (2) | 3.5% | 3.4% | 3.4% | 3.3% | 3.3% | 3.3% |
- The labor force has grown steadily over the months, increasing from 1,385.6k in January to 1,405.5k by June 2023 (preliminary) according to BLS. This reflects an expanding workforce as more people enter the job market.
- Employment has also shown consistent growth, rising from 1,337.3k in January to 1,358.7k by June. This suggests positive economic activity and job creation across the state.
- Unemployment figures have remained relatively stable, fluctuating slightly but consistently below 50k, with the preliminary data for June showing 46.7k unemployed individuals.
- The unemployment rate has steadily improved, dropping from 3.5% in January to 3.3% by June, indicating a tightening labor market and lower joblessness.
Income Levels
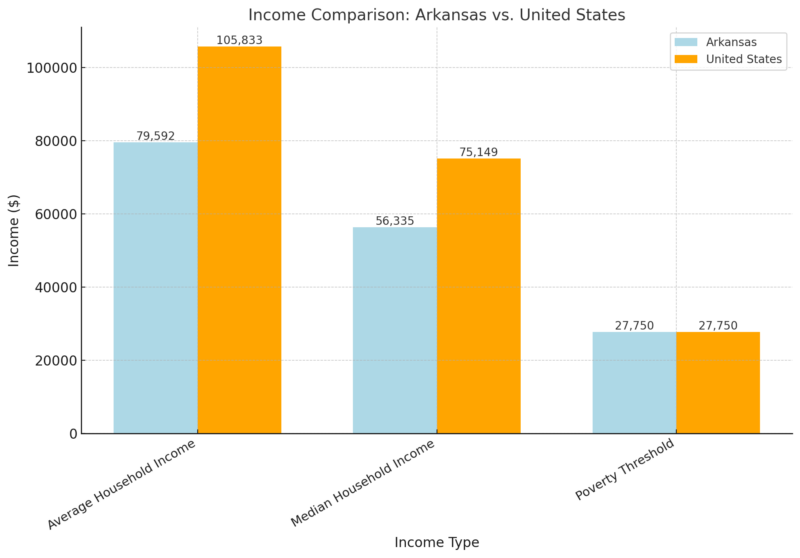
Arkansas households earn 25% less than the national average and median income levels, reflecting lower overall income distribution in the state. Poverty thresholds are consistent nationwide according to Incomebyzipcode.

- Income comparison – Arkansas Vs. United States chart
Richest Zip Codes in Arkansas (2022 Census Data)
| Rank | Zip Code | Population | Mean Income | Median Income |
|---|---|---|---|---|
| 1 | 72223 | 26,558 | $166,005 | $99,646 |
| 2 | 72135 | 3,245 | $165,604 | $84,890 |
| 3 | 72207 | 12,100 | $164,817 | $89,666 |
| 4 | 72718 | 5,111 | $160,762 | $137,038 |
| 5 | 72212 | 13,556 | $154,398 | $111,735 |
| 6 | 72368 | 1,307 | $148,152 | $101,813 |
| 7 | 72712 | 38,006 | $142,453 | $95,071 |
| 8 | 72713 | 24,402 | $136,287 | $108,148 |
| 9 | 72719 | 17,341 | $136,031 | $101,613 |
| 10 | 72156 | 508 | $135,938 | $104,500 |
Zip code 72223 ranks as the wealthiest in Arkansas, with an average household income of $166,005, reflecting economic disparities within the state.
Arkansas Salary Data

- Average vs median salary in Arkansas chart
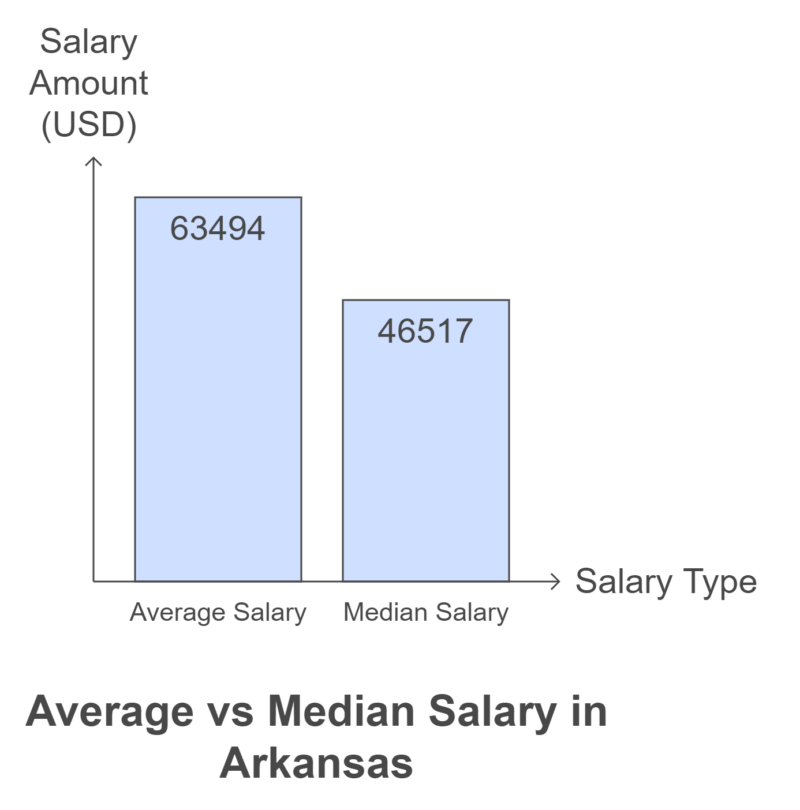
Average and median salaries indicate a broad income gap, with higher earners pulling the state average upward while many workers earn closer to the median.
Arkansas Individual and Family Income Data

- Income metrics in Arkansas chart
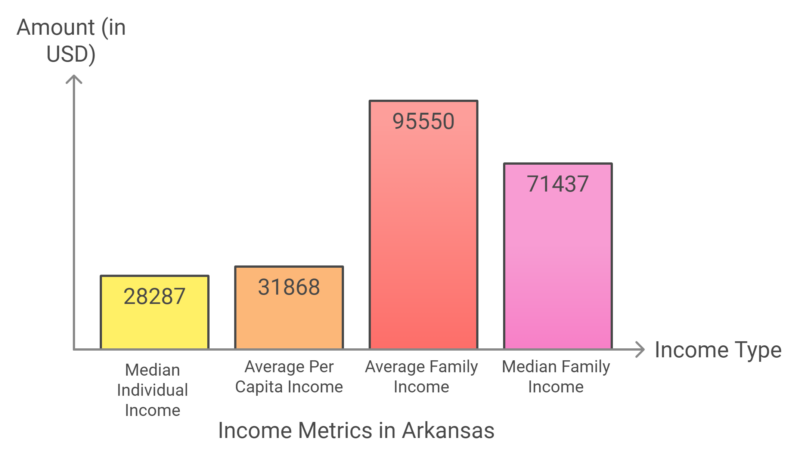
Arkansas families tend to earn more than individual households, with family income averaging $95,550. Single-person households have lower income levels, with a median of $28,287.
Retirement Income in Arkansas

- Retirement income in Arkansas chart
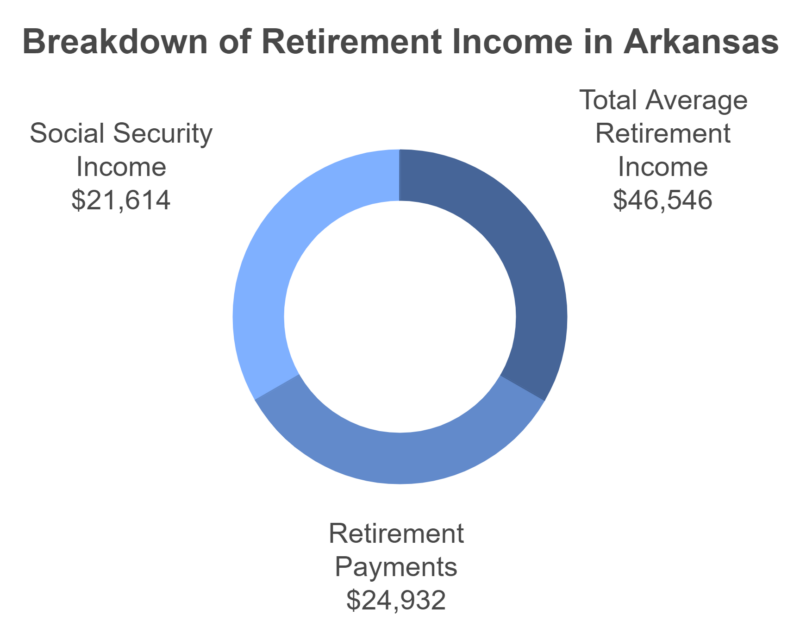
Retirement income includes both pension payments and Social Security benefits, averaging $46,546 annually, which may challenge retirees to manage expenses on fixed incomes.
Income Distribution in Arkansas
| Income Range | Number of Households | Percentage |
|---|---|---|
| Less than $10,000 | 70,774 | 6% |
| $10,000 to $14,999 | 62,292 | 5% |
| $15,000 to $19,999 | 57,524 | 5% |
| $20,000 to $24,999 | 61,781 | 5% |
| $25,000 to $29,999 | 59,828 | 5% |
| $30,000 to $34,999 | 57,041 | 5% |
| $35,000 to $39,999 | 54,982 | 5% |
| $40,000 to $44,999 | 52,026 | 4% |
| $45,000 to $49,999 | 51,410 | 4% |
| $50,000 to $59,999 | 91,791 | 8% |
| $60,000 to $74,999 | 114,393 | 10% |
| $75,000 to $99,999 | 145,577 | 12% |
| $100,000 to $124,999 | 100,370 | 9% |
| $125,000 to $149,999 | 60,217 | 5% |
| $150,000 to $199,999 | 65,630 | 6% |
| $200,000 or more | 66,058 | 6% |
The majority of households earn less than $75,000 annually, though a significant portion (12%) earns between $75,000 and $99,999, showing income inequality within the state.
Arkansas Median Income by Age of Householder

- Arkansas median income by age of householder chart
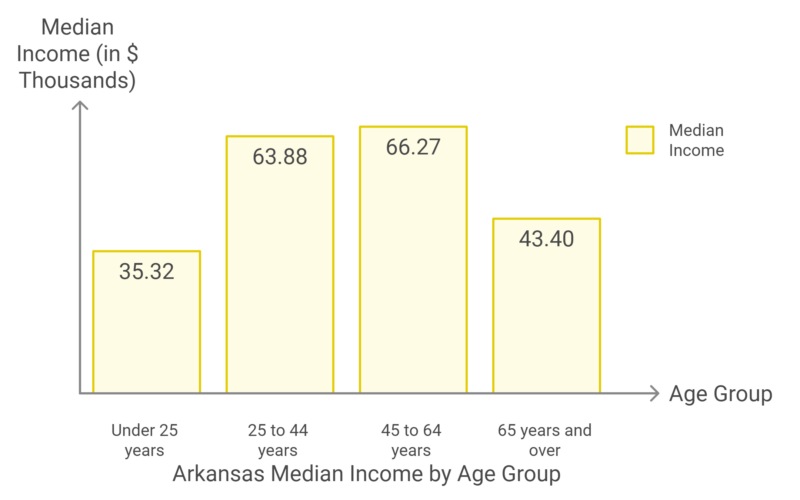
Median income peaks between 45-64 years at $66,270, while younger and older householders earn significantly less, reflecting typical income trends by age.
Housing Market
| Metric | Value |
|---|---|
| Average Home Value | $207,627 |
| 1-Year Value Change | +3.1% |
| Median Sale Price | $237,500 (August 31, 2024) |
| Median List Price | $272,550 (September 30, 2024) |
| Median Sale-to-List Ratio | 0.982 (August 31, 2024) |
| Percent of Sales Over List | 18.5% (August 31, 2024) |
| Percent of Sales Under List | 59.2% (August 31, 2024) |
| Median Days to Pending | 32 Days (September 30, 2024) |
| Inventory for Sale | 13,748 (September 30, 2024) |
| New Listings | 3,513 (September 30, 2024) |
The Arkansas housing market has seen modest growth, with average home values increasing by 3.1% over the past year to $207,627. The median sale price is currently $237,500, while the median list price stands at $272,550, reflecting a gap between listed and sold prices.
Home Sales Fell in August Despite Easing Mortgage Rates, More Homes on Market https://t.co/9KNTQgq6tg pic.twitter.com/HNSCgg7vOG
— Arkansas Business (@ArkBusiness) September 19, 2024
Approximately 18.5% of sales in August 2024 closed above the list price, but the majority (59.2%) sold below. Homes are moving relatively quickly, with 32 days to pending on average, indicating a healthy market with balanced demand and supply. The sale-to-list ratio of 0.982 suggests that homes are selling slightly below their list prices according to Zillow.
As of September 2024, the market had 13,748 active listings and 3,513 new listings, highlighting an ongoing flow of inventory. Overall, the Arkansas housing market remains stable with moderate growth, making it a favorable environment for both buyers and sellers.
Rent Costs in Arkansas
| Metric | Arkansas | United States |
|---|---|---|
| Median Rent | $1,101.25 | $1,529.01 |
| One-Bedroom Rent | $669 | N/A |
| Two-Bedroom Rent | $831 | N/A |
| Three-Bedroom Rent | $1,020 | N/A |
| Four-Bedroom Rent | $1,147 | N/A |
The median rent in Arkansas is 28% lower than the national median, making it more affordable for renters. One-bedroom apartments have a median rent of $669, while four-bedroom homes cost $1,147 monthly on average, further reflecting the lower cost of housing in the state as per Consumer Affairs.
Food Costs in Arkansas

- Food costs in Arkansas chart
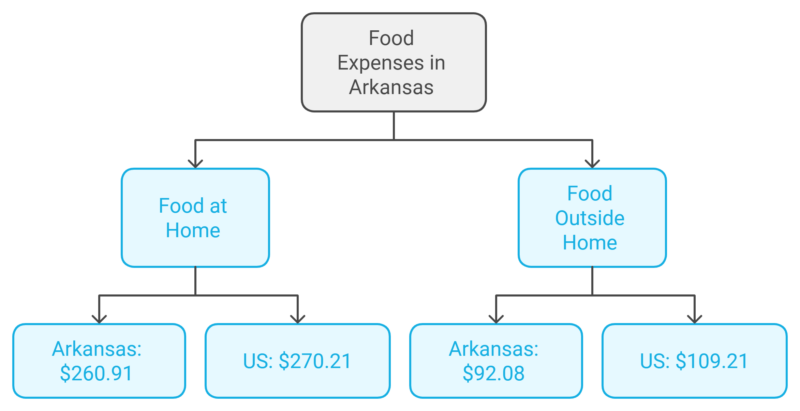
Arkansas residents spend slightly less than the national average on food prepared at home, $260.91 per week. They also spend $92.08 weekly on dining out, which is 15.7% lower than the U.S. average.
Transportation Costs in Arkansas
| Metric | Arkansas | United States |
|---|---|---|
| Gas Price (per gallon) | $2.95 | $3.46 |
| Auto Insurance Premium | $1,089.32 | $1,189.50 |
Transportation is more affordable in Arkansas, with gas prices 15% lower than the national average. Additionally, auto insurance premiums are about 8% lower, reflecting lower transportation costs for residents.
Health and Wellness Statistics
Arkansas ranks 45th in senior well-being, indicating challenges across various health, economic, and social metrics for older adults in the state, according to America’s Health Rankings.
| Strengths | Challenges |
|---|---|
| Low prevalence of excessive drinking | High early death rate |
| Low housing cost burden | High poverty rate |
| High percentage of older adults with a dedicated healthcare provider | High prevalence of physical inactivity |
- Drug-related deaths among adults aged 65+ increased 75%, from 4.0 to 7.0 per 100,000 between 2017-2019 and 2020-2022.
- Avoiding care due to cost rose 47%, from 3.4% to 5.0% between 2021 and 2022.
- The flu vaccination rate increased by 4%, reaching 66.7% of adults aged 65+ in 2022.
- Suicide rates were 7.6 times higher among men (39.6) than women (5.2) between 2020-2022.
- The early death rate among adults aged 65-74 was 3.2 times higher among white adults (2,682 per 100,000) compared to Asian adults (830 per 100,000).
Social and Economic Indicators for Seniors in Arkansas
| Metric | Value | Rank |
|---|---|---|
| Social and Economic Factors (Z-Score) | -0.985 | 48th |
| Firearm Deaths (Age 65+) | 20.5 deaths/100,000 | 42nd |
| Motor Vehicle Deaths (Age 65+) | 24 deaths/100,000 | 49th |
| Internet Crime Complaints (Age 60+) | 8.8 complaints/10,000 | 22nd |
| Food Insecurity (Age 60+) | 14.0% | 40th |
| Poverty (Age 65+) | 12.8% | 45th |
| Poverty Racial Disparity (Age 65+) | 2.6 | 24th |
| SNAP Reach (Age 60+) | 37.3/100 adults | 49th |
| College Graduates (Age 65+) | 22.5% | 47th |
| High-Speed Internet Access (Age 65+) | 79.2% | 47th |
Community Support and Social Engagement Metrics

- Elderly community engagement and support in Arkansas chart
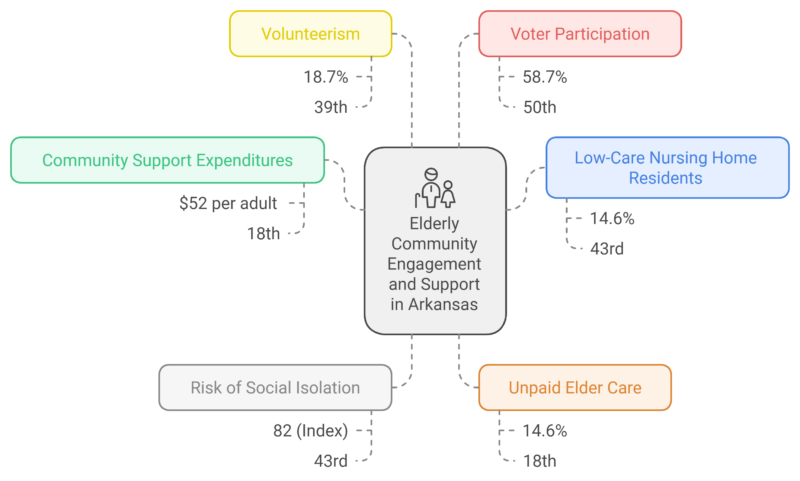
Arkansas seniors face significant challenges, particularly in health outcomes and economic factors. The high poverty rate (12.8%) and food insecurity (14.0%) suggest economic strain among older adults. Additionally, drug deaths and physical inactivity are growing concerns, contributing to Arkansas’s low rank.
While Arkansas performs well in community support expenditures and unpaid elder care, it struggles with low SNAP participation and limited high-speed internet access. Furthermore, motor vehicle deaths (24 per 100,000) and firearm deaths (20.5 per 100,000) reflect ongoing safety concerns for seniors.
Despite these challenges, Arkansas has some strengths, such as a low housing cost burden and a high percentage of older adults with a dedicated healthcare provider. However, increased efforts are needed to address economic disparities, promote physical activity, and improve healthcare access.
Migration Patterns
In State Migration

- State and country migration to Arkansas chart
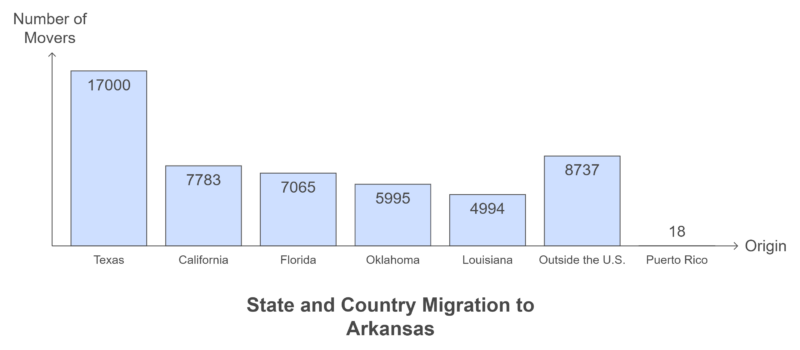
- Total Movers to Arkansas (2022): 86,375
- Increase from 2021: 10,000+
Arkansas has become an increasingly popular destination for movers, with Texas contributing the most new residents, followed by California, Florida, Oklahoma, and Louisiana. Additionally, 8,737 people moved from outside the U.S., reflecting growing international migration into the state according to KARK.
People Leaving Arkansas
| Destination State | Number of Movers |
|---|---|
| Texas | 17,000+ |
| Other States/Countries | ~57,000 |
| Delaware, ND, SD, DC | 0 |
While Arkansas attracted many newcomers, it also experienced a significant outflow, with over 17,000 residents relocating to Texas. No residents moved from Arkansas to Delaware, North Dakota, South Dakota, or Washington, D.C. during the year.
Net Population Growth
Arkansas experienced a net population increase, gaining over 16,000 new residents between 2021 and 2022. Despite losing a large number of residents to other states, the state’s inflow, particularly from Texas and international migrants, contributed to its overall growth.
International Migration Statistics (2025)
- Source: Youtube/Screenshot, As of 2023, around 162,000 people living in Arkansas were immigrants
In recent years, Arkansas has seen steady growth in its foreign-born population. As of 2023, approximately 162,000 residents of the state were immigrants, representing 5.3% of the total population.
This figure reflects an increase from previous years, with Arkansas experiencing significant migration trends fueled by individuals seeking economic opportunities and a lower cost of living according to the American Immigration Council.
Top Countries of Origin
Many immigrants in Arkansas originate from countries such as:
- Mexico (40% of immigrant population)
- El Salvador (12%)
- India (5%)
- Vietnam (4%)
- Guatemala (4%)
These migrants contribute to various industries in Arkansas, supporting sectors like manufacturing, construction, and healthcare.
Economic Impact of Migration
Immigrant workers play a vital role in the state’s workforce, comprising around 7% of all employed individuals. They are heavily represented in manufacturing, where they account for 14% of the labor force, as well as in construction, retail, and healthcare industries.
The growth in international migration has also contributed to population growth, helping offset outflows from the native population and stabilizing labor markets.
Recent Trends in Population Growth
Between 2020 and 2022, the state recorded an inflow of 4,754 foreign-born residents, demonstrating that migration has become an essential component of Arkansas’s demographic evolution.
These migration patterns, combined with state-to-state migration from within the U.S., have fueled both economic growth and housing demand, especially in urban areas like Fayetteville and Bentonville.
Crime Rates in Arkansas (2024)
- Crime rates In Arkansas (2024) chart
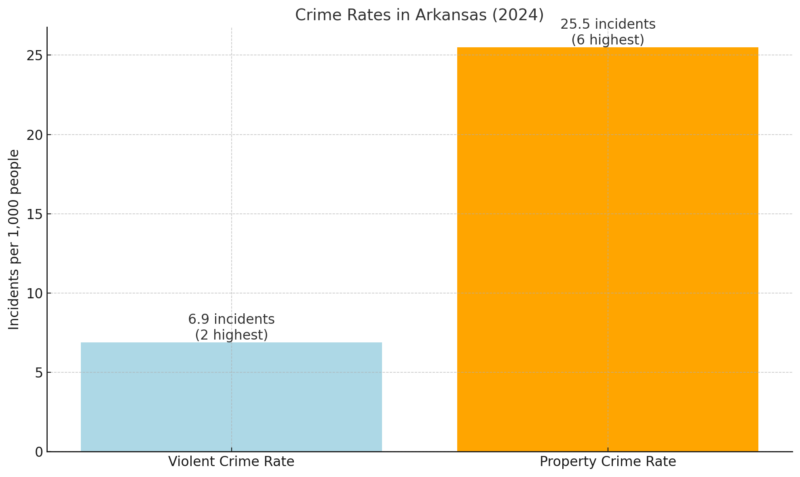
These crime rates reflect persistent concerns in the state. Despite the small improvement in overall crime, the violent crime rate remains a critical issue, ranking second-highest nationwide. Property crime also continues to affect residents, with Arkansas’s rate 23% higher than the national average according to Safewise.
Public Perception and Crime Experience in Arkansas
- 44% of respondents in the State of Safety survey feel safe in Arkansas (1% lower than the national average).
- 73% of Arkansans believe that crime is on the rise, signaling significant public concern.
- Arkansans report higher first-hand experiences with gun violence and package theft compared to the national average.
Property Crime

- Property crime in Arkansas chart
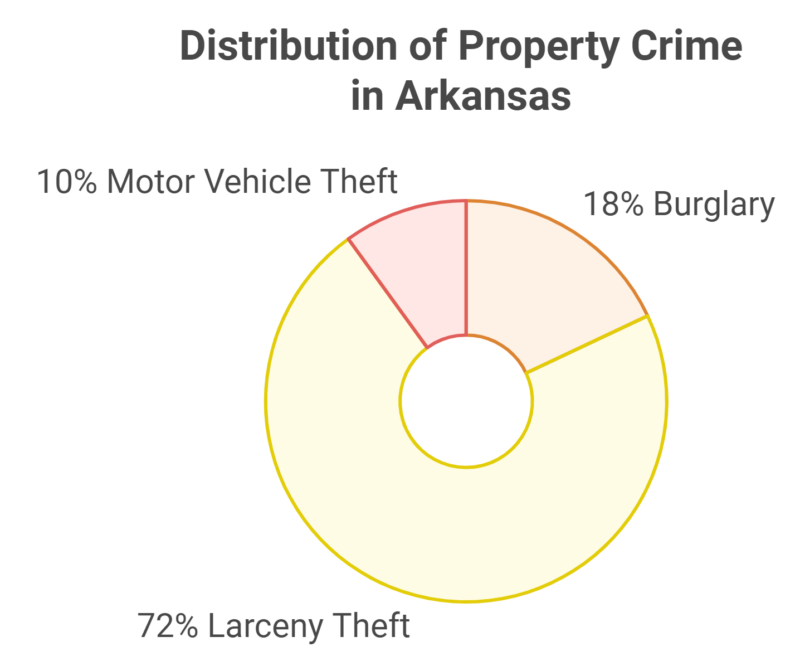
While burglary and larceny remain significant concerns, motor vehicle theft in Arkansas is 29% lower than the national average.
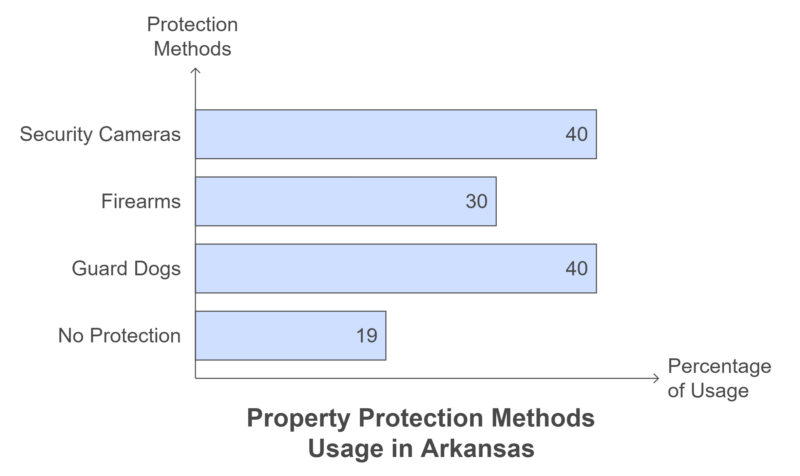
Property Protection Trends in Arkansas

- Property protection trends in Arkansas chart
Methodology
This article was compiled using the latest demographic, economic, and social data from reliable sources, including:
- World Population Review: Provided population counts, historical growth rates, and state ranking.
- U.S. Census Bureau: Contributed migration patterns, income distribution, housing, and labor force data.
- Bureau of Labor Statistics (BLS): Supplied employment and unemployment rates for Arkansas.
- American Immigration Council: Offered insights into international migration trends and immigrant contributions to the workforce.
- Arkansas State Data Center: Provided projected growth trends and age dependency ratios.
- Zillow: Shared housing market data, including home values and rental prices.
- Consumer Affairs and AAA: Contributed food and transportation cost comparisons with national averages.
We aimed to ensure the accuracy of the analysis by cross-referencing multiple sources and only including verified data. The focus was on providing concise insights while covering major trends, such as migration flows, economic conditions, and population changes.
Sources
- World Population Review – Arkansas Population 2024
- Neilsberg – Arkansas Population By Age
- KARK – Study: Arkansas ranks near bottom as a state with an educated population
- Statistical Atlas – Educational Attainment in Arkansas
- BLS – Economy At Glance
- Income By Zip Code –Arkansas Income Statistics for 2024
- Zillow – Arkansas Housing Market
- Consumer Affairs – Arkansas cost of living
- ACHI – Report Ranks Arkansas 45th for Health, Well-Being of Older Adults
- KARK – Hello Arkansas: People from these states are moving to the Natural State
- American Immigration Council – Immigrants in Arkansas
- Safewise – Arkansas’s Safest Cities of 2024


