
For nearly two thousand years, the average heights of Europeans did not change. If you could put a Roman soldier, a medieval peasant, and an 18th-century farmer in the same room, they would be the exact same height.
Skeletal records analyzed by Richard Steckel show that men averaged around 170 centimeters from the Roman Empire right through the Middle Ages, while women averaged around 160 centimeters.
Empires rose and fell, wars changed borders, and wealth moved around, but the basic conditions for regular people never got better. Things like childhood nutrition, daily calorie intake, and exposure to disease remained completely unchanged for generations.
The real change happened during the 19th century.
Suddenly, people started growing taller. Industrial farming made food supplies more reliable, and early public health projects finally brought cleaner drinking water to cities. Because kids were no longer constantly fighting off heavy infections, their bodies could use that energy to grow instead.
We know this because governments stopped relying on old bones and started tracking real data through military recruitment records and health surveys.
In the United States and Sweden, the data shows a clear, steady climb. By the end of the 20th century, the average native-born American man reached over 177 centimeters, with Swedish men hitting the same kind of upward trajectory.
Those extra inches are a direct reflection of social progress. They offer concrete proof that better maternal care, cleaner environments, and modern medicine fundamentally altered human development.
Key Takeaways
How Much Taller Are We Today? Looking at the Last 200 Years
View this post on Instagram
Over the last 200 years, the human body did something incredible: we grew taller, and we did it fast. It is one of the biggest biological shifts in history, but it happened so gradually that we barely noticed.
Our height is not just about genetics. It is actually a direct reflection of our environment. When a society gets better access to clean water, reliable food, and decent healthcare, children grow taller. Because of this, historical average height act like a mirror for a country’s actual quality of life.
We know exactly how much things changed thanks to researchers at the University of Tübingen. They used a massive dataset put together by economic historians Joerg Baten and Matthias Blum. They tracked average male heights all over the world from 1810 to 1980, and some of their data goes all the way back to 1750.
Most of these numbers come from old military draft files, prison logs, and hospital archives. Since governments back then only kept detailed records for men, like soldiers, servants, and laborers, the data does have its limits.
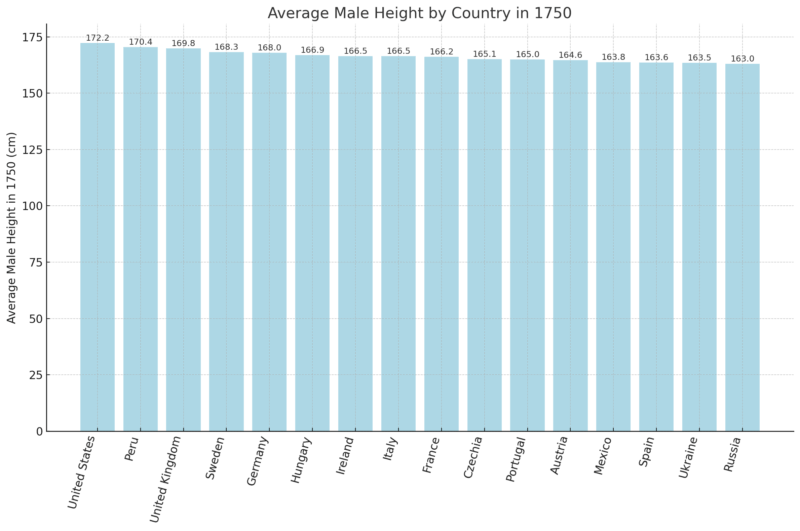
Still, the numbers paint a clear picture. Back in the mid-1700s, people were short everywhere. American men were actually the tallest in the world at the time, averaging 172.2 centimeters. Peru was right behind them at 170.4 centimeters, and the UK sat at 169.8 centimeters.
On the other end of the scale, men in Central and Eastern Europe were significantly shorter, with places like Russia, Austria, and Ukraine averaging well under 165 centimeters.
The table below shows a selection of countries with available data on average male height around 1750:
Why Are We Suddenly So Much Taller?
If you look at wealthier countries over the last two and a half centuries, the average man has gained a massive 10 to 20 centimeters.
The 19th century completely flipped the script, and by the 200s, human growth went into overdrive.
Our DNA did not change overnight. Instead, we just stopped letting dirty living conditions stunt our kids. It all came down to the basics of civil engineering and medicine. Once cities finally separated sewage from drinking water, piped clean water directly into homes, and handed people tools like antibiotics, our bodies finally had the chance to grow.
The Netherlands is the best proof of how fast this can happen. We do not even have deep historical records for them from the early days, but today, Dutch men are the tallest on the planet, averaging over 183 centimeters.
This progress completely bypassed regions facing war, political instability, and food shortages. Across parts of sub-Saharan Africa and Asia, average heights have stagnated for a century.
In areas hit hardest by conflict and poverty, people are actually shorter than their grandparents because children lacked basic nutrition and medicine.
How Has Height Changed Around the World?
We are a lot taller than our great-grandparents. You can easily spot the difference in tiny vintage clothes, old low doorways, and family photos.
Cleaner water, steady meals, and basic healthcare allowed kids over the last century to reach their full growth potential.
So how many centimeters did we actually gain? Did every country keep up?
In 2016, the NCD Risk Factor Collaboration (NCD-RisC) published a massive dataset compiling adult height estimates from across the world. This research analyzed millions of datapoints from health surveys, academic studies, and demographic records to track how average height has changed by birth cohort—that is, by year of birth.
Importantly, this dataset includes only adults aged 18 and older, so it reflects final adult height rather than childhood growth projections.
On average, men and women born in the early 21st century are about 10 centimeters taller than those born in the early 20th century. That’s an increase of roughly 5% in body height, achieved within the span of just four or five generations.
In countries with the most dramatic gains—such as South Korea, Iran, the Netherlands, and parts of Scandinavia—the change is even more striking. For example, South Korean women born in 1996 were nearly 20 cm taller on average than those born in 1896, according to NCD-RisC data.
How Tall Are People Around the World? Global Averages for Height, Weight, and BMI by Country
The Netherlands takes the number one spot. Dutch men average 1.84 meters, and Dutch women average 1.70 meters. Balkan countries, including Montenegro, Bosnia and Herzegovina, and Serbia, follow right behind.
On the other end of the scale, South and Southeast Asian countries like Bangladesh, India, Cambodia, and Indonesia have the shortest averages. Men there are around 1.65 meters, while women are usually under 1.55 meters.
The United States sits in the upper-middle. American men average 1.77 meters and women hit 1.63 meters.
These numbers are below Northern and Eastern Europeans but above most of Asia and Latin America.
Country
Male Height
Male Weight
Male BMI
Female Height
Female Weight
Female BMI
Netherlands
1.84 m
87.2 kg
25.9
1.70 m
72.9 kg
25.2
Montenegro
1.83 m
89.4 kg
26.7
1.70 m
73.0 kg
25.4
Estonia
1.82 m
90.9 kg
27.3
1.68 m
74.2 kg
26.2
Denmark
1.82 m
86.1 kg
26.1
1.69 m
70.5 kg
24.7
Bosnia and Herzegovina
1.82 m
89.7 kg
27.2
1.67 m
72.5 kg
26.0
Iceland
1.81 m
89.8 kg
27.3
1.68 m
73.7 kg
26.0
Czechia
1.81 m
91.2 kg
27.9
1.68 m
74.2 kg
26.4
Slovenia
1.81 m
89.9 kg
27.5
1.67 m
70.6 kg
25.3
Slovakia
1.81 m
91.5 kg
28.0
1.67 m
73.0 kg
26.2
Croatia
1.81 m
92.3 kg
28.3
1.67 m
75.3 kg
27.1
Serbia
1.80 m
89.2 kg
27.4
1.68 m
72.3 kg
25.6
Sweden
1.80 m
86.2 kg
26.5
1.67 m
69.9 kg
25.2
Norway
1.80 m
88.1 kg
27.1
1.66 m
71.7 kg
25.9
Lithuania
1.80 m
90.0 kg
27.7
1.67 m
74.2 kg
26.5
Poland
1.80 m
91.6 kg
28.2
1.65 m
72.6 kg
26.5
Ukraine
1.80 m
86.3 kg
26.6
1.66 m
74.3 kg
26.9
Finland
1.80 m
87.3 kg
26.9
1.66 m
72.9 kg
26.4
Latvia
1.80 m
89.2 kg
27.5
1.68 m
74.5 kg
26.4
Germany
1.80 m
87.8 kg
27.1
1.66 m
71.4 kg
25.9
Dominica
1.80 m
81.7 kg
25.3
1.67 m
82.4 kg
29.7
Belgium
1.79 m
84.9 kg
26.5
1.64 m
69.9 kg
26.1
Bermuda
1.79 m
84.9 kg
26.5
1.66 m
80.1 kg
29.2
Greece
1.79 m
89.1 kg
27.9
1.65 m
74.2 kg
27.1
Puerto Rico
1.79 m
91.0 kg
28.5
1.63 m
79.7 kg
30.0
Switzerland
1.79 m
82.9 kg
26.0
1.64 m
64.5 kg
24.0
Australia
1.79 m
89.6 kg
28.1
1.65 m
74.2 kg
27.4
Ireland
1.79 m
88.6 kg
27.8
1.64 m
73.9 kg
27.4
Canada
1.78 m
88.2 kg
27.7
1.65 m
73.2 kg
27.0
Austria
1.78 m
83.9 kg
26.4
1.66 m
68.1 kg
24.6
France
1.78 m
79.2 kg
24.9
1.64 m
65.2 kg
24.1
United States
1.77 m
91.5 kg
29.3
1.63 m
78.9 kg
29.7
United Kingdom
1.78 m
87.4 kg
27.6
1.64 m
73.6 kg
27.4
South Korea
1.75 m
76.5 kg
25.0
1.63 m
61.6 kg
23.3
Japan
1.72 m
70.7 kg
24.0
1.58 m
55.3 kg
22.1
China
1.75 m
75.6 kg
24.8
1.63 m
63.3 kg
23.9
India
1.66 m
63.4 kg
23.1
1.55 m
56.3 kg
23.5
Bangladesh
1.65 m
60.4 kg
22.3
1.52 m
54.4 kg
23.5
Vietnam
1.68 m
63.2 kg
22.4
1.58 m
55.7 kg
22.4
Indonesia
1.66 m
63.6 kg
23.2
1.54 m
59.8 kg
25.2
Mexico
1.70 m
81.1 kg
28.1
1.57 m
72.4 kg
29.2
Brazil
1.75 m
82.5 kg
26.9
1.62 m
72.9 kg
27.8
Argentina
1.74 m
86.2 kg
28.4
1.61 m
73.5 kg
28.4
Egypt
1.73 m
83.1 kg
27.8
1.60 m
80.7 kg
31.5
Turkey
1.76 m
84.3 kg
27.3
1.61 m
76.1 kg
29.2
Iran
1.75 m
79.7 kg
26.1
1.61 m
71.8 kg
27.7
Saudi Arabia
1.70 m
83.0 kg
28.7
1.58 m
74.6 kg
29.8
South Africa
1.69 m
70.5 kg
24.6
1.58 m
74.8 kg
29.8
Nigeria
1.70 m
67.9 kg
23.6
1.58 m
62.2 kg
25.0
Kenya
1.70 m
65.1 kg
22.6
1.59 m
64.0 kg
25.3
Ethiopia
1.68 m
58.2 kg
20.7
1.57 m
53.6 kg
21.8
Ghana
1.69 m
66.9 kg
23.3
1.59 m
65.1 kg
25.9
Algeria
1.74 m
77.3 kg
25.6
1.62 m
73.1 kg
27.9
Morocco
1.75 m
77.1 kg
25.1
1.61 m
71.2 kg
27.6
Tunisia
1.74 m
82.0 kg
27.1
1.62 m
70.3 kg
26.7
Libya
1.77 m
89.3 kg
28.5
1.63 m
78.6 kg
29.6
Sudan
1.71 m
69.3 kg
23.7
1.60 m
65.0 kg
25.5
Somalia
1.70 m
65.0 kg
22.4
1.59 m
65.2 kg
25.7
Zambia
1.73 m
73.1 kg
24.4
1.60 m
66.7 kg
25.9
Zimbabwe
1.70 m
65.7 kg
22.8
1.60 m
65.9 kg
25.9
Botswana
1.74 m
75.6 kg
25.0
1.60 m
69.2 kg
27.0
Namibia
1.72 m
72.2 kg
24.4
1.59 m
67.1 kg
26.6
Lesotho
1.73 m
71.5 kg
23.9
1.59 m
66.4 kg
26.2
Angola
1.68 m
64.7 kg
23.0
1.58 m
61.9 kg
24.9
DR Congo
1.68 m
62.7 kg
22.3
1.56 m
56.9 kg
23.4
Gambia
1.68 m
67.2 kg
23.9
1.61 m
66.2 kg
25.4
Cameroon
1.71 m
70.5 kg
24.1
1.60 m
66.1 kg
25.8
Togo
1.71 m
68.5 kg
23.4
1.60 m
62.3 kg
24.3
Sierra Leone
1.68 m
66.4 kg
23.5
1.58 m
62.7 kg
25.0
Mozambique
1.68 m
60.0 kg
21.3
1.58 m
55.2 kg
22.1
Madagascar
1.65 m
60.6 kg
22.3
1.53 m
51.3 kg
22.0
Central African Republic
1.70 m
65.8 kg
22.8
1.58 m
61.3 kg
24.6
Chad
1.68 m
63.4 kg
22.4
1.58 m
60.0 kg
24.0
Rwanda
1.68 m
60.6 kg
21.5
1.56 m
53.0 kg
21.8
Burundi
1.67 m
63.0 kg
22.7
1.55 m
51.7 kg
21.6
Malawi
1.69 m
65.3 kg
22.9
1.59 m
60.2 kg
23.8
Average Heights and Weights by Continent and Subregion

Want to compare your height or weight? Country averages can help, but regional data gives a clearer picture.
Northern Europeans are typically taller and heavier than Southern Europeans. In Asia, body sizes differ sharply between South Asia and East Asia.
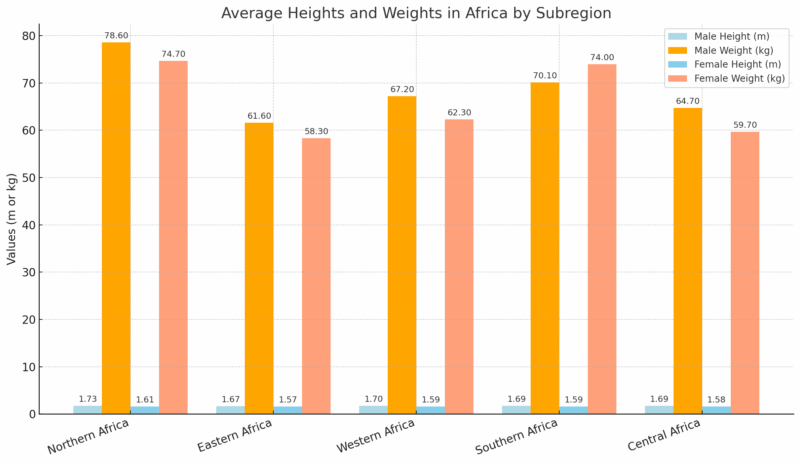
Africa
America
Subregion
Male Height
Male Weight
Female Height
Female Weight
Caribbean
1.74 m
77.3 kg
1.61 m
70.8 kg
North America
1.75 m
88.6 kg
1.62 m
76.8 kg
South America
1.73 m
81.1 kg
1.60 m
71.4 kg
Central America
1.68 m
76.0 kg
1.54 m
67.9 kg
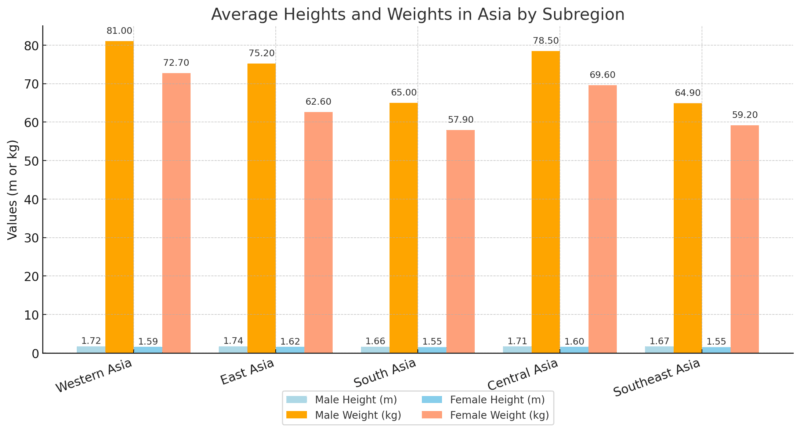
Asia
Europe
Subregion
Male Height
Male Weight
Female Height
Female Weight
Western Europe
1.80 m
84.2 kg
1.66 m
68.8 kg
Southern Europe
1.76 m
82.8 kg
1.62 m
67.6 kg
Northern Europe
1.79 m
87.4 kg
1.65 m
73.0 kg
Eastern Europe
1.78 m
86.4 kg
1.65 m
72.4 kg
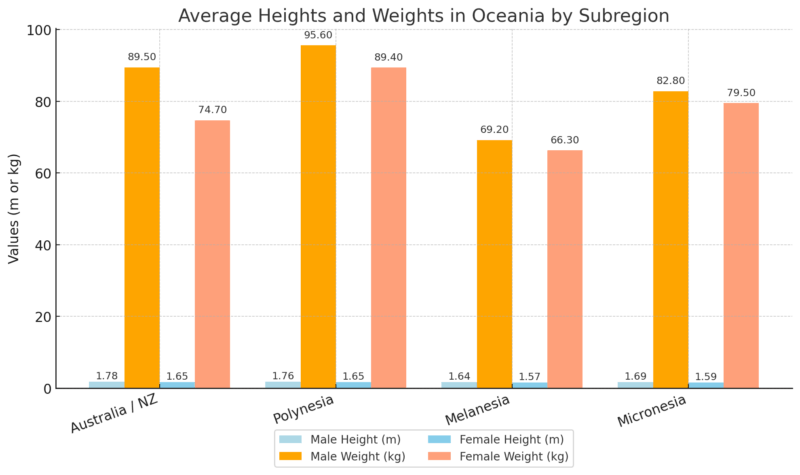
Oceania
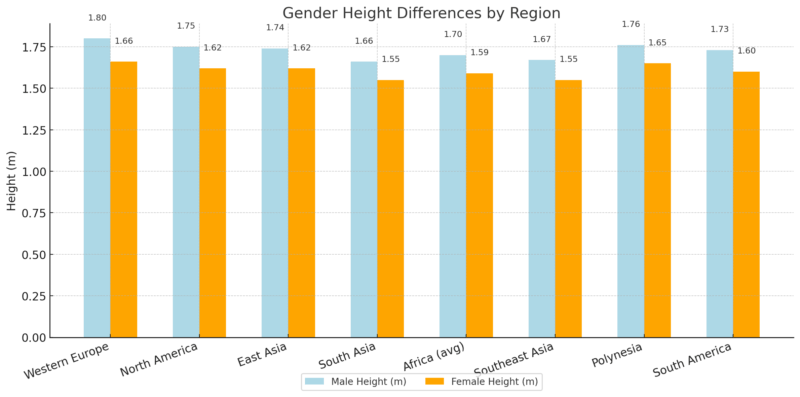
Gender Differences in Height – How Much Taller Are Men Than Women?
Men are taller than women everywhere on earth. No matter the country or area, that gap stays the same.
Men Are 12 cm Taller Everywhere
Back in 1996, the gap froze at about 12 centimeters (4.5 inches). Even as everyone grew taller over the years, that distance never closed.
The data back this up completely. If you put male and female heights on a chart, every country lines up exactly the same way.
Nowhere on Earth do the numbers flip.
Gender Height Differences by Region
Here’s a quick look at the average male-female height gap in various parts of the world (based on global height data from people born in the 1990s):
Human Height in Prehistoric Times – What Bones Tell Us?
@artlust #arthistory #historytiktok #historytok ♬ original sound – Yt @art_lust
Looking back at prehistoric times or traditional communities that lived off the land well into the 20th century, a clear pattern emerges.
Skeletal remains and ethnographic studies of hunter-gatherers show that human height stayed flat for thousands of years. Aside from a few temporary local spikes, generations looked their ancestors right in the eye.
Malthusian theory explains why: extra food just brought more mouths to feed, not taller people. Living conditions and physical height stayed totally flat because population growth swallowed every spare resource.
Heights in Modern Foraging and Subsistence Societies
Many groups still lived traditional or semi-nomadic lives well into the 19th and 20th centuries. Direct measurements from these communities show adult men typically averaged between 155 and 172 cm.
Year
Group
Region
Age Range
Avg. Male Height
1892
Plains Indians
United States
23-49
172 cm
1970s
Anbarra
Australia
Adults
172 cm*
1970s
Rembarranga
Australia
Adults
171 cm*
1910
Alaskan Inuit
United States
Adults
170 cm*
1890
Northern Pacific Indians
United States
Adults
167 cm*
1944
Sandawe
Tanzania
Adults
167 cm*
1891
Shoshone
United States
20-59
166 cm
1970s
Fox Basin Inuit
Canada
Adults
166 cm*
1880s
Solomon Islanders
Solomon Islands
Adults
165 cm*
1906
Canadian Inuits
Canada
Adults
164 cm*
1969
!Kung
Botswana
21-40
163 cm
1980s
Ache
Paraguay
Adults
163 cm*
1970s
Hadza
Tanzania
Adults
163 cm*
1985
Hiwi
Venezuela
Adults
156 cm*
1980s
Batak
Philippines
Adults
155 cm*
1980s
Agta
Philippines
Adults
155 cm*
1980s
Aka
Central African Republic
Adults
155 cm*
Asterisks(*) mark data from field studies that lack exact age breakdowns. Living without modern medicine or industrial food systems, these communities show exactly how the human body developed before the modern era.
Skeletons Tell the Story – 10,000 Years of Human Height
Skeletal records from the Mesolithic era, around 10,000 years ago, prove that early humans walked around at heights shockingly close to many people today.
Growth never followed a steady upward line back then. Numbers just drifted up or down based on local food supply, disease outbreaks, and crowded living conditions.
| Period | Region | Sample Size | Avg. Male Height |
| Mesolithic (8000 BC) | Europe | 82 | 168 cm |
| Neolithic (5000-3000 BC) | Europe | 190 | 167 cm |
| Neolithic Denmark | Denmark | 103 | 173 cm |
| 1600-1800 | Holland | 143 | 167 cm |
| 1700-1800 | Norway | 1956 | 165 cm |
| 1700-1850 | London | 211 | 170 cm |
| Pre-Dynastic Egypt | Egypt | 60 | 165 cm |
| Dynastic Egypt | Egypt | 126 | 166 cm |
| 2500 BC | Turkey | 72 | 166 cm |
| 1700 BC | Lerna, Greece | 42 | 166 cm |
| 2000-1000 BC | Harappa, India | — | 169 cm |
| 300 BC-AD 250 | Japan (Yayoi period) | 151 | 161 cm |
| 1200-1600 | Japan (Medieval) | 20 | 159 cm |
| 1603-1867 | Japan (Edo period) | 36 | 158 cm |
| 1450 | Marianas, Taumako | 70 | 174 cm |
| 1650 | Easter Island | 14 | 173 cm |
| 1500-1750 | New Zealand | 124 | 174 cm |
| 1400-1800 | Hawaii | — | 173 cm |
Is the Growth in Height Slowing Down?

Over the last hundred years, people around the world have grown noticeably taller. Across every continent, both men and women saw steady increases in average height throughout the 20th century. Better nutrition, improved healthcare, and cleaner environments helped fuel this trend.
But in recent decades, something has shifted.
When we look at the year-on-year changes in average height—how much people have grown from one generation to the next—the global pattern starts to flatten. In some regions, it’s not just slowing down. In certain countries, average height is no longer increasing. In a few, it’s even declining.
What the Data Tells Us
Charts tracking yearly changes in male and female height show a few clear trends:
- Growth happens in slow motion: Annual numbers barely budge. You cannot spot the change over a year or two, but zooming out across decades reveals a clear direction.
- The 1900s brought a massive global growth spurt: From the turn of the century up to the early 2000s, average heights climbed in every single corner of the globe for both men and women.
- Gains are hitting a wall: The upward trend has completely stopped in several places. Men across Europe and Central Asia stopped getting taller, while women in North America hit a flat plateau.
- Some countries are actively losing height: Average numbers are going backwards. Recent data out of the Middle East, North Africa, East Asia, and Sub-Saharan Africa shows both men and women are actually getting shorter.
Why Would Height Stop Increasing?
Falling heights make no sense when global living standards keep going up, but the data points to clear, messy problems:
- Empty calories: Modern diets often provide plenty of cheap food but leave out the actual protein and micronutrients bones need to grow.
- Sick kids stay short: Bad nutrition during pregnancy and constant childhood infections lock down physical growth early on, regardless of a country’s economic boom.
- Averages lie: National numbers hide massive class divides. Rich kids keep getting taller while the poorest stay trapped in bad health, dragging down the overall country score.
- Heavy instead of tall: Fast food and sugary drinks are packing weight onto children without giving their bodies the fuel to actually grow upwards.
How Nutrition Shapes Human Height
Food serves as the direct building block for the body. Lacking proper fuel during rapid childhood development slows down the entire system, leading to stunting and shorter adult statures.
The body needs specific building blocks rather than generic calories. Protein builds and repairs bone and muscle tissues during key growing years.
While the body manufactures some amino acids on its own, essential amino acids must come straight from food. A quality diet has to supply all of them.
Scientists measure this value using the PDCAAS score (Protein Digestibility Corrected Amino Acid Score). This rating shows exactly how complete a protein is and how easily the body absorbs it.
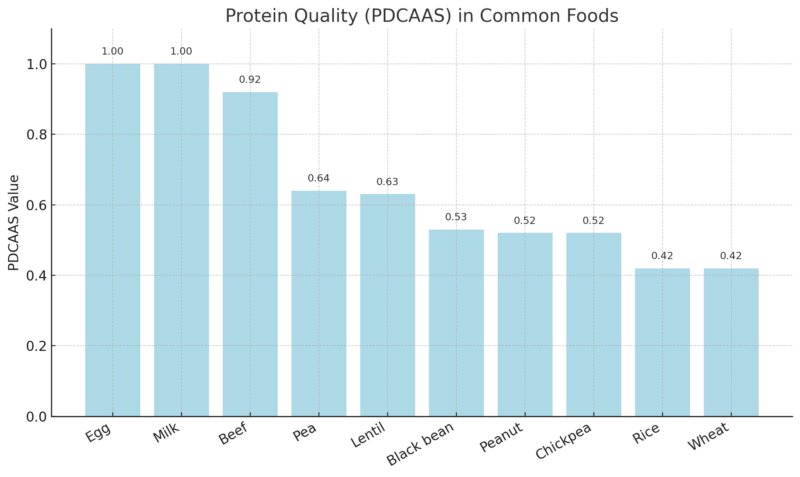
Animal foods like eggs, milk, and beef top the scale, offering the most complete and absorbable protein for human growth along with critical iron and zinc.
A 2018 study by Headey showed that populations in lower-income nations grow taller when they consume more dairy, meat, or fish.
The strongest predictor of male height was how much high-quality animal protein people ate compared to low-quality plant proteins. Populations built on milk products, red meat, and fish consistently tower over populations reliant on cereals and grains.
Money alone does not dictate height. Some wealthy nations lag behind economic peers because their diets lack protein diversity. Relying heavily on a single plant staple, like rice in Bangladesh, starves the body of the diverse amino acids needed for max growth.
Even pairing grains with legumes helps bridge the gap, but diets in poorer regions remain far too restricted to trigger full growth potential.
Methodology
This analysis combines historical, medical, and skeletal research, relying on NCD-RisC data, peer-reviewed studies, and archaeological findings.
- Long-term height trends come from military enlistment records, historical health surveys, and excavated skeletons.
- Cross-referencing average heights, weights, and BMI values across borders highlights regional and sex differences.
- PDCAAS scores map out the direct tie between protein quality and physical growth, while prehistoric forager data establishes the baseline for human height before the industrial age.
References
- ResearchGate – New Light on the Dark Ages: The Remarkably Tall Stature of Northern European Men during the Medieval Era
- ResearchGate – Global Height Trends in Industrial and Developing Countries 1810-1984: An Overview
- NCD Risk Factor Collaboration (NCD‑RisC) – NCD-RisC archives
- Our World in Data – Average height of men for selected countries
- Our World in Data – Mean height males vs females
- FindResearcher (University of Southern Denmark) – Ethnographic study on foragers and subsistence groups (AJPA article)
- Our World in Data – Share of calories from animal protein vs mean male height
- Wiley Online Library – Study by Headey on animal-source foods and height (2018)
- ScienceDirect – Grasgruber et al. (2014) on protein quality and male height