Rehabilitation programs are about giving people a second chance, and some California counties are excelling at it.
While we eagerly await the latest data for 2025, the most recent numbers from 2022 reveal a lot about where rehabilitation efforts are succeeding.
This analysis is based on data from CalHHS, and we’ll be sure to update this article as soon as the 2025 data becomes available.
For now, let’s look at the countries that are leading the way in successful rehabilitation outcomes each one has a story to tell about what’s working and where others might follow their lead.
Key Statistics
County
Total Successful Closures
Key Age Group
Los Angeles
2,301
30–39
Orange
540
20–29
San Diego
539
20–29
Riverside
367
20–29
Sacramento
384
20–39
San Bernardino
375
20–29
Santa Clara
249
20–39
Ventura
235
20–29
San Mateo
190
20–39
Santa Barbara
179
20–39
1. Los Angeles County
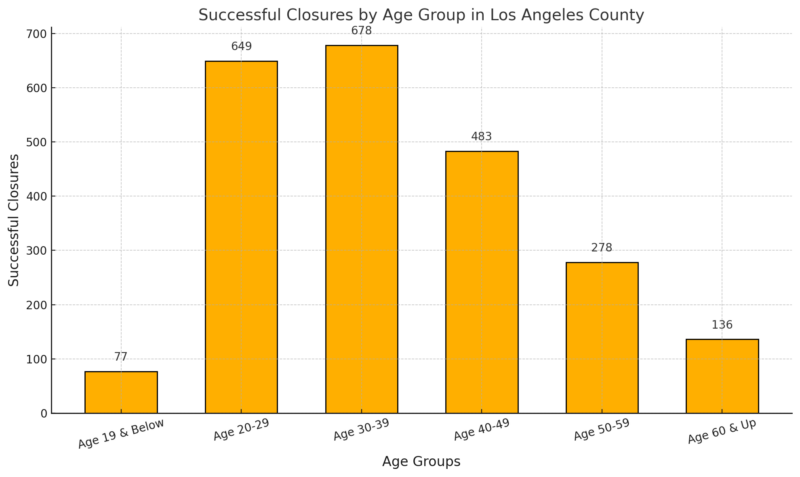
Los Angeles County leads the state with an impressive number of successful rehabilitation closures, totaling 2,301.
The largest share of these successes is among individuals aged 30–39, reflecting targeted programs for this demographic.
Alcohol and Other Drug (AOD) Impact in LA County
In today’s world, the rise of dangerous drugs like fentanyl and other illegal drugs poses a grave threat to the wellbeing and safety of our children. ⁰⁰Parents play a vital role in educating their children about the dangers of drugs. Having open and honest conversations about… pic.twitter.com/YzhH0HeALF
— LA County Sheriffs (@LASDHQ) October 21, 2024
Substance use has a significant health, economic, and social impact in Los Angeles County, as reflected in these annual statistics.
Category
Annual Figures (LAC)
AOD-Related Deaths
2,990
AOD-Related ED Visits
146,087
AOD-Related Hospitalizations
139,179
Average AOD Hospital Charge
$103,372 per hospitalization
Total AOD Hospital Charges
$14.3 billion
DUI Arrests
23,583
DUI Collisions
11,940
DUI Injuries
7,143
DUI Fatalities
275
The economic burden of AOD use is immense, with over $14.3 billion in hospital charges annually in LAC alone according to LA County public health report.
This underscores the critical need for effective prevention and treatment programs.
2. Orange County
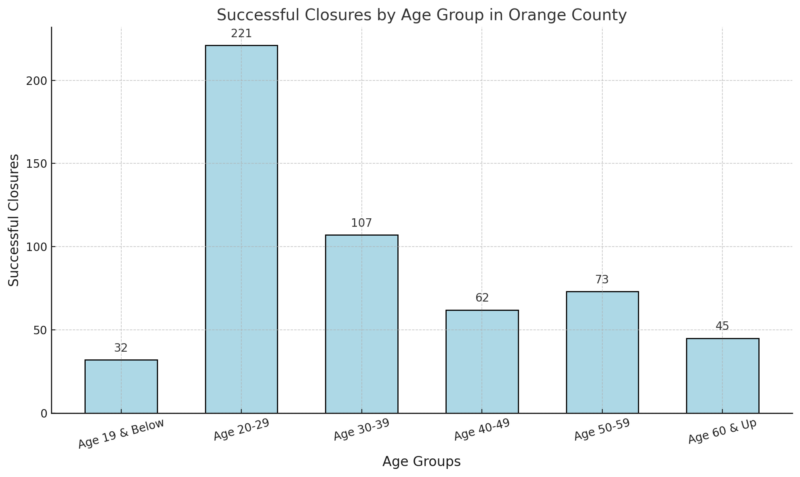
Orange County secures its position as a top performer with 540 successful closures.
The majority of these successes are among younger age groups, particularly those aged 20–39.
Drug and Alcohol-Related Mortality Rates
| Year | Total Deaths | Drug-Related Deaths | Alcohol-Related Deaths | Opioid Deaths |
|---|---|---|---|---|
| 2009 | 607 | 336 | 271 | N/A |
| 2019 | 782 | 413 | 369 | 274 |
| 2020 | 1,031 | 648 | 383 | 501 |
Drug and alcohol-related mortality has significantly increased in Orange County from 2009 to 2020, with a notable 34% rise between 2019 and 2020 as per OC Health Info Report.
Opioids were a major contributor to this increase, with a 45% rise in opioid-related deaths from 2019 to 2020.
If you’re interested in learning more about resources available in Orange County, including local programs in Santa Ana, click here to explore community-driven solutions and support systems that are making a difference.
3. San Diego County
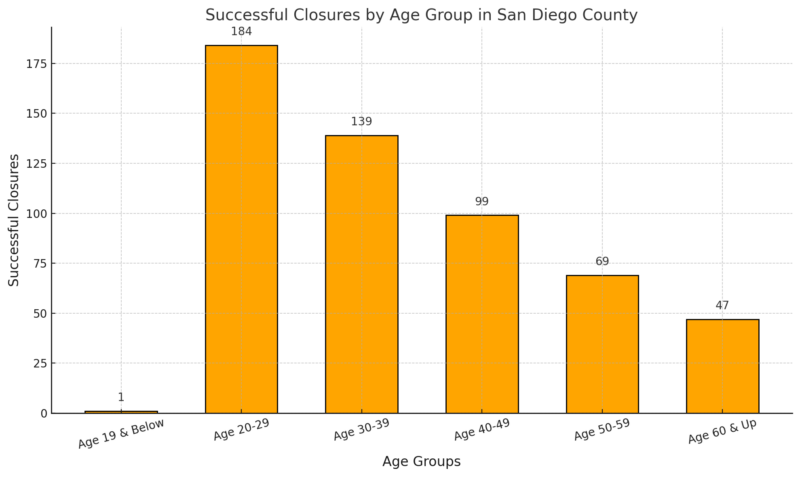
San Diego County’s successful closures total 539, with the most significant numbers in the 20–29 age group.
The county’s integrated approach, which combines mental health services, vocational training, and substance abuse treatment, is a key factor in its success.
lllicit Drug Positive Rates Among Arrestees (2021–2022)
Year
Male Positive Rate
Female Positive Rate
2021
83%
58%
2022
77%
75%
- Male Positive Rate: The rate for males testing positive for illicit drugs decreased by 6 percentage points in 2022, marking the first decline since 2018 according to Opendata. This suggests a potential reduction in drug-related arrests or changes in drug use patterns among males.
- Female Positive Rate: In contrast, the female rate rose sharply by 17 percentage points, highlighting an alarming trend that reverses prior decreases. This spike may be attributed to post-pandemic socioeconomic pressures or an increase in drug availability.
4. Riverside County
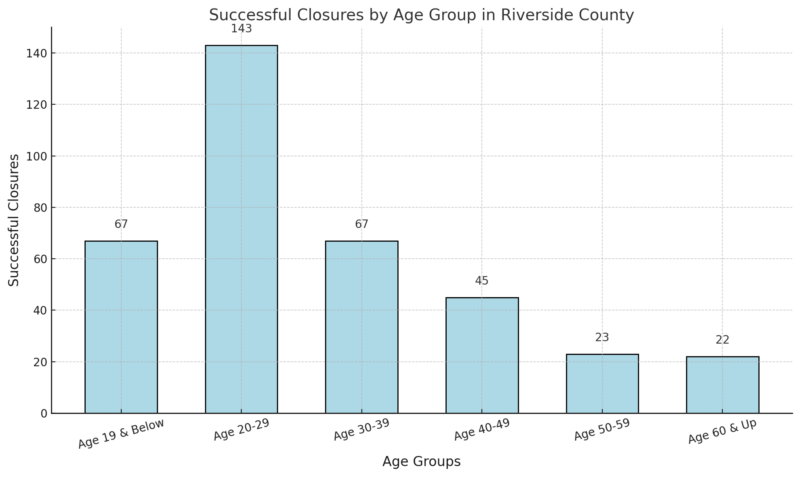
With 367 successful closures, Riverside County showcases its commitment to effective rehabilitation.
The county has prioritized youth rehabilitation, with the 20–29 age group seeing the highest number of closures.
Fatal Overdoses by Month (2023-2025)
- 2023: Fatal overdoses peaked in July (89 deaths) and October (78 deaths). The lowest numbers occurred in June (72 deaths) and November (55 deaths).
- 2024 (January to June): The highest count of overdoses occurred in March (64 deaths), with the lowest in February (39 deaths) according to Riverside University Health System.
- Trend: A noticeable fluctuation in fatal overdoses month-to-month, with a significant drop during the early 2025.
Fatal Overdoses by Age (2023-2024)
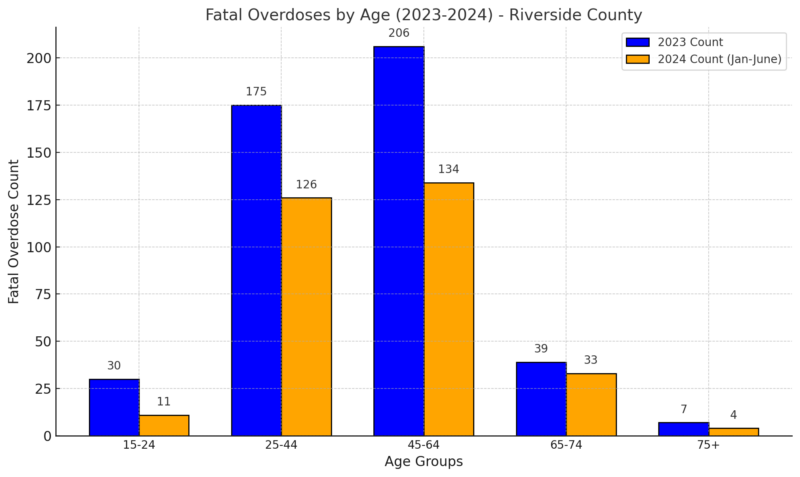
The 25-44 and 45-64 age groups consistently have the highest overdose rates.
Younger individuals (15-24) show a smaller but notable portion of deaths.
5. Sacramento County
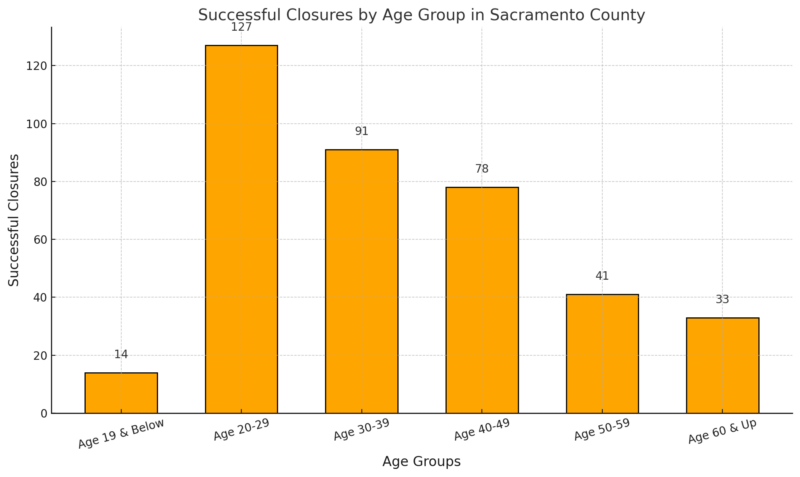
Sacramento County reports 384 successful closures, reflecting its investment in long-term rehabilitation strategies.
The county’s programs target individuals aged 20–39, ensuring critical life stages are supported.
Sacramento’s community centers and recovery hubs provide consistent follow-up and support, significantly reducing recidivism rates.
Sacramento County has achieved a significant milestone in combating the opioid crisis, reporting a 56% reduction in fentanyl-related deaths between 2023 and 2024.
The County Coroner’s Office recorded 180 fentanyl-related deaths so far this year, a substantial decrease from 406 in 2023.
6. San Bernardino County
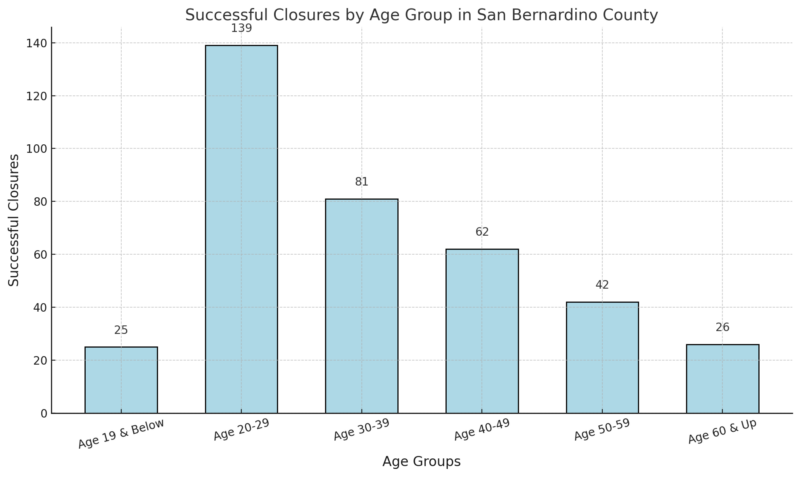
San Bernardino County has achieved 389 successful closures, with its strongest outcomes among young adults aged 20–29.
The county’s emphasis on community engagement and accessible support services is a standout feature.
Substance Abuse Trends in San Bernardino County
| Indicator | Value (Year) | Key Insights |
|---|---|---|
| SUD Treatment Admissions | ↓15% (2018/19 – 2019/20) | Opiate-related admissions increased by 103%, while alcohol-related admissions rose by 18%. Other substance admissions declined according to County sources. |
| Alcohol-Involved Collisions | 56 per 100,000 (2019) | Higher than the California average of 50 per 100,000. 77 fatalities reported in 2019. |
| Drug-Induced Deaths | 12.9 per 100,000 (2018) | Increased from 9.2 per 100,000 in 2012. |
| Liver Disease/Cirrhosis Deaths | 15.5 per 100,000 (2018) | Higher than the California average of 13.4 per 100,000. |
| Fentanyl-Related Deaths | 50-fold increase (2016-21) | Rapid surge, highlighting the growing fentanyl crisis. |
| Youth Served by SUD Services | 50% Latino (2021/22) | Reflects racial disparity and the need for targeted interventions in Latino communities. |
7. Santa Clara County
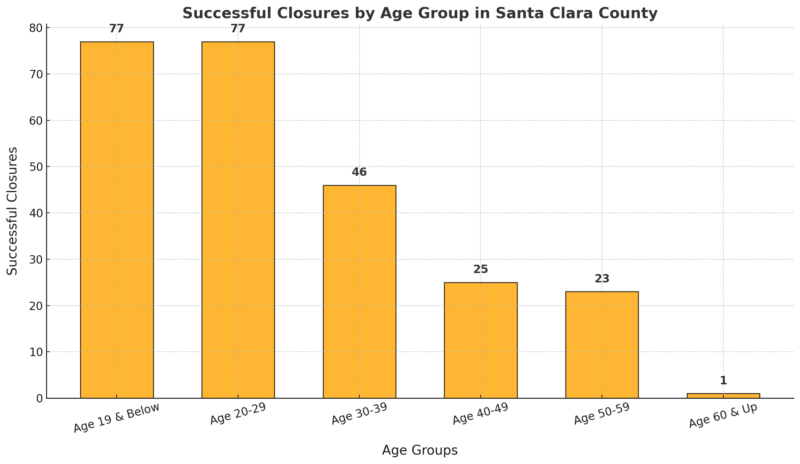
Santa Clara County’s 389 successful closures reflect a strong commitment to addressing rehabilitation needs.
With its advanced healthcare systems and mental health initiatives, the county ensures comprehensive care for its residents.
Opioid Crisis: Key Data Summary
Indicator
Value
Overdose Deaths
353 in 2022; 317 in 2023 (10% reduction)
Harm Reduction Program Participation
1,770 clients in 2023 (46% increase from 2022)
Funding
$11.15 million grant from CDC (2023, over five years)
Most Common Cause of Death
Methamphetamine and fentanyl
Naloxone Distribution and Resources
Expanded access through online resource hub
Demographics and Data
New overdose dashboard with breakdowns by age, sex, race/ethnicity, region, and substances involved
Post-Overdose Support Team
Launched in 2023, offering harm reduction tools, referrals to treatment, and support services
Overdose deaths peaked at 353 in 2022 but dropped to 317 in 2023, marking the first decline since 2014 as per some government officials say.
Participation in harm reduction programs rose by 46% from 2022, with 1,770 clients reached in 2023.
The CDC’s $11.15 million grant, awarded in 2023, supports a wide range of prevention and treatment activities, including equitable resource distribution across the county.
8. Ventura County
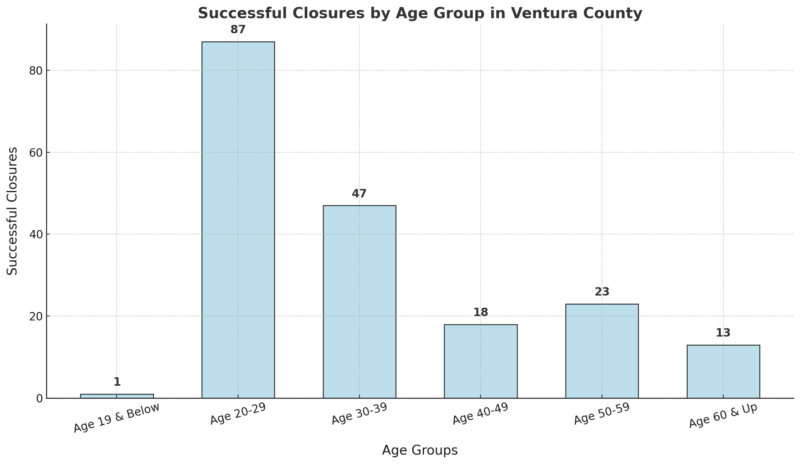
Ventura County has achieved 235 successful closures, with a balanced approach across multiple age groups.
The county’s focus on community-based rehabilitation, including partnerships with non-profits and local employers, has contributed significantly to its success.
Key Data Overview
Indicator
Value
Overdose Deaths (2023)
265 total deaths (8% decline from 2021)
Fentanyl-Related Deaths
178 deaths in 2023 (1.7% decline from 181 in 2022)
Methamphetamine-Related Deaths
94 deaths in 2023 (25% decline from 2022)
Cocaine-Related Deaths
22 deaths in 2023 (more than doubled from 2022)
Multiple Substances in Deaths
170 deaths involved more than one substance in 2023
Naloxone Success Rate
1,897 successful applications (2014-2022)
Top Locations for Fatal Overdoses
Ventura (82 deaths), Oxnard (77 deaths)
Age Distribution
70% of victims were in their 30s, 40s, or 50s
Pediatric Deaths (<18)
3 deaths in 2023
VCstar notes that overdose deaths have decreased for two consecutive years, reflecting successful intervention strategies. However, the total deaths in 2023 (265) remain higher than pre-2021 levels.
Substance-Specific Trends
- Fentanyl: A marginal decline in fentanyl-related deaths (178) indicates the continued dominance of this synthetic opioid in the illicit drug market.
- Methamphetamine: A notable 25% reduction in methamphetamine-related deaths (94) suggests some success in targeting this substance.
- Cocaine: The sharp rise in cocaine-related deaths (22) could signal emerging risks or an anomaly needing further investigation.
9. San Mateo County
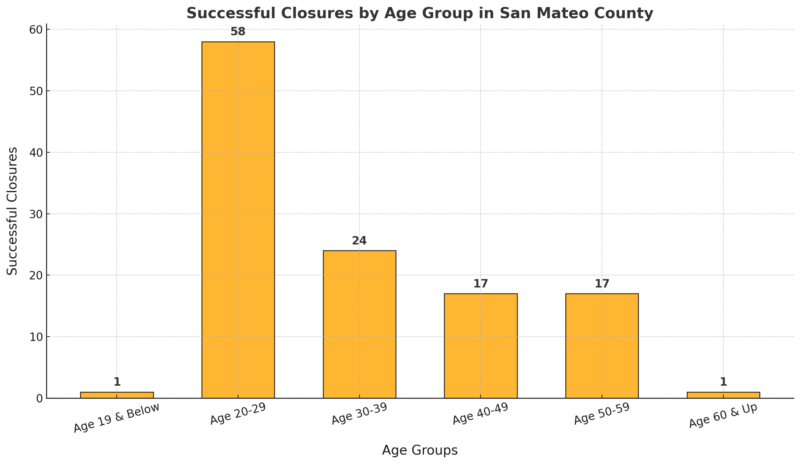
San Mateo County’s 190 successful closures highlight its commitment to effective rehabilitation.
The county places particular emphasis on addressing substance abuse and providing vocational training to ensure long-term success.
With strong outcomes among the 20–39 age groups, San Mateo is building a resilient and self-sufficient community.
10. Santa Barbara County
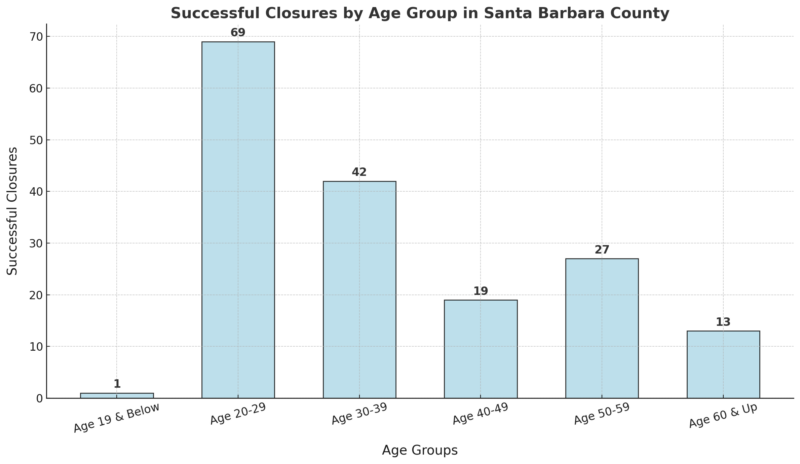
Santa Barbara County closes out the list with 179 successful closures, showcasing its ability to address the needs of diverse populations.
The highest closures are recorded among individuals aged 20–39, reflecting the effectiveness of programs targeting these groups.
Opioid Data
Indicator
Key Statistics
Opioid Prescription Rates
Declined 48% (2016-2022)
Overdose Deaths (2023)
130 opioid-related deaths, 86% involving fentanyl
Fentanyl-Related Deaths
Increased from 12 (2017) to 112 (2023)
Youth Opioid Misuse
4% of high school students reported misuse
Adult Opioid Use in Treatment
35% of adults in treatment cited opioids as primary drug
Naloxone Use (2021)
727 lives saved through administration
Hospital Interventions
190 patients started MAT during stays (2023)
Demographics of Overdose Deaths
71% male; highest among 35-44 age group
Stimulant and Opioid Co-Involvement
23% of deaths involved both substances
Santa Barbara County has made progress in reducing opioid-related deaths, with a notable decrease from 2022 to 2023 according to research data.
However, fentanyl remains a significant concern, driving most overdose fatalities. Naloxone and MAT programs show effectiveness in combating the crisis.
Youth misuse rates are low but still concerning due to potential addiction risks.
Efforts should focus on high-risk demographics, such as men aged 35-44, and regions like Santa Maria and Lompoc, where prescription rates and fatalities are higher.
Methodology
This article was created using data sourced from official public health reports, county health department statistics, and reliable databases such as CalHHS and the California Opioid Surveillance Dashboard.
We analyzed trends in rehabilitation program outcomes, opioid prescription rates, and substance-related mortality using recent data from 2022 and preliminary figures for 2023–2024.
Comparative metrics were calculated to highlight the progress and challenges across California counties.
Insights were supplemented with expert opinions and contextual information from local government reports and community health initiatives.
All figures and findings were cross-referenced to ensure accuracy and relevance for highlighting effective strategies in combating substance abuse.
References
- CalHHS – Vocational Rehabilitation Successful Closures by Age Group and County
- LA County Public Health – Substance Abuse Prevention and Control Data Brief
- OC Health Info – Drugs and Alcohol Report: ED, Hospital, and Death Data 2022
- San Diego Open Data – 2022 Adult Arrestee Drug Use in the San Diego Region
- Riverside University Health System – Drug Overdose and Substance Abuse Reports
- San Bernardino County Indicators – Substance Abuse Trends in San Bernardino County
- Santa Clara County Public Health – Santa Clara County Launches New Services to Prevent Overdoses and Save Lives
- Ventura County Star – Ventura County Overdose Deaths Dropped Slightly Last Year
- Santa Barbara Opioid Safety Coalition – Local Data on Opioid Safety and Overdose Trends


