
Drug overdose deaths remain a critical public health crisis in the United States, with recent data highlighting both alarming trends and areas of progress. Based on the most recent findings from the CDC, the number of reported overdose deaths for the 12-month period ending in July 2024 reached 90,157, with predicted deaths adjusted for underreporting estimated at 94,112.
This represents a marked decline of 16.9% from the previous year’s total, offering a glimmer of hope amidst an otherwise devastating epidemic.
Despite the decline in total overdose deaths, regional disparities remain significant. States such as Florida have experienced a 17.39% decrease in predicted cases (from 7,785 in July 2023 to 6,431 in July 2024), while jurisdictions like Alaska have reported a 40.6% increase, underscoring the uneven effectiveness of interventions across the nation.
Factors like insufficient time for community integration, disruptions due to the COVID-19 pandemic, and changes in the illicit drug market weakened these efforts. Additionally, the heavy focus on criminalization instead of public health solutions has not effectively reduced overdose rates, with experts emphasizing that punitive approaches often worsen the situation by deterring people from seeking help.
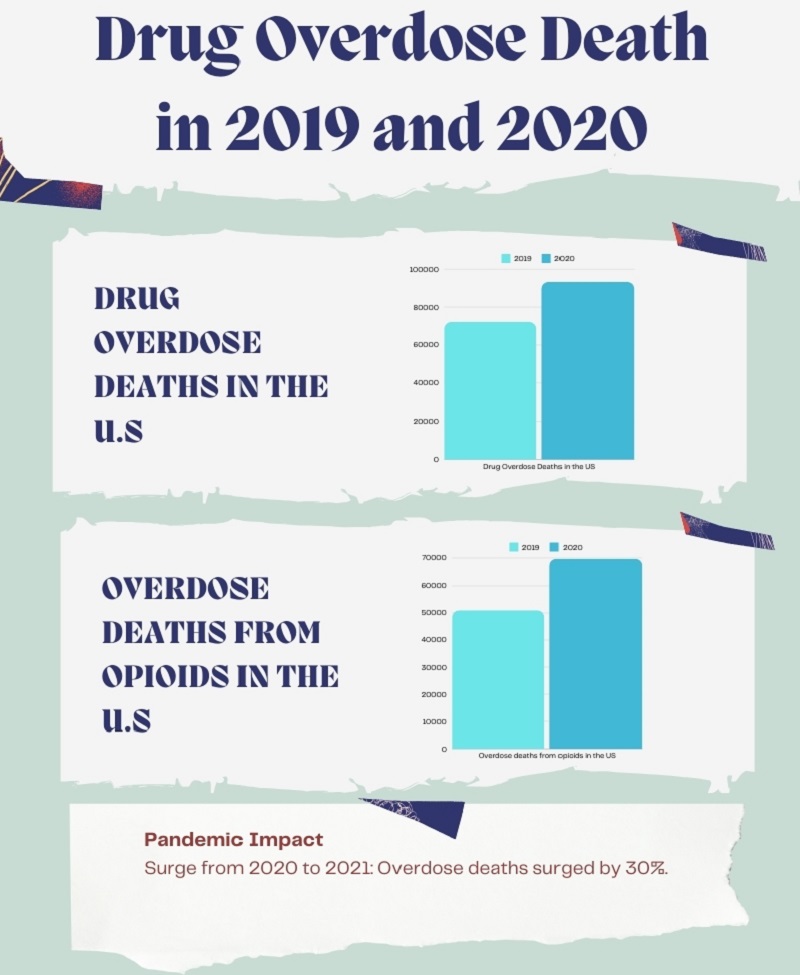
Drug Overdose Deaths in the U.S. Was Up Nearly 30% in 2020

The CDC’s National Center for Health Statistics has released full-year 2020 provisional drug overdose death data that estimates 93,331 drug overdose deaths in the United States during 2020, an increase of 29.4% from the 72,151 deaths predicted in 2019.
The data featured in an interactive web data visualization estimates that overdose deaths from opioids increased from 50,963 in 2019 to 69,710 in 2020. Overdose deaths from synthetic opioids (primarily fentanyl) and psychostimulants such as methamphetamine also increased in 2020 compared to 2019.
Cocaine deaths also increased in 2020, as did deaths from natural and semi-synthetic opioids (such as prescription pain medication).
Drug Overdose Deaths in the U.S. From 2020 to 2024

Overdose deaths skyrocketed during the pandemic, with a 30% increase from 2020 to 2021. Lockdowns, increased isolation, economic hardship, and disrupted healthcare services amplified the crisis, making it one of the deadliest periods in the overdose epidemic.
Data reveal a nearly 7% rise in drug overdose deaths in the United States, increasing from 101,167 in the 12 months ending April 2021 to 108,174 in the same period ending April 2022. Opioid-involved overdose deaths also climbed to 81,692 during this timeframe, up from 76,383 the previous year.
Deaths involving synthetic opioids (excluding methadone; T40.4), psychostimulants with abuse potential (T43.6), and cocaine (T40.5) continued to show an upward trend compared to the previous year.
U.S. drug overdose deaths dropped slightly in 2023, according to early data from the CDC, the first annual decrease in drug overdose deaths since 2018. https://t.co/fkJpaEShzV
— The Hill (@thehill) May 19, 2024
Data from 2023 shows a slight decrease in overdose deaths, the first drop since 2018. The decrease, around 3%, brought deaths down to about 107,543 in 2023. States like Ohio saw significant reductions, likely due to a temporary decrease in fentanyl production in Mexico.
However, other regions like Alaska and Washington experienced ongoing increases, reflecting uneven progress across the country. [1]
Fentanyl remains the primary driver of this crisis, accounting for the majority of opioid-related deaths. It’s now mixed with a broader range of drugs, leading to unintentional overdoses. While some areas have seen reductions, the underlying supply and the danger of fentanyl-laced drugs remain severe.
Despite the slight decline in deaths, the reliance on punitive measures has largely failed.
Experts advocate for a shift towards harm reduction strategies, such as wider naloxone distribution, better access to addiction treatment, and overdose prevention centers.
Criminalization continues to contribute to higher risks, as fear of prosecution often prevents individuals from seeking help. [2]
12-Month Provisional Counts of Drug Overdose Deaths in the United States
Month and Year
Reported Value
Predicted Value
Percent Pending Investigation
Notes
July 2024
90,157
94,112
0.4%
* Underreported due to incomplete data.
June 2024
93,939
96,994
0.3%
* Underreported due to incomplete data.
May 2024
96,775
99,330
0.2%
* Underreported due to incomplete data.
April 2024
99,701
101,730
0.2%
* Underreported due to incomplete data.
March 2024
102,198
104,003
0.2%
* Underreported due to incomplete data.
February 2024
104,671
105,923
0.2%
* Underreported due to incomplete data.
January 2024
106,090
106,766
0.1%
* Underreported due to incomplete data.
December 2023
107,682
108,472
0.1%
* Underreported due to incomplete data.
November 2023
109,232
110,338
0.1%
* Underreported due to incomplete data.
October 2023
110,314
111,719
0.1%
* Underreported due to incomplete data.
The table highlights the steady decline in reported drug overdose deaths from October 2023 to July 2024. The reported 12-month total dropped from 110,314 in October 2023 to 90,157 in July 2024, a 19.3% decrease.[3]
This suggests progress in overdose prevention measures but underscores the challenges of accurate reporting due to underreported data. Predicted values consistently exceed reported values, indicating the potential for higher actual overdose deaths.
Percent Change in 12-Month Overdose Death Counts by Jurisdiction
Jurisdiction
Current 12-Month
Previous 12-Month
Percent Change
Notes
Alabama
1,302
1,603
-18.8%
* Underreported due to incomplete data.
Alaska
405
288
+40.6%
* Underreported due to incomplete data.
Arizona
2,497
2,800
-10.8%
* Underreported due to incomplete data.
Arkansas
425
544
-21.9%
* Underreported due to incomplete data.
California
10,457
12,578
-16.9%
* Underreported due to incomplete data.
Colorado
1,832
1,916
-4.4%
* Underreported due to incomplete data.
Connecticut
1,146
1,458
-21.4%
* Underreported due to incomplete data.
Delaware
393
554
-29.1%
* Underreported due to incomplete data.
District of Columbia
518
626
-17.3%
* Underreported due to incomplete data.
Florida
6,182
7,622
-18.9%
* Underreported due to incomplete data.
Georgia
2,075
2,617
-20.7%
* Underreported due to incomplete data.
Hawaii
293
317
-7.6%
* Underreported due to incomplete data.
Idaho
352
379
-7.1%
* Underreported due to incomplete data.
Illinois
2,953
3,789
-22.1%
* Underreported due to incomplete data.
Indiana
1,929
2,404
-19.8%
* Underreported due to incomplete data.
Iowa
429
469
-8.5%
* Underreported due to incomplete data.
Kansas
564
721
-21.8%
* Underreported due to incomplete data.
Kentucky
1,795
2,277
-21.2%
* Underreported due to incomplete data.
Louisiana
1,876
2,310
-18.8%
* Underreported due to incomplete data.
Maine
537
672
-20.1%
* Underreported due to incomplete data.
Maryland
2,121
2,539
-16.5%
* Underreported due to incomplete data.
Massachusetts
1,983
2,558
-22.5%
* Underreported due to incomplete data.
Michigan
2,278
3,050
-25.3%
* Underreported due to incomplete data.
Minnesota
1,155
1,413
-18.3%
* Underreported due to incomplete data.
Mississippi
557
649
-14.2%
* Underreported due to incomplete data.
Missouri
1,759
2,151
-18.2%
* Underreported due to incomplete data.
Montana
182
183
-0.5%
* Underreported due to incomplete data.
Nebraska
147
194
-24.2%
* Underreported due to incomplete data.
Nevada
1,484
1,307
+13.5%
* Underreported due to incomplete data.
New Hampshire
356
462
-22.9%
* Underreported due to incomplete data.
New Jersey
2,119
2,906
-27.1%
* Underreported due to incomplete data.
New Mexico
826
1,008
-18.1%
* Underreported due to incomplete data.
New York
2,768
3,489
-20.7%
* Underreported due to incomplete data.
New York City
2,592
3,259
-20.5%
* Underreported due to incomplete data.
North Carolina
2,269
4,479
-49.3%
* Underreported due to incomplete data.
North Dakota
127
143
-11.2%
* Underreported due to incomplete data.
Ohio
3,755
5,197
-27.7%
* Underreported due to incomplete data.
Oklahoma
924
1,269
-27.2%
* Underreported due to incomplete data.
Oregon
1,694
1,700
-0.4%
* Underreported due to incomplete data.
Pennsylvania
3,800
5,166
-26.4%
* Underreported due to incomplete data.
Rhode Island
365
448
-18.5%
* Underreported due to incomplete data.
South Carolina
1,745
2,314
-24.6%
* Underreported due to incomplete data.
South Dakota
85
88
-3.4%
* Underreported due to incomplete data.
Tennessee
3,100
3,861
-19.7%
* Underreported due to incomplete data.
Texas
5,354
5,683
-5.8%
* Underreported due to incomplete data.
Utah
744
683
+8.9%
* Underreported due to incomplete data.
Vermont
236
256
-7.8%
* Underreported due to incomplete data.
Virginia
1,782
2,614
-31.8%
* Underreported due to incomplete data.
Washington
3,358
3,387
-0.9%
* Underreported due to incomplete data.
West Virginia
1,067
1,373
-22.3%
* Underreported due to incomplete data.
Wisconsin
1,340
1,760
-23.9%
* Underreported due to incomplete data.
Wyoming
125
130
-3.8%
* Underreported due to incomplete data.
North Carolina experienced a remarkable decline (-49.3%), which could reflect significant intervention efforts or reporting anomalies.
States like Delaware (-29.1%), Ohio (-27.7%), and Pennsylvania (-26.4%) highlight strong reductions due to effective harm reduction programs and policy implementations.
View this post on Instagram
Alaska (+40.6%) and Nevada (+13.5%) stand out as jurisdictions with sharp increases, potentially due to fentanyl prevalence or barriers to healthcare access.
States like Oregon (-0.4%), Washington (-0.9%), and Montana (-0.5%) reflect minimal change, signaling the need for renewed efforts to drive significant reductions.
Methodology
We analyzed provisional and predicted overdose death counts, identified trends, and highlighted regional disparities while accounting for factors like underreporting and COVID-19 disruptions.
Historical data from 2020 to 2024 were compared to pinpoint shifts in patterns, with findings verified across multiple sources. The content is organized for clarity, using tables and concise summaries to present a comprehensive overview of the U.S. overdose crisis.
Sources
- U.S. Department of Health & Human Services: U.S. Overdose Deaths Decrease in 2023, First Time Since 2018
- American Medical Association: Issue brief: National Snapshot of Overdose Epidemic
- Ahmad FB, Cisewski JA, Rossen LM, Sutton P. Provisional drug overdose death counts.