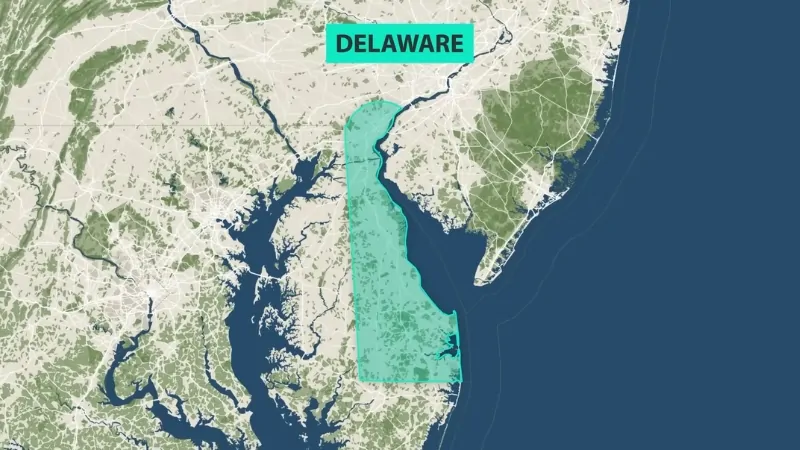
Delaware has 1,059,952 residents in the latest official estimate available in 2026. The Census Bureau counted 9,829 more residents than a year earlier, a 0.94% increase that placed Delaware sixth among the states for percentage growth from July 2024 to July 2025.
The Vintage 2025 state estimates remain the latest completed population series because a July 2026 state estimate has not yet been released.
Migration is doing the work. Deaths exceeded births after 2020, yet people moving into Delaware more than replaced that natural loss. Growth is also shifting south. Sussex County generated 56.8% of Delaware’s post-2020 population increase, according to the 2025 county estimates release.
Delaware Added 162,018 Residents Since the 2010 Census
Delaware counted 897,934 residents in 2010 and 989,948 in the 2020 Census. Against the current 1,059,952 estimate, the state has gained 162,018 residents since 2010. The arithmetic is 1,059,952 minus 897,934, a gain equal to 18.0% of the 2010 population. All three figures appear in the Census profile for Delaware.
The recent Census estimates use a slightly different starting point. Vintage 2025 sets the April 2020 estimates base at 989,950, two residents above the final 2020 Census count. From that base, Delaware added 70,002 residents through July 2025, or 7.1%. Comparing the current estimate directly with the 989,948 Census count produces 70,004. The two totals answer slightly different questions rather than contradicting each other.
Table of Contents
ToggleDelaware is still the sixth least populated state. Its size hides how fast it has been growing.
Migration Added 72,899 Residents While Births Fell Behind Deaths
“Delaware Is Growning” was published by Delaware Governor Matt Meyer on April 16, 2026. The population statistics below come from Census Bureau data rather than the video.
From April 2020 through July 2025, Delaware recorded 55,054 births and 58,204 deaths. Natural change was therefore negative by 3,150 residents. Net migration added 72,899 people, including 53,212 through domestic migration and 19,687 through international migration, according to the Vintage 2025 components of change.
Domestic migration supplied 53,212 of those 72,899 net arrivals, or 73.0%. Migration minus the natural loss accounts for 69,749 residents. The small remaining difference between that figure and the official population change falls under the Census residual used when change cannot be assigned precisely to births, deaths or migration.
The migration series ends in July 2025. Labor figures later in this article cover a different period ending in August 2026, so a later decline in the labor force cannot be treated as a direct consequence of the earlier migration numbers.
Sussex Supplied 56.8% of Delaware’s Post-2020 Growth
The embedded Facebook reel shows development in Sussex County. Census estimates, rather than the social post, are used for the population figures below.
| County | Vintage 2025 Base in 2020 | 2025 Population | Residents Added | Growth |
|---|---|---|---|---|
| New Castle | 570,722 | 588,026 | 17,304 | 3.0% |
| Sussex | 237,379 | 277,140 | 39,761 | 16.8% |
| Kent | 181,849 | 194,786 | 12,937 | 7.1% |
The three county gains sum to Delaware’s 70,002-resident increase from the Vintage 2025 estimates base. Sussex contributed 39,761 residents, or 56.8% of the gain. New Castle contributed 24.7% and Kent 18.5%.
The balance inside Delaware has shifted with it. Sussex represented about 24.0% of the state’s estimates-base population in 2020 and now accounts for about 26.1%. New Castle moved from roughly 57.7% to 55.5%. Delaware remains concentrated in the north, but a larger share of residents now lives in Sussex.
Sussex Has About 65 Seniors for Every 100 Adults Ages 18 to 64
Age makes the shift more consequential. In Sussex County, 32.8% of residents are 65 or older and 17.0% are under 18. Subtracting those groups from 100 leaves about 50.2% between ages 18 and 64. That works out to roughly 65 residents age 65 or older for every 100 residents ages 18 to 64.
New Castle County looks very different. Its senior share is 18.8% and its under-18 share is 20.3%, leaving about 60.9% ages 18 to 64. The equivalent ratio is roughly 31 seniors for every 100 people in that broad working-age band.
Those figures are not formal labor-force dependency ratios because many people ages 18 to 64 are not workers. They still show why the same amount of population growth creates different demands. Sussex needs school capacity for younger households and more health, transport and home-care capacity for a much larger senior population.
Sussex Is Above the State’s Current Planning Projection
The Delaware Population Consortium projected 270,780 Sussex County residents for 2025. The current Census estimate of 277,140 sits 6,360 higher, a difference of 2.35%.
County population estimates do not carry an ACS-style sampling margin of error. They are model-based estimates that can be revised when a new vintage incorporates newer administrative records and improved methods. The Census Bureau explains that revision process in its population estimates methodology.
The comparison still matters for planning. Sussex is currently running ahead of the population figure used in Delaware’s adopted projection series.
Milford Grew 31.9% While Newark Lost Population
The southward shift also appears below the county level. Census city and town estimates show slower growth in Delaware’s largest established cities and much faster gains in several smaller communities.
| Place | 2025 Population | Change From 2020 Estimates Base |
|---|---|---|
| Wilmington | 73,512 | +3.7% |
| Dover | 40,592 | +2.8% |
| Newark | 30,359 | -0.9% |
| Middletown | 25,798 | +11.2% |
| Milford | 14,723 | +31.9% |
Milford rose from a 2020 estimates base of 11,166 to 14,723 residents, adding 3,557 people. Its 31.9% increase was nearly nine times Wilmington’s percentage growth.
Wilmington added 2,596 residents and reached 73,512, but growth was only 3.7%. Delaware is therefore gaining population faster in several smaller central and southern communities than in its largest city.
Delaware Has More Seniors Than Children
The 2024 American Community Survey puts Delaware’s median age at 42.1 years. Census age data also show 22.8% of residents at age 65 or older and 19.8% under age 18. The remaining 57.4% falls between ages 18 and 64. The ACS demographic profile provides the statewide age structure and sampling information.
Nationally, 18.0% of residents are 65 or older and 21.5% are younger than 18. Delaware’s senior share is therefore 4.8 percentage points above the US figure.
The embedded video discusses population aging in the United States. Delaware’s figures above come from Census data.
Delaware’s Black Population Share Is Well Above the National Rate
The latest state demographic estimates put Delaware at 65.0% White alone, 24.0% Black alone, 5.0% Asian alone and 4.8% identifying with two or more races. Hispanic or Latino residents account for 11.9%. Hispanic origin can overlap with any race category.
The US Black population share is 13.7%, compared with Delaware’s 24.0%. The national Hispanic share is 20.0%, considerably higher than Delaware’s 11.9%. Delaware also has a smaller foreign-born share at 10.7% compared with 14.1% nationally, and 15.1% of Delaware residents age five and older speak another language at home compared with 22.3% nationally.
Median Household Income Is $87,534 and 36% Hold a Bachelor’s Degree
The 2024 ACS profile for Delaware reports median household income of $87,534 and a bachelor’s degree or higher for 36.0% of adults age 25 and older. Those measures provide more useful context than combining every form of post-secondary study into one education percentage.
The Labor Force Shrunk by 11,108 People in One Year
Delaware’s population has been rising, but its labor force moved the other way in the latest twelve-month period. The Bureau of Labor Statistics recorded 516,415 people in the civilian labor force in August 2025 and 505,307 in August 2026. The decline was 11,108.
The participation rate provides a second signal. Delaware fell from 59.8% in August 2025 to 57.9% in August 2026, a drop of 1.9 percentage points in the seasonally adjusted participation series.
Aging is one plausible contributor because retirees remain residents after leaving the labor force. The data do not prove retirement caused the entire decline. Changes in the age mix of people moving into and out of Delaware can also move participation. Cross-state commuting is not enough to explain it because BLS labor-force statistics assign workers by residence.
More Listings Have Not Pushed Statewide Home Prices Lower
Delaware had 5,591 homes for sale in August 2026, 8.8% more than a year earlier. The median sale price still rose 3.2% to $401,488, according to Redfin’s statewide market data. Homes took 57 days to sell, nine days longer than a year earlier.
Sussex tells a more complicated story. Despite its rapid population growth, the county’s median home price fell 1.9% year over year to $438,522 and properties took 81 days to sell, based on August 2026 county data. Population pressure alone does not determine short-term prices. Inventory, mortgage costs and the mix of homes reaching the market also matter.
Last Words
Delaware is gaining residents without gaining workers at the same pace. The statewide labor force fell by more than 11,000 in the latest year, and participation dropped below 58%. For the next few years, the main demographic pressure is not Wilmington.
It is a faster-growing, older Sussex County that is taking a larger share of the state’s residents and forcing infrastructure, housing and labor planning to catch up.
Related Posts:
- Denver Population 2026 - Key Demographic Trends and Insights
- Baltimore Population 2025 - Key Demographic Trends…
- Connecticut Population in 2025 - Key Demographic…
- Maui Population 2025 - Current Trends and…
- New Hampshire Population in 2025 - Latest…
- Virginia Beach Population 2025 - Key Trends and Insights