Based on data from World Population Review and the U.S. Census Bureau, cities like Celina, Texas, and Fulshear, Texas, have led the charge, boasting annual growth rates of 19.63% and 19.6%, respectively.
These cities have nearly tripled their populations since the 2020 census, with Celina’s population increasing by a staggering 190.99% and Fulshear’s by 190.28%.
Texas dominates the list with cities such as Georgetown, which now has a population of 105,499, reflecting a growth rate of 9.54%, and Forney, which grew by 64.71% since 2020.
Outside of Texas, cities like Amherst Town, Massachusetts, and Fort Mill, South Carolina, showcase notable growth trends driven by their unique demographic dynamics.
The list includes cities primarily in Texas, along with others in Massachusetts, South Carolina, Utah, and Florida.
As of 2025, the live population of the United States is approximately 346,163,34c3
Table of Contents
ToggleFast-Growing U.S. Cities by Population Growth Rate in 2025 (Smaller Cities and Towns)
Rank
City/Town
State
Current Population
Population (2010)
Growth Rate (%)
Area (sq. miles)
Population Density (per sq. mile)
Type
1
Celina
Texas
51,820
17,808
19.63%
47.7
1,086
City
2
Fulshear
Texas
50,968
17,558
19.6%
12.9
3,960
City
3
Royse City
Texas
27,611
13,719
14.39%
19.2
1,438
City
4
Melissa
Texas
26,649
14,336
13.06%
11.5
2,327
City
5
Princeton
Texas
31,523
17,537
12.47%
10.1
3,122
City
6
Anna
Texas
30,878
17,370
12.28%
17.8
1,732
City
7
Forney
Texas
39,333
23,880
10.89%
15.8
2,489
City
8
Amherst Town
Massachusetts
44,437
27,796
10.33%
27.6
1,609
City
9
Manor
Texas
22,241
14,112
10.05%
9.8
2,268
City
10
Georgetown
Texas
105,499
68,749
9.54%
58.1
1,814
City
11
West Haven
Utah
26,288
17,192
9.47%
10.8
2,438
City
12
Hutto
Texas
42,326
28,081
9.19%
13.9
3,037
City
13
Saratoga Springs
Utah
57,278
38,294
9.03%
23.3
2,454
City
14
Lathrop
California
43,444
29,096
9%
19.8
2,191
City
15
Prosper
Texas
45,274
30,816
8.67%
25.2
1,797
Town
16
Kyle
Texas
67,911
46,458
8.57%
32.5
2,093
City
17
Fate
Texas
26,697
18,412
8.41%
11.8
2,253
City
18
Fort Mill
South Carolina
36,438
25,188
8.36%
19.7
1,849
Town
19
Haines City
Florida
40,379
27,949
8.34%
23.6
1,711
City
20
Leander
Texas
86,469
60,860
8%
38.7
2,235
City
1. Celina, Texas
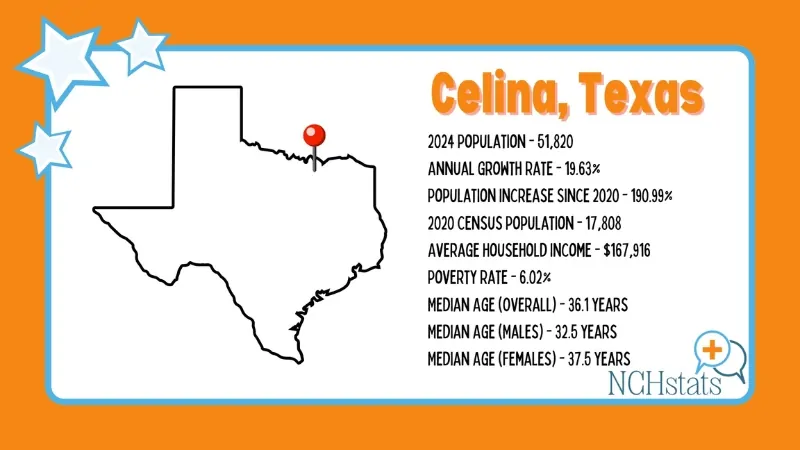
Celina, located in Collin County, Texas, is experiencing remarkable growth. Its 2025 population is 51,820, reflecting an annual growth rate of 19.63%.
This marks a staggering 190.99% increase since the 2020 census, which recorded a population of 17,808.
The city boasts an average household income of $167,916, with a poverty rate of 6.02%. The median age is 36.1 years, with males averaging 32.5 years and females 37.5 years.
Celina, #Texas is correct! San Antonio added more people than any other city in 2023, and Celina, TX was the fastest growing. Discover more #CensusData on the population: https://t.co/luJNQyJEKy#WeTheData #FunFactFriday
— U.S. Census Bureau (@uscensusbureau) July 22, 2024
In terms of racial composition, Celina is predominantly White (68.2%), followed by individuals of two or more races (14.46%), Asian (7.96%), and Black or African American (6.41%).
Smaller percentages include Other races (2.11%), Native American (0.57%), and Native Hawaiian or Pacific Islander (0.28%).
With its rapid expansion and high standard of living, Celina is emerging as one of Texas’s most dynamic cities.
2. Fulshear, Texas
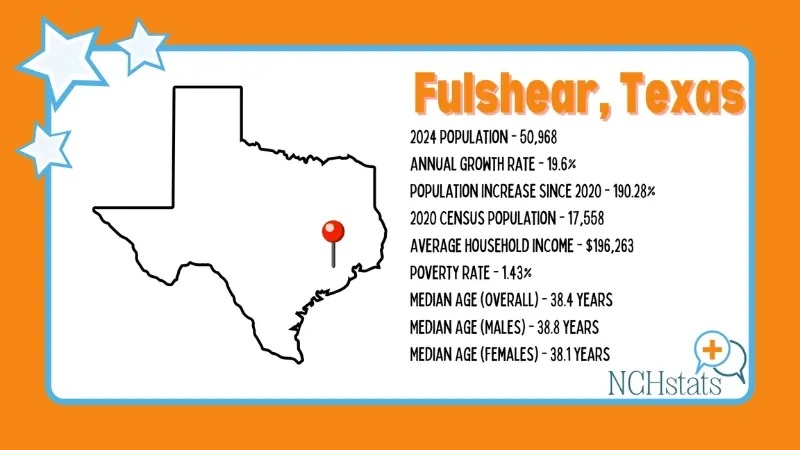
Fulshear, situated in Fort Bend County, Texas, has witnessed impressive growth over recent years. Its 2025 population is estimated at 50,968, reflecting an annual growth rate of 19.6%. Since the 2020 census, which recorded 17,558 residents, Fulshear’s population has increased by 190.28%.
The city boasts an average household income of $196,263, with a very low poverty rate of 1.43%. The median age in Fulshear is 38.4 years, with males averaging 38.8 years and females 38.1 years.
In terms of racial composition, Fulshear’s population is predominantly White (58.83%), followed by Asian (16.67%), individuals of two or more races (14.91%), and Other races (5.03%). Smaller percentages include Black or African American (3.41%), Native American (0.64%), and Native Hawaiian or Pacific Islander (0.5%).
3. Royse City, Texas
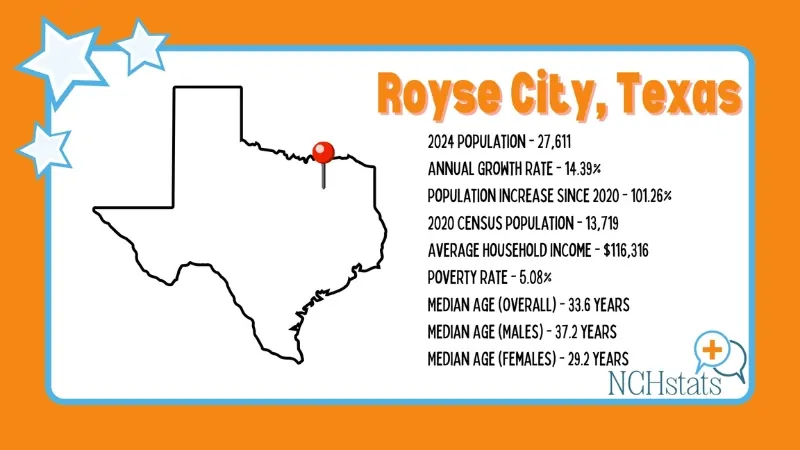
Royse City, located in Rockwall County, Texas, is experiencing significant growth. Its 2025 population stands at 27,611, reflecting an annual growth rate of 14.39%. Since the 2020 census, which recorded 13,719 residents, the population has increased by 101.26%.
The city has an average household income of $116,316, with a poverty rate of 5.08%. The median age is 33.6 years, with males averaging 37.2 years and females 29.2 years.
The racial composition of Royse City is predominantly White (71.18%), followed by Black or African American (10.99%), Other races (9.16%), individuals of two or more races (7.58%), and Asian (1.09%). The city has no recorded Native American or Hawaiian/Pacific Islander population.
4. Melissa, Texas
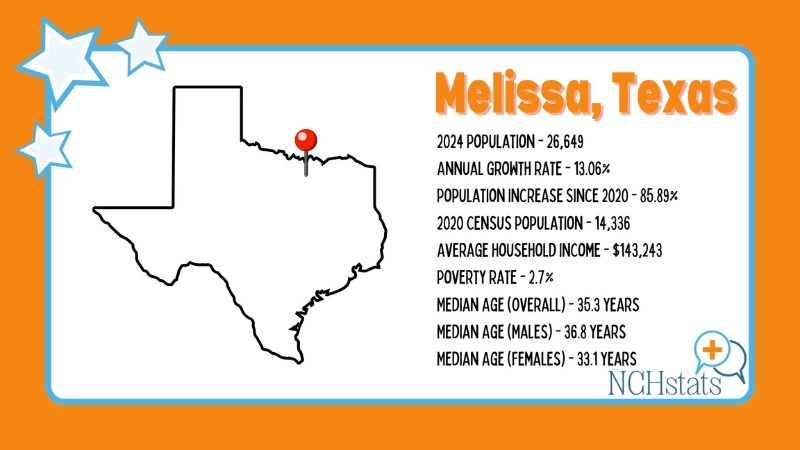
Melissa, located in Collin County, Texas, continues to experience rapid growth. Its population in 2025 stands at 26,649, with an annual growth rate of 13.06%. This marks an 85.89% increase since the 2020 census, which recorded a population of 14,336.
The city has a robust average household income of $143,243 and a low poverty rate of 2.7%. Melissa’s median age is 35.3 years, with males averaging 36.8 years and females 33.1 years.
The city’s racial composition is predominantly White (69.04%), followed by Black or African American (13.68%), individuals of two or more races (10.44%), Asian (5.62%), Other races (1.14%), and Native American (0.09%). There is no recorded population of Native Hawaiians or Pacific Islanders.
5. Princeton, Texas
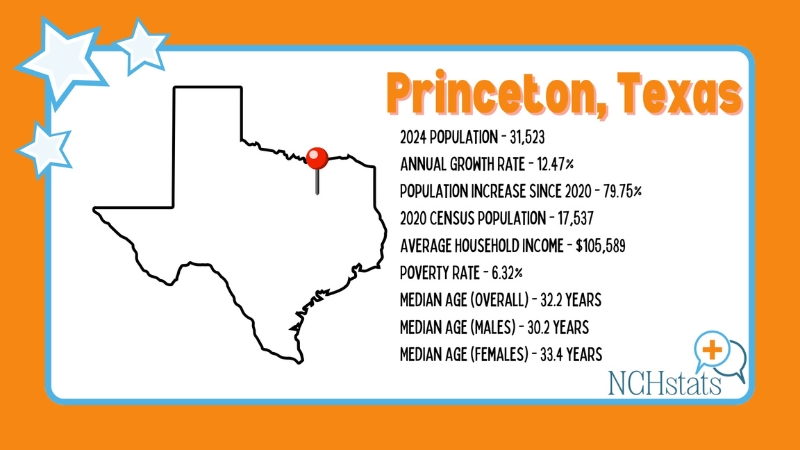
Princeton, a city in Collin County, Texas, is experiencing significant growth. Its 2025 population is estimated at 31,523, with an annual growth rate of 12.47%. Since the 2020 census, which recorded 17,537 residents, Princeton’s population has grown by 79.75%.
The city’s average household income is $105,589, with a poverty rate of 6.32%. The median age in Princeton is 32.2 years, with males averaging 30.2 years and females 33.4 years.
The racial composition of Princeton is predominantly White (59.58%), followed by Black or African American (19.64%), individuals of two or more races (10.2%), Other races (5.53%), Asian (4.23%), and Native American (0.81%). There is no recorded population of Native Hawaiians or Pacific Islanders.
6. Anna, Texas
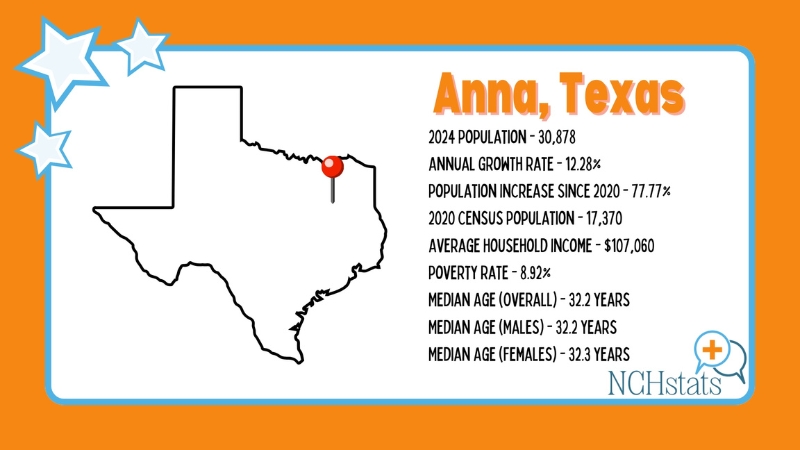
Anna, located in Collin County, Texas, is a rapidly growing city with a 2025 population of 30,878. The city is currently expanding at an annual growth rate of 12.28%, representing a 77.77% increase since the 2020 census, which recorded 17,370 residents.
Anna has an average household income of $107,060, with a poverty rate of 8.92%. The median age in the city is 32.2 years, with males and females having nearly identical median ages of 32.2 and 32.3 years, respectively.
The city’s racial composition is predominantly White (74.1%), followed by Black or African American (16.55%), individuals of two or more races (4.81%), Other races (2.2%), Asian (1.52%), and Native American (0.82%). There is no recorded population of Native Hawaiian or Pacific Islander.
7. Forney, Texas
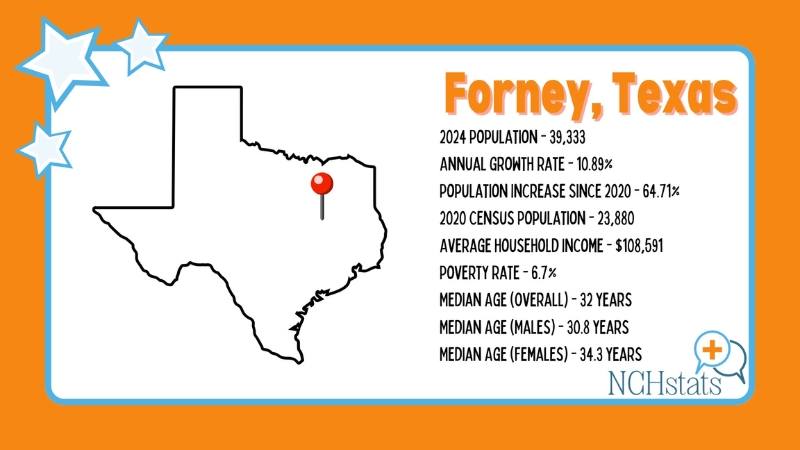
Forney, located in Kaufman County, Texas, continues to experience significant growth. The city’s 2025 population is estimated at 39,333, growing at an annual rate of 10.89%. This reflects a 64.71% increase since the 2020 census, which recorded 23,880 residents.
Forney’s average household income is $108,591, with a poverty rate of 6.7%. The median age in Forney is 32 years, with males averaging 30.8 years and females 34.3 years.
The city’s racial composition is predominantly White (70.63%), followed by Black or African American (16.06%), individuals of two or more races (7.28%), Asian (3.38%), Other races (2.51%), Native Hawaiian or Pacific Islander (0.1%), and Native American (0.04%).
8. Amherst Town, Massachusetts
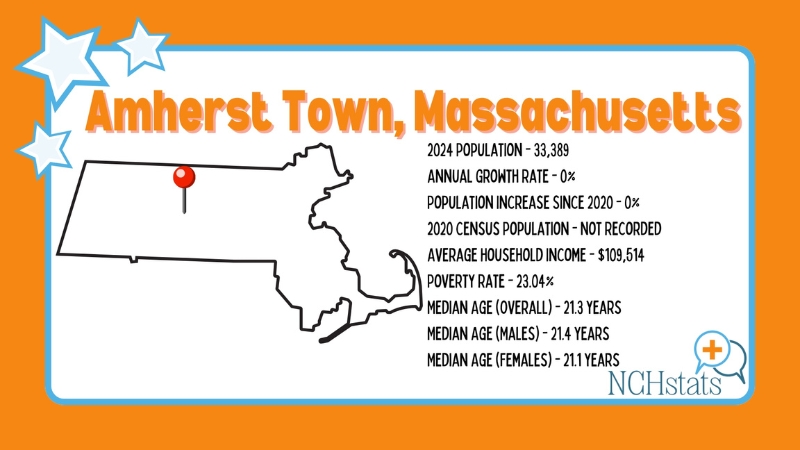
Amherst Town, located in Hampshire County, Massachusetts, has a 2025 population of 33,389. The city’s population has remained stable with a 0% annual growth rate and no recorded population increase or decrease since the most recent census.
The average household income in Amherst Town is $109,514, although it has a higher poverty rate of 23.04%. The median age is notably young at 21.3 years, with males averaging 21.4 years and females slightly younger at 21.1 years, reflecting the presence of a large student population in the area.
The city’s racial composition is predominantly White (69.48%), followed by Asian (13.45%), individuals of two or more races (10.57%), Black or African American (4.54%), Other races (1.54%), Native Hawaiian or Pacific Islander (0.36%), and Native American (0.06%).
9. Manor, Texas
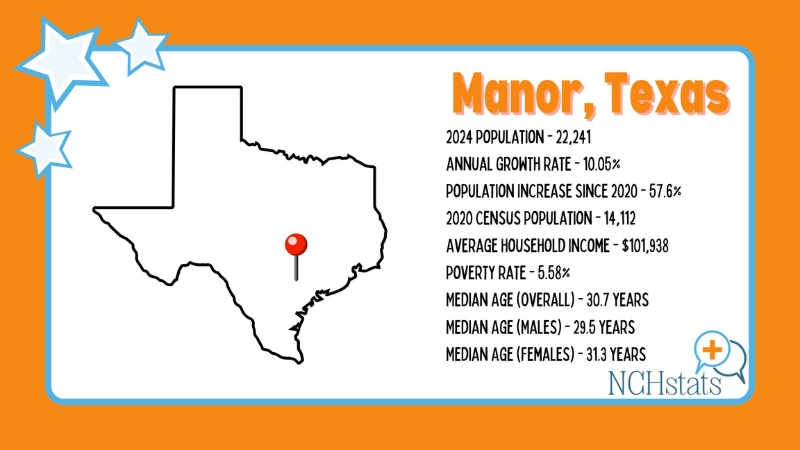
Manor, located in Travis County, Texas, is a rapidly growing city with a 2025 population of 22,241. The city is expanding at an annual growth rate of 10.05%, representing a 57.6% increase since the 2020 census, which recorded 14,112 residents.
The average household income in Manor is $101,938, with a poverty rate of 5.58%. The median age is relatively young at 30.7 years, with males averaging 29.5 years and females slightly older at 31.3 years.
Manor’s racial composition is highly diverse, with the population predominantly White (40.02%), followed by Black or African American (21.41%), Other races (19.79%), individuals of two or more races (15.04%), Asian (3.32%), Native American (0.27%), and Native Hawaiian or Pacific Islander (0.15%).
10. Georgetown, Texas
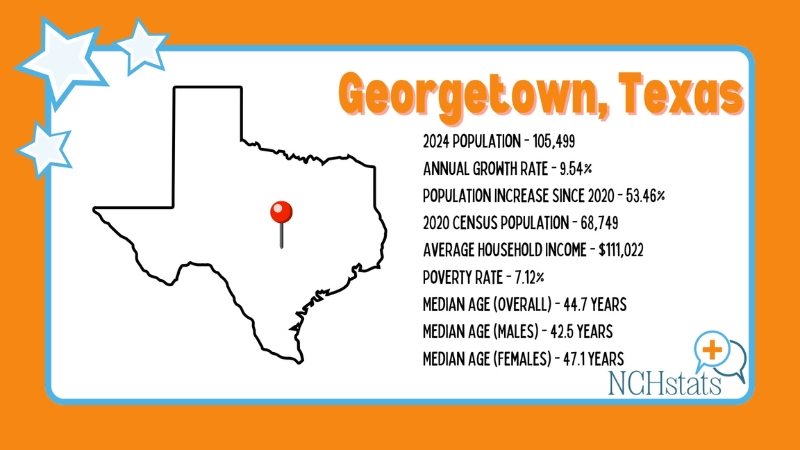
Georgetown, located in Williamson County, Texas, serves as the county seat and continues to experience significant growth. Its 2025 population is estimated at 105,499, reflecting an annual growth rate of 9.54%. Since the 2020 census, which recorded 68,749 residents, Georgetown’s population has increased by 53.46%.
The city has an average household income of $111,022, with a poverty rate of 7.12%. Georgetown’s median age is 44.7 years, with males averaging 42.5 years and females slightly older at 47.1 years.
Georgetown’s racial composition is predominantly White (77.5%), followed by individuals of two or more races (10.54%), Black or African American (5.23%), Other races (4.1%), Asian (2.03%), Native American (0.46%), and Native Hawaiian or Pacific Islander (0.13%).
Methodology
- Data was sourced from World Population Review, focusing on U.S. cities with rapid population growth in 2025.
- Only cities and towns with clear growth rates and demographic statistics were included.
- Population changes since the most recent census were calculated alongside annual growth rates.
- Key metrics like household income, poverty rates, and median age were analyzed for relevance.
- Racial composition was derived from the most recent American Community Survey (ACS) data.
- The final list prioritizes cities showing significant growth trends and unique demographic shifts.
Related Posts:
- Fewer Babies, Older Populations - How the U.S. and…
- 6 States With the Largest Illegal Immigrant…
- Map of Texas - Cities, Geography, Counties & Stats (2025)
- Map of Pennsylvania - Cities, Geography, Counties &…
- Map of California - Cities, Geography, Counties &…
- Map of Colorado - Cities, Geography, Counties & Stats (2025)


