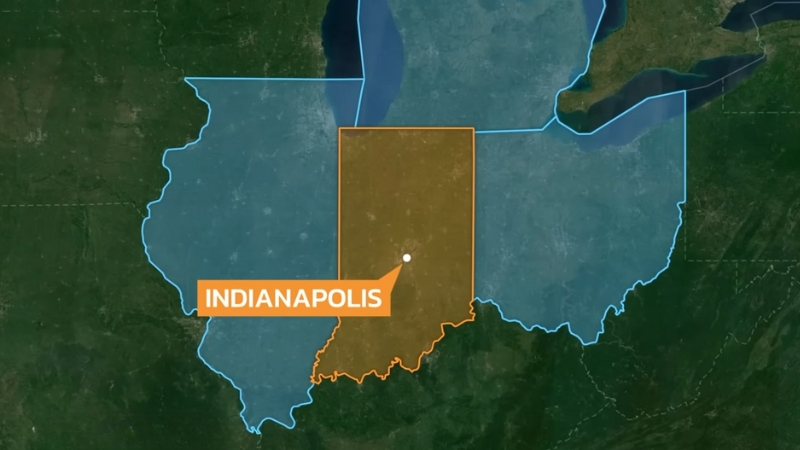
Indiana’s estimated population for 2025 is 6,892,120, reflecting steady growth over recent years according to World Population Review.
Historically, the population has seen consistent increases, with the most recent detailed census reporting 6,483,802 residents in 2010—an increase of 6.6% since 2000.
By 2015, estimates placed the population at 6,619,680, and in 2016, Indiana experienced a modest growth rate of 0.33%, ranking 29th among U.S. states.
Indiana covers a total land area of 36,418 square miles (94,321 square kilometers), making it the 38th largest state by land area. However, it ranks 16th in population density, with 181 people per square mile.
Indianapolis, the state capital, is Indiana’s largest city, with over 860,000 residents. Marion County, where Indianapolis is located, is the most populous county in the state, home to more than 900,000 residents.
Indiana is bordered by Michigan to the north, Ohio to the east, Kentucky to the south, and Illinois to the west.
Table of Contents
ToggleKey Takeaways
Age Structure
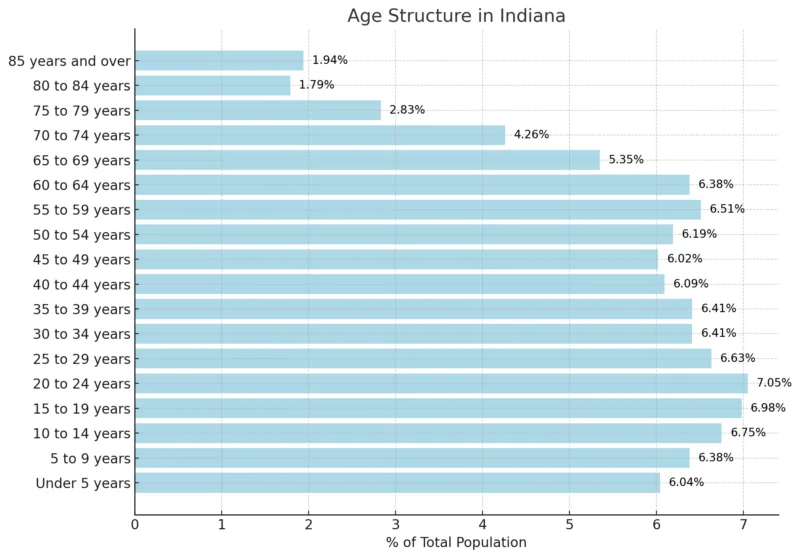
The median age in Indiana is 38.0, according to the 2018-2022 ACS 5-Year Estimates. Among the total population, 19.17% are under 15 years old, 20.66% are between 15 and 29 years old, 44.01% fall within the 30 to 64 age range, 14.23% are aged 65 to 84, and 1.94% are 85 years or older.
Median Age
The median age in Indiana is 38 years, with males having a median age of 36.8 years and females slightly older at 39.1 years.
The state has a total of 5,206,940 adults, including 1,097,200 seniors.
Indiana’s Age Dependency Ratio is 65.1, indicating the number of dependents (both young and old) relative to the working-age population.
This includes an Old Age Dependency Ratio of 26.7 (seniors) and a Child Dependency Ratio of 38.4 (children under 18).
Indiana Population by Gender
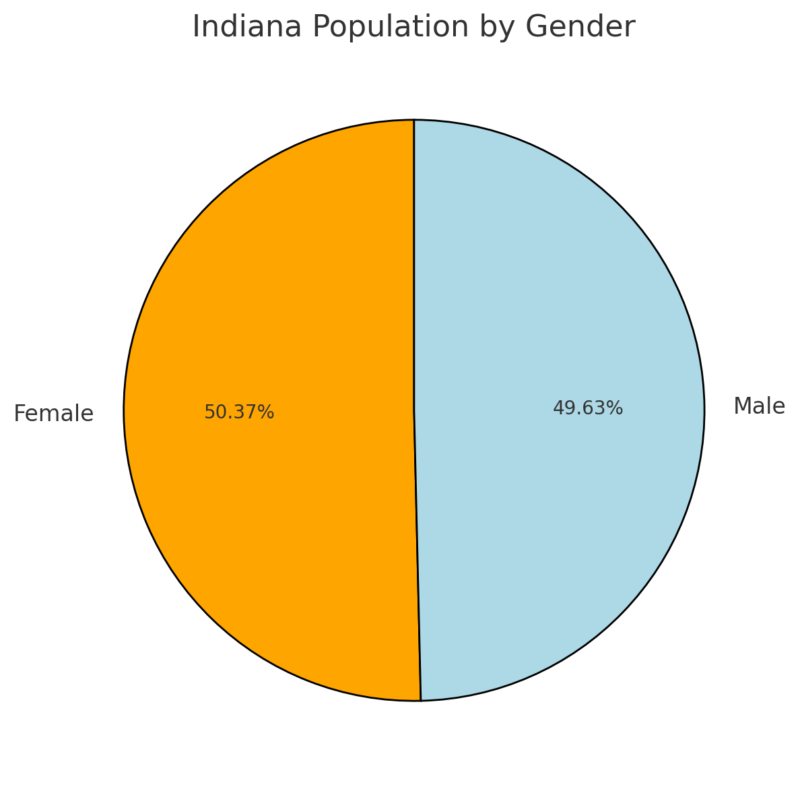
Indiana’s population is relatively evenly split between genders, with 50.37% females and 49.63% males according to the Neilsberg. This results in a slight majority of 50,807 more females than males in the state.
The near parity in gender distribution reflects a balanced demographic structure, which can influence areas such as healthcare, education, and workforce planning.
Population by Race (Percentages Only)
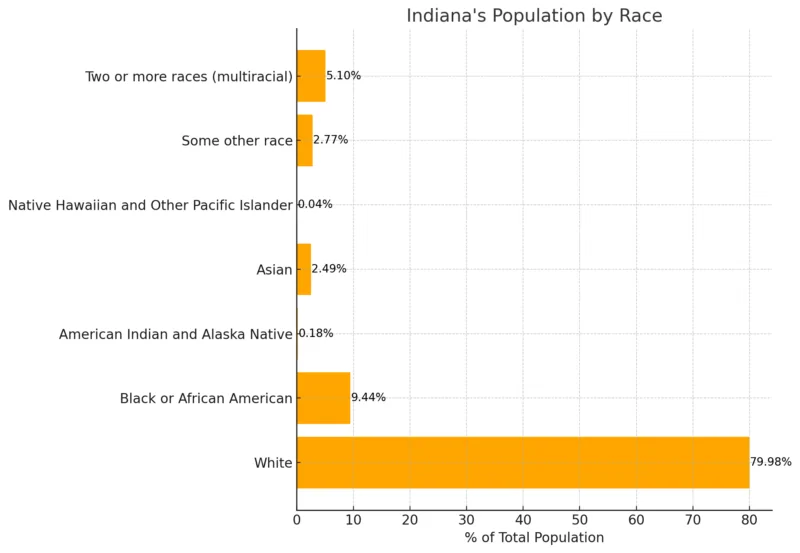
As per Neilsberg notes the majority of Indiana’s population identifies as White (79.98%), followed by Black or African American (9.44%). Other racial groups, such as Asian (2.49%), Multiracial (5.10%), and Some other race (2.77%), make up smaller portions of the population.
The percentages for American Indians and Alaska Natives (0.18%) and Native Hawaiians and Other Pacific Islanders (0.04%) are notably small, reflecting minimal representation in the state.
This demographic distribution underscores Indiana’s primarily White population while highlighting growing diversity among other racial groups.
Indiana Counties and Population 2025
Have you heard of the “Who’s Here” legend? According to the Indiana Historical Bureau, this folk tale suggests that Indiana’s nickname, “The Hoosier State,” originated from early settlers frequently calling out “Who’s here?” when they heard a knock at their cabin doors. Over time, this phrase is said to have evolved into the word “Hoosier.
County
Population
County
Population
Marion County
967,697
Lake County
501,539
Allen County
397,446
Hamilton County
377,827
St. Joseph County
273,414
Elkhart County
205,945
Hendricks County
189,655
Tippecanoe County
189,347
Vanderburgh County
180,057
Porter County
175,822
Johnson County
169,952
Monroe County
139,063
Madison County
133,625
Clark County
126,712
Delaware County
112,479
LaPorte County
111,590
Vigo County
106,224
Hancock County
89,215
Bartholomew County
84,612
Howard County
84,116
Floyd County
80,997
Kosciusko County
80,164
Boone County
77,931
Morgan County
74,194
Warrick County
66,503
Grant County
66,407
Wayne County
66,038
Dearborn County
51,530
Henry County
49,043
Noble County
47,626
Jackson County
46,690
Marshall County
46,326
Shelby County
45,273
Lawrence County
44,937
DeKalb County
44,583
Dubois County
43,600
LaGrange County
40,960
Harrison County
40,222
Montgomery County
38,827
Putnam County
37,840
Cass County
37,795
Huntington County
36,762
Adams County
36,425
Knox County
36,264
Miami County
35,258
Steuben County
35,062
Whitley County
34,907
Daviess County
33,816
Jasper County
33,725
Jefferson County
33,176
Gibson County
32,806
Clinton County
32,691
Greene County
31,321
Wabash County
30,498
Ripley County
29,424
Wells County
28,812
Washington County
28,239
Jennings County
27,760
Clay County
26,510
Decatur County
26,344
White County
25,174
Posey County
24,982
Scott County
24,814
Randolph County
24,082
Fayette County
23,335
Starke County
23,209
Franklin County
23,109
Owen County
21,577
Sullivan County
20,843
Carroll County
20,536
Fulton County
20,348
Spencer County
19,971
Jay County
19,946
Orange County
19,675
Perry County
19,211
Rush County
17,022
Fountain County
16,842
Parke County
16,601
Brown County
15,719
Vermillion County
15,401
Tipton County
15,187
Newton County
14,081
Pulaski County
12,321
Pike County
12,069
Blackford County
11,867
Crawford County
10,359
Switzerland County
10,029
Martin County
9,967
Benton County
8,786
Warren County
8,548
Union County
6,979
Ohio County
5,911
WPR notes that Indiana has 92 counties, with Marion County being the most populous, home to Indianapolis, and a population of 954,670 as of 2019—a 5.35% increase since the 2010 census.
Following Marion County are Lake County (484,411), Allen County (375,351), and Hamilton County (330,086). Of these, only Lake County saw a population decline, dropping 2.32%, while Hamilton County experienced the most significant growth, increasing by 19.38%.
At the other end of the spectrum, Ohio County is Indiana’s least populous county, with 5,844 residents, reflecting a 4.12% decrease since 2010. Other sparsely populated counties include Union County (7,047), Warren County (8,263), and Benton County (8,653), all of which also saw declining populations.
Hamilton County led population growth in the state, increasing by 19.38%, followed by Boone County (17.72%) and Hendricks County (14.46%). Conversely, counties with the most significant population declines were Union County (-6.63%), Blackford County (-6.59%), and Pulaski County (-6.43%).
Education Levels
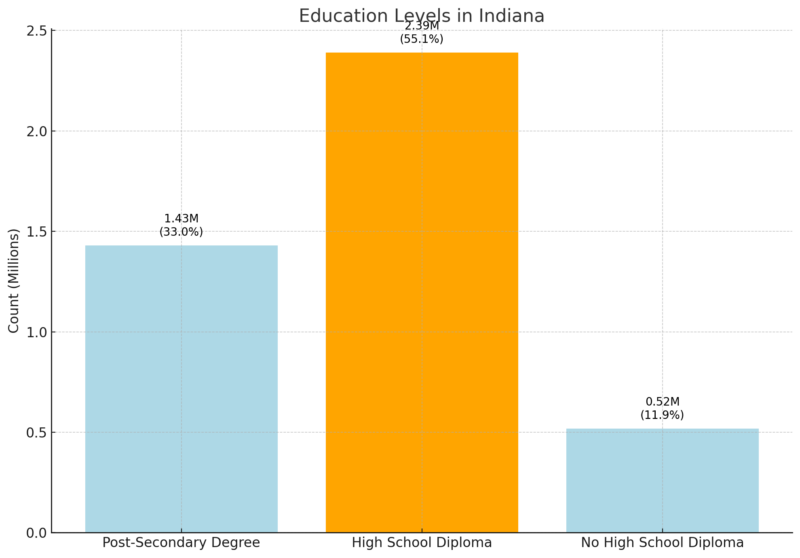
Over 55.1% of Indiana’s population aged 25 and older have a high school diploma as their highest level of education.
33.0% have earned post-secondary degrees, indicating a significant portion pursuing education beyond high school according to Statistical Atlas.
A smaller group, 11.9%, lack a high school diploma, which may impact workforce qualifications.
Relative Educational Attainment: Indiana vs. United States
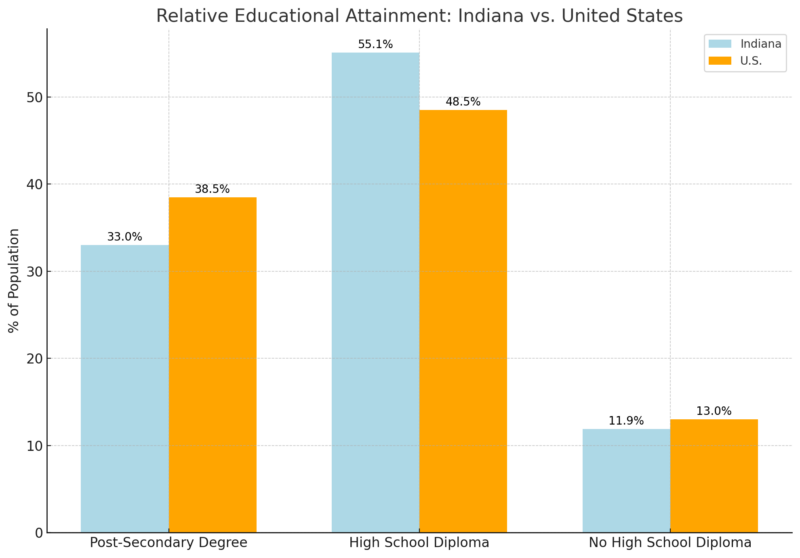
Indiana has 14.3% fewer residents with post-secondary degrees compared to the national average, indicating room for improvement in higher education attainment.
The state has a significantly higher percentage (+13.6%) of individuals whose highest level of education is a high school diploma, reflecting a strong emphasis on completing secondary education.
The percentage of those without a high school diploma is lower than the national average, showing progress in basic education levels.
Detailed Educational Attainment (Indiana vs. United States)
Level of Education
Indiana Count
Indiana %
U.S. %
Difference from U.S. Average
Doctorate
42.8K
1.0%
1.34%
-26.5%
Professional
59.6K
1.4%
2.00%
-31.2%
Master’s
284K
6.5%
8.17%
-20.0%
Bachelor’s
682K
15.7%
18.8%
-16.5%
Associate’s
364K
8.4%
8.18%
+2.7%
Some College
904K
20.8%
21.0%
-0.6%
High School
1.49M
34.2%
27.5%
+24.4%
Some High School
348K
8.0%
7.44%
+7.8%
Less than High School
130K
3.0%
4.15%
-27.8%
None
39.1K
0.9%
1.42%
-36.7%
Indiana has fewer advanced degree holders (Doctorate, Professional, Master’s, and Bachelor’s) compared to the national average, with the largest gap in professional degrees (-31.2%).
The percentage of people with a high school diploma as their highest qualification is 24.4% higher than the U.S. average, suggesting a strong focus on secondary education completion.
The proportion of individuals with some high school education but no diploma is slightly higher than the national average (+7.8%).
Indiana has fewer individuals without any formal education compared to the national average, indicating success in basic education access.
Indiana Income Statistics for 2025
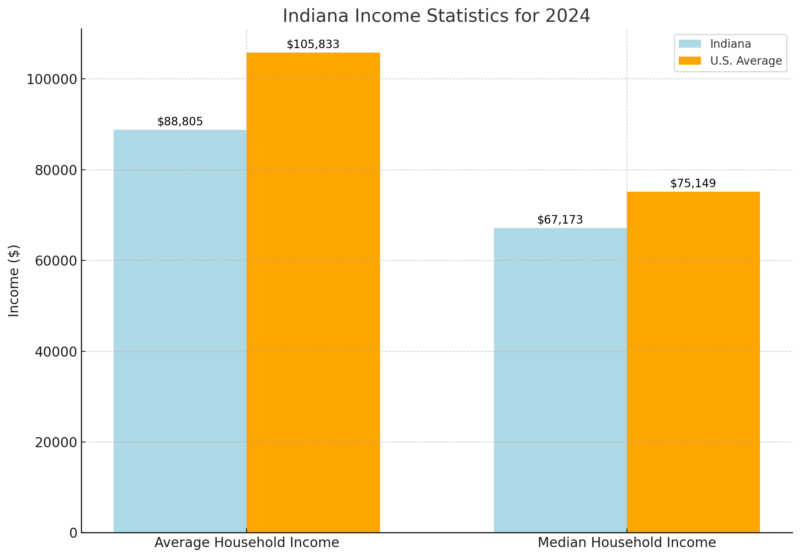
Indiana’s average household income is 16% lower than the U.S. average, and the median household income is 11% lower as per Income By Zip Code.
Despite being below national averages, the median figure suggests a balanced income distribution compared to states with greater income inequality.
Richest Zip Codes in Indiana
Rank
Zip Code
Population
Mean Income
Median Household Income
1
46077
34,056
$205,702
$154,324
2
46814
16,328
$194,277
$131,339
3
46033
39,859
$191,040
$147,998
4
46032
51,250
$185,694
$121,496
5
46278
8,650
$170,717
$148,227
6
46037
46,858
$164,143
$132,272
7
46074
44,075
$157,543
$121,250
8
46106
9,616
$157,468
$102,052
9
46301
578
$156,230
$116,071
10
46055
14,130
$155,273
$108,020
The richest zip code in Indiana is 46077 (Zionsville), with an average household income of $205,702.
These wealthy zip codes highlight areas with significant income disparities within the state, often correlating with higher housing costs and economic hubs.
Salary Data
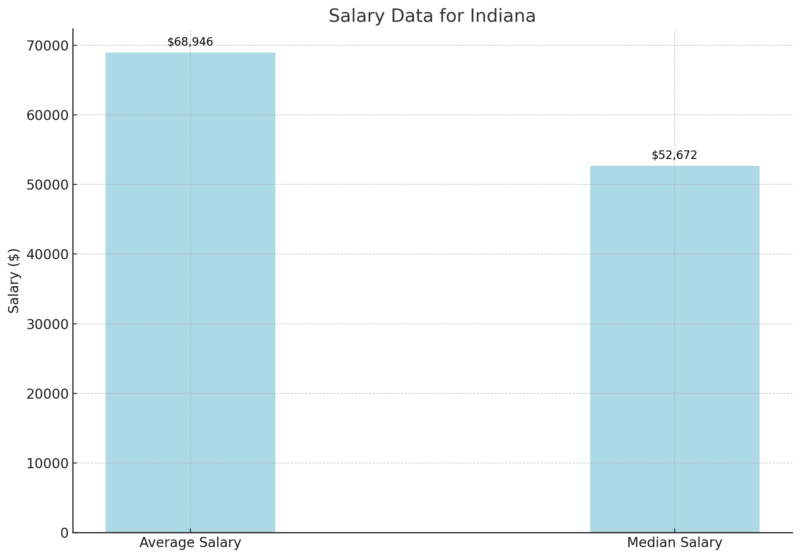
The average salary in Indiana for full-time workers is $68,946, while the median salary is $52,672.
Median values are generally a better representation of typical earnings as they are less skewed by high earners.
Individual Income
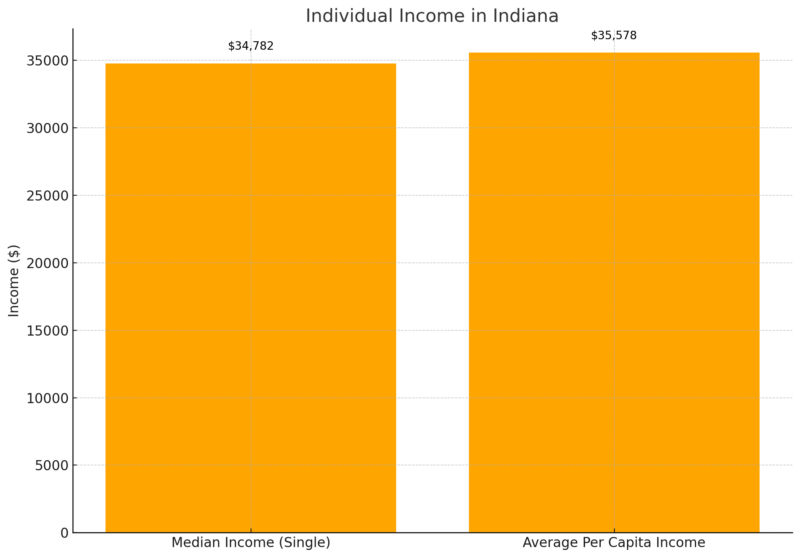
Single-person households in Indiana have a median income of $34,782, with the average per capita income at $35,578.
Per capita income tends to be lower as it includes non-working individuals, such as children or retirees.
Family Income
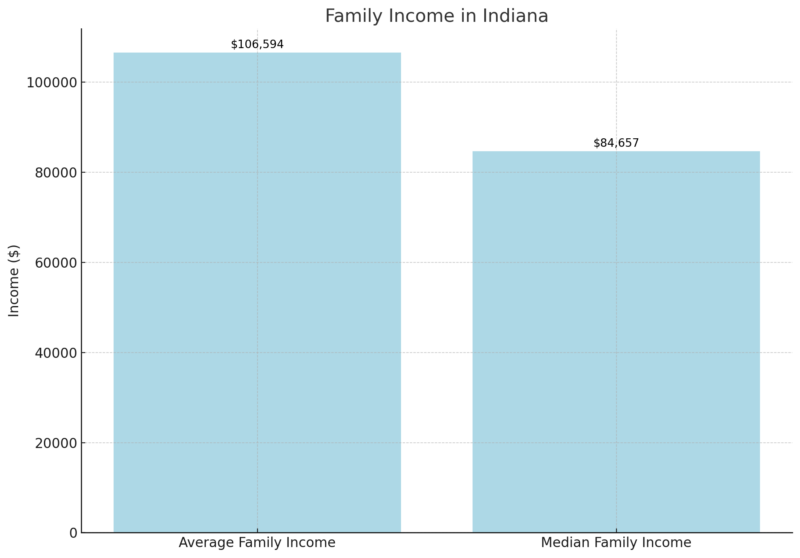
Family income in Indiana reflects the combined earnings of all household members, with an average of $106,594 and a median of $84,657.
These figures indicate higher earnings potential for families compared to individuals.
Retirement Income
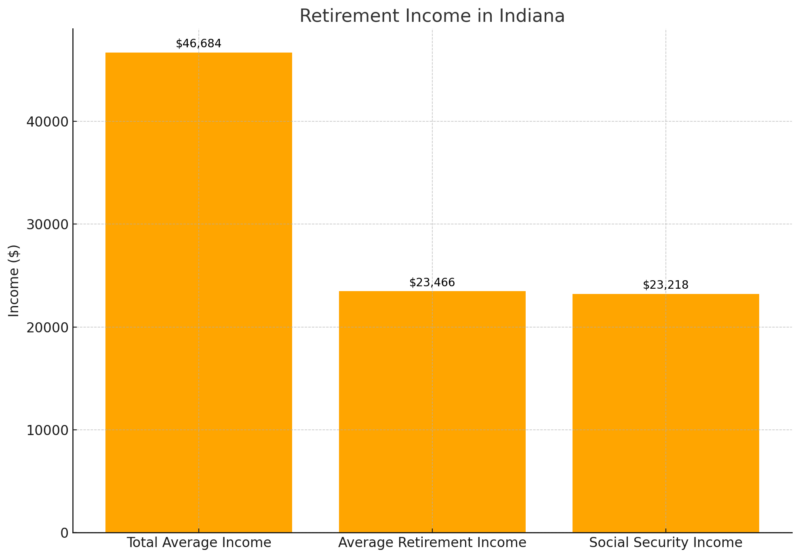
The total average retirement income in Indiana is $46,684, combining $23,466 from retirement accounts and $23,218 from Social Security benefits.
Social Security plays a crucial role in supporting retirees, emphasizing its importance in the state’s income structure.
Migration Patterns
5% of Indiana residents are immigrants, totaling 354,348 individuals in 2018 as noted in the report of the American Immigration Council.
Another 5% of residents are native-born U.S. citizens with at least one immigrant parent.
Immigrants in Indiana include:
- 160,232 women
- 165,144 men
- 28,972 children
The top countries of origin for immigrants are:
- Mexico (30%)
- India (9%)
- China (7%)
- Myanmar (3%)
- Philippines (3%)
41% of immigrants in Indiana were naturalized U.S. citizens as of 2018, with another 70,379 eligible for naturalization in 2017.
82% of immigrants report speaking English “well” or “very well.”
Educational Attainment of Immigrants
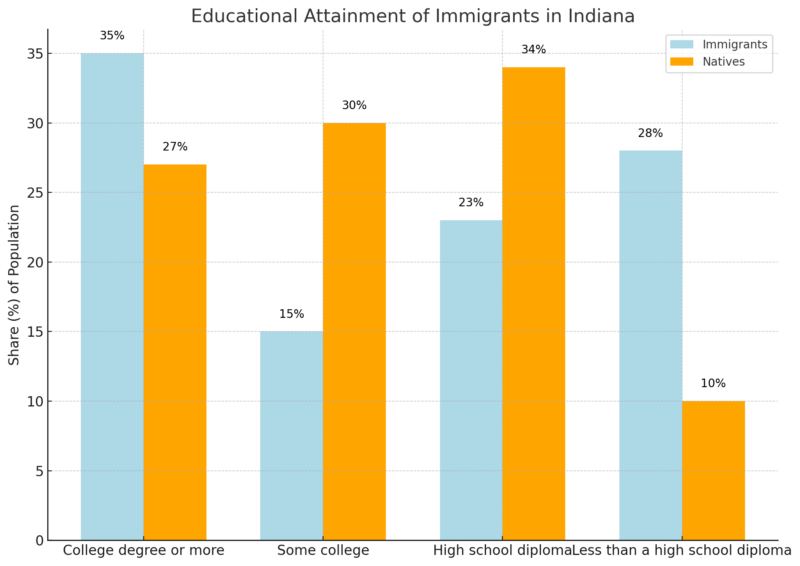
Immigrants are highly educated, with 35% holding college degrees or higher, compared to 27% of natives.
However, 28% of immigrants lack a high school diploma, highlighting educational disparities within the immigrant community.
Immigrant Family Dynamics
Approximately 100,000 undocumented immigrants represent 29% of the immigrant population and 2% of Indiana’s total population.
Nearly 68,000 U.S. citizens in Indiana live with at least one undocumented family member.
About 3% of children in the state (54,483) are U.S. citizens with at least one undocumented family member.
Economic Contributions of Immigrants
Immigrants account for 7% of Indiana’s labor force (226,043 workers in 2018).
7% of business owners in Indiana are immigrants, significantly contributing to the state’s economy.
13% of computer and math employees in Indiana are immigrants, showcasing their vital role in high-skilled industries.
Industry and Occupation Distribution
Top Industries
Number of Immigrant Workers
Immigrant Share (%)
Manufacturing
71,366
9%
Educational Services
24,861
7%
Health Care and Social Assistance
24,645
N/A
Accommodation and Food Services
23,046
8%
Retail Trade
22,914
N/A
Immigrants make significant contributions to Indiana’s manufacturing sector (9% of all workers) and accommodation/food services (8% of workers).
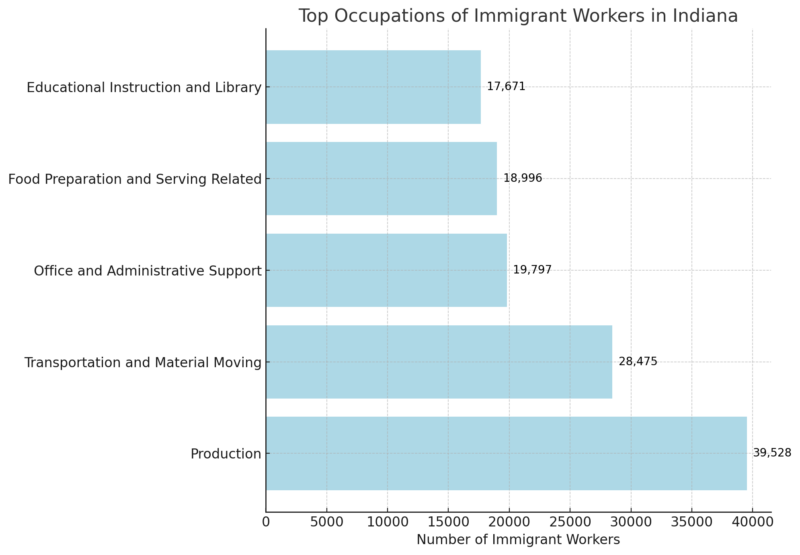
The most common occupations for immigrant workers include production roles (39,528 workers) and transportation/material moving (28,475 workers).
Deferred Action for Childhood Arrivals (DACA)
- As of March 2020, Indiana had 8,870 active DACA recipients, with 10,771 people granted DACA status since 2012.
Health and Vital Statistics
Indicator
Value
Fertility Rate
59.7 (births per 1,000 women aged 15-44)
Teen Birth Rate
16.7 (births per 1,000 females aged 15-19)
Infant Mortality Rate
7.16 (infant deaths per 1,000 live births)²
Life Expectancy (at Birth)
74.6 years (2021)
Marriage Rate
6.1 (marriages per 1,000)
Divorce Rate
n/a
Leading Cause of Death
Heart Disease
Drug Overdose Death Rate
41.0 (per 100,000)¹
Firearm Injury Death Rate
17.4 (per 100,000)¹
Homicide Rate
8.4 (per 100,000)¹
CDC notes that Indiana’s fertility rate (59.7) reflects a steady birth trend among women aged 15-44.
The teen birth rate (16.7) indicates a need for focused efforts on teen pregnancy prevention.
The infant mortality rate of 7.16 is higher than the national average, highlighting potential health disparities.
Life expectancy in Indiana is 74.6 years, which is below the national average, largely influenced by leading causes of death such as heart disease.
High rates of drug overdose deaths (41.0) and firearm injury deaths (17.4) underscore critical public health challenges.
Birth Data
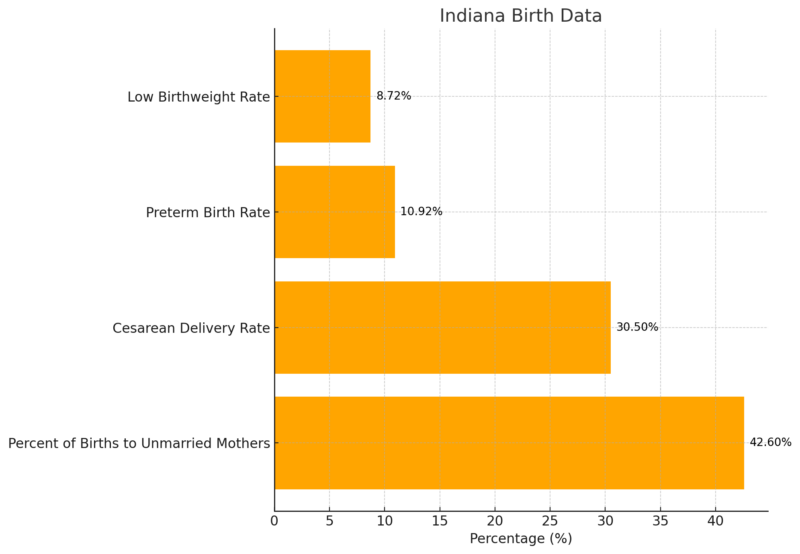
Nearly 43% of births in Indiana are to unmarried mothers, a trend that may influence access to healthcare and economic stability.
The cesarean delivery rate (30.5%) is comparable to national averages but reflects an area for possible improvement in maternal healthcare practices.
Preterm birth rates (10.92%) and low birthweight rates (8.72%) indicate areas for enhanced prenatal care and intervention strategies.
Indiana Labor Force Data
Month
Civilian Labor Force (in thousands)
Employment (in thousands)
Unemployment (in thousands)
Unemployment Rate (%)
May 2024
3,377.2
3,252.6
124.6
3.7%
June 2024
3,378.8
3,250.3
128.4
3.8%
July 2024
3,387.2
3,251.4
135.8
4.0%
August 2024
3,398.2
3,257.1
141.1
4.2%
September 2024
3,417.9
3,270.0
147.9
4.3%
October 2024
(p) 3,433.0
(p) 3,282.5
(p) 150.5
(p) 4.4%
The labor force grew steadily from 3,377.2 thousand in May 2024 to 3,433.0 thousand in October 2024, reflecting an expanding workforce according to BLS.
Employment increased modestly over the same period, from 3,252.6 thousand in May to 3,282.5 thousand in October, signaling job growth.
Unemployment rose from 124.6 thousand in May to 150.5 thousand in October, with the unemployment rate increasing from 3.7% to 4.4%, suggesting the labor market softening despite workforce growth.
Job Openings
Month
Job Openings (thousands)
Job Openings Rate (%)
Unemployment-to-Job Opening Ratio
August 2024
145
4.2
1.0
September 2024
141
4.1
1.0
National Average
N/A
4.5
0.9
Indiana’s job openings decreased slightly from 145,000 in August to 141,000 in September, with the opening rate dropping from 4.2% to 4.1%.
Unemployment claims in Indiana increased last week https://t.co/qTlP6pZfFj
— Journal & Courier (@jconline) December 14, 2024
While Indiana’s ratio of unemployed persons per job opening remained at 1.0, it was higher than the national average of 0.9, indicating a moderately tighter labor market nationwide compared to Indiana.
Hires and Separations
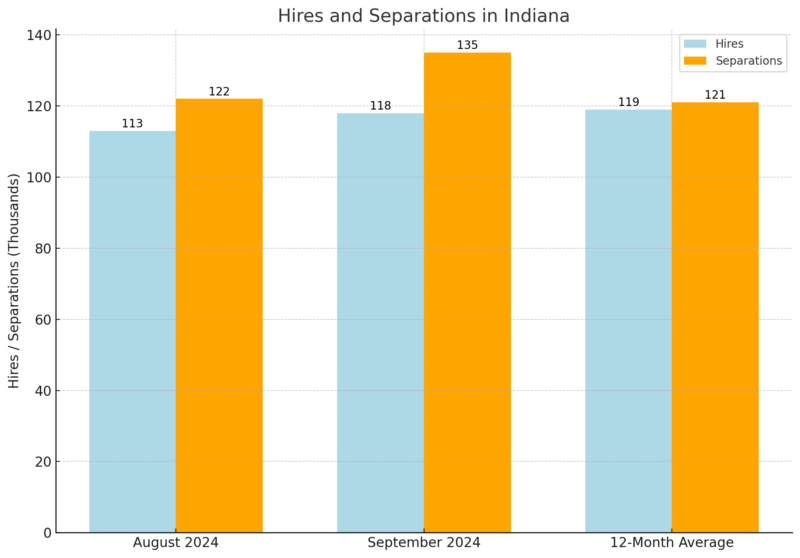
Buareu says that hires in Indiana increased from 113,000 in August to 118,000 in September, while separations rose significantly from 122,000 to 135,000.
This resulted in a net employment loss of 17,000 in September, compared to a loss of 9,000 in August.
Over the past year, hires and separations have remained closely aligned, averaging 119,000 and 121,000 per month, respectively, indicating a stable but competitive labor environment.
Quits and Layoffs/Discharges
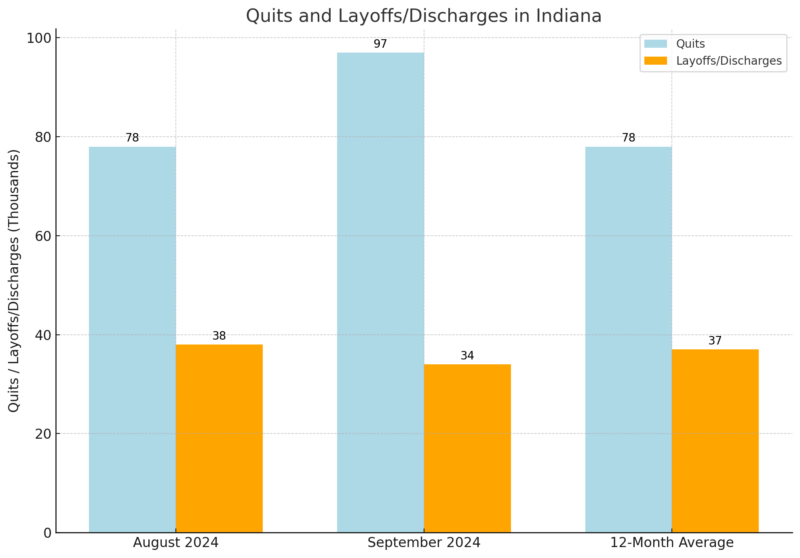
Voluntary quits increased sharply from 78,000 in August to 97,000 in September, reflecting a more fluid labor market, possibly driven by employees seeking better opportunities or dissatisfaction with current roles.
Layoffs and discharges, however, decreased slightly from 38,000 in August to 34,000 in September, remaining consistent with the 12-month average of 37,000.
These trends suggest that Indiana’s labor force is experiencing significant voluntary movement rather than involuntary job losses.
Methodology
- Data was compiled from reputable sources such as the U.S. Census Bureau, American Community Survey, and BLS reports.
- Population figures were drawn from the World Population Review and recent estimates.
- Labor statistics were based on Job Openings and Labor Turnover Survey (JOLTS) reports.
- Historical population trends were analyzed to provide growth rates and demographic insights.
- For context, education and income statistics were compared with national averages.
- Immigrant contributions were highlighted using American Immigration Council data.
References:
- World Population Review – Indiana Population 2024
- Neilsberg Insights – Indiana Population by Gender
- American Immigration Council – Immigrants in Indiana
- Statistical Atlas – Educational Attainment in Indiana
- Income By Zip Code – Indiana Income Statistics
- CDC – Indiana State Health Statistics
- Bureau of Labor Statistics (BLS) – Indiana Labor Force Data
- Indiana Historical Bureau – What is a Hoosier?
- Indiana Migration Statistics – World Population Review – Indiana Counties
Related Posts:
- New Mexico Population 2025 - Key Insights and Stats
- Washington State Population Boom in 2025 - Key Stats…
- North Carolina Population 2025 - Key Stats And Insights
- Missouri’s Population in 2025 - Key Stats and Insights
- Kentucky Population in 2025 - Stats and Insights
- North Dakota’s Population Data in 2025 - Key…


