Recent projections indicate that in 2025, the metro area population will reach 1,360,000, reflecting a 1.12% increase from the previous year as noted by Macrotrends.
In 2025, the population is estimated at 997,164 residents within the city limits, illustrating a dynamic and varied community according to the World Population Review.
The city’s population is relatively young, which may be appealing to those looking to move to a vibrant and dynamic region.
With an average resident age of 36.3, Jacksonville’s youthful demographic creates opportunities for economic development and cultural enrichment.
Key Takeaways
Age Distribution
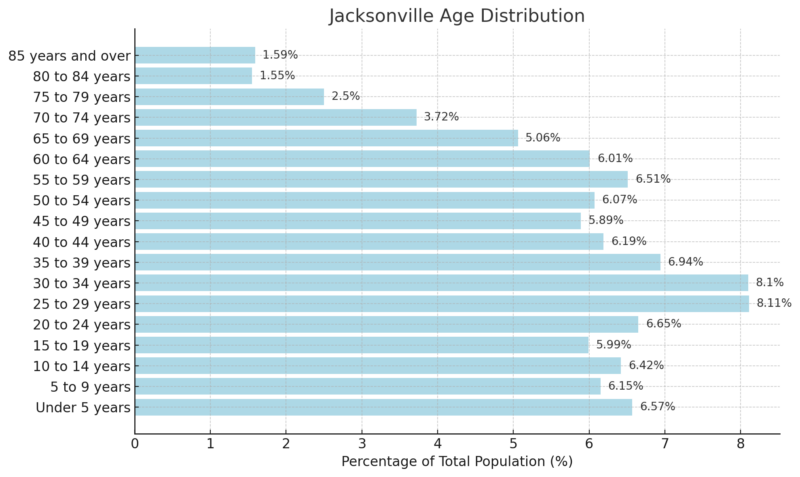
According to the 2018-2022 ACS 5-Year Estimates, the median age in Jacksonville, FL, is 36.3 years.
The population distribution is as follows: 19.14% were under the age of 15, 20.75% were between 15 and 29 years old, 45.71% were aged 30 to 64, 12.83% were between 65 and 84 years old, and 1.59% were 85 years or older.
Gender Composition
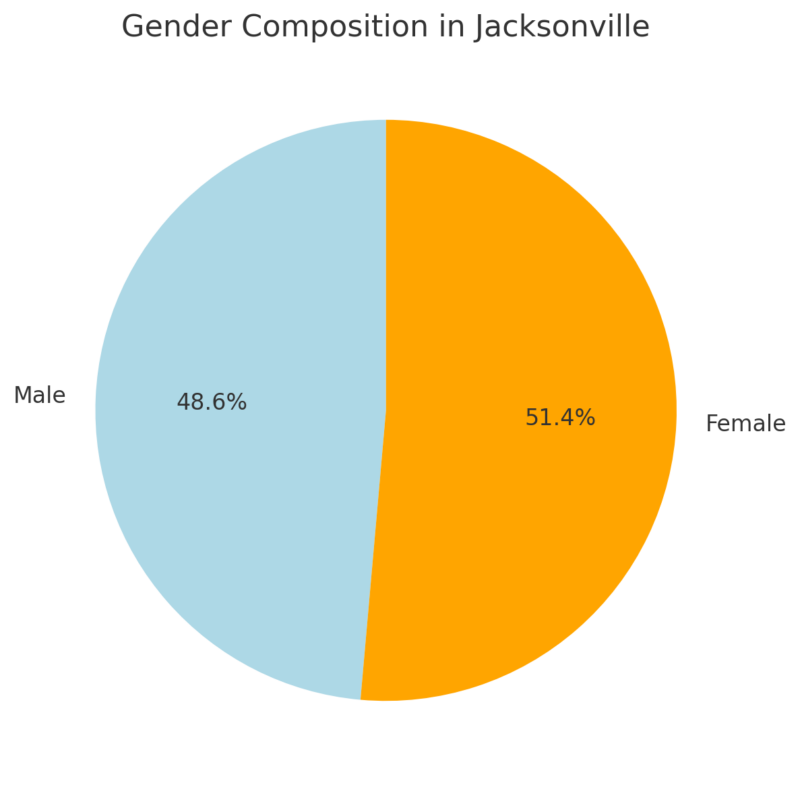
Neilsberg notes that the gender distribution in Jacksonville shows a slight predominance of females, making up 51.40% of the total population, compared to 48.60% males.
This results in 26,537 more females than males in the city. The nearly equal split suggests a balanced gender composition with minimal disparities.
Population by Race
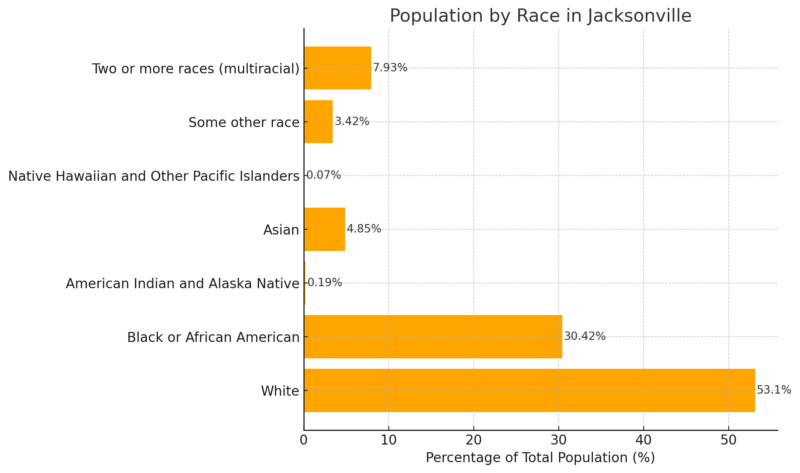
According to Neilsberg The racial composition of Jacksonville highlights that the majority of the population is White (53.10%), followed by Black or African American individuals at 30.42%.
Multiracial individuals make up 7.93%, while Asians account for 4.85%. Smaller percentages represent other racial groups: 3.42% are categorized as some other race, 0.19% are American Indian and Alaska Native, and 0.07% are Native Hawaiian and Other Pacific Islander.
This diversity underscores Jacksonville’s multifaceted demographic structure, with significant representation of minority groups.
Population Growth Trends
Jacksonville has experienced steady growth, with a population increase of nearly 2% between 2010 and 2012. This upward trend is expected to persist as the local economy continues to recover from the housing crisis and recession.
The Jacksonville area boasts a rich history of habitation spanning thousands of years. It is home to some of the oldest pottery remnants found in the United States. In the 16th century, the Mocama people inhabited the region, with their villages forming part of the Saturiwa chiefdom at the time of European contact.
European exploration began in the area in 1562 when a French explorer charted the St. Johns River. In 1564, Fort Caroline, the first European settlement, was established, only to be attacked and renamed San Mateo by Spanish forces the following year.
In 1763, Spain ceded Florida to the British, who constructed the King’s Road to connect St. Augustine to Georgia. After Britain’s defeat in the Revolutionary War, Spain regained control in 1783. Florida was later ceded to the United States in 1821, leading to the establishment of the town of Jacksonville, named in honor of Andrew Jackson.
Population by Neighborhood in Jacksonville, FL
Rank
Neighborhood
Population (in thousands)
1
Beach Haven
18.60k
2
Golden Glades – Tamiami
18.03k
3
East Arlington
17.77k
4
Sandalwood
17.72k
5
Chimney Lakes
13.74k
6
Windy Hill
12.82k
7
Jacksonville Heights
12.74k
8
Del Rio
11.51k
9
North Beach
10.85k
10
Mandarin Station – Losco
10.54k
11
Highlands
10.23k
12
Greenland
10.14k
13
Mandarin
9.90k
14
Baymeadows
9.56k
15
Riverside
9.54k
16
Murray Hill
9.31k
17
Sans Pareil
9.20k
18
Oceanway
8.96k
19
Southside Estates
8.71k
20
Hyde Park
8.69k
21
Craven
8.55k
22
Englewood
8.48k
23
Oak Hill
8.38k
24
Deerwood
7.71k
25
Woodland Acres
7.46k
26
Arlington Hills
7.37k
27
The Cape
7.27k
28
Loretto
7.17k
29
Crystal Springs
7.15k
30
Mid-Westside
7.13k
31
Ortega Hills
7.11k
32
Hillcrest
7.05k
33
Sunbeam
7.01k
34
Julington Creek
6.91k
35
Cedar Hills
6.86k
36
Holiday Hill
6.83k
37
Brentwood
6.74k
38
Turtle Creek
6.71k
39
Secret Cove
6.43k
40
Girvin
6.42k
41
Normandy Estates
6.42k
42
Downtown Jacksonville
6.29k
43
San Jose
5.95k
44
Glynlea – Grove Park
5.79k
45
Normandy Manor
5.79k
46
Duclay
5.77k
47
Arlingwood
5.67k
48
Avondale
5.57k
49
Whitehouse
5.51k
50
Sans Souci
5.19k
Beach Haven leads the list with a population of 18.60k, followed by Golden Glades – Tamiami (18.03k) and East Arlington (17.77k). These areas represent the most populated neighborhoods in Jacksonville as noted by Statistical Atlas.
Neighborhoods like Del Rio (11.51k) and North Beach (10.85k) fall in the mid-range of population size.
Smaller neighborhoods include Sans Souci (5.19k), Whitehouse (5.51k), and Avondale (5.57k).
Labor Force Data
Data Series
June 2024
July 2024
August 2024
September 2024
October 2024
November 2024 (p)
Civilian Labor Force (in thousands)
851.9
853.2
848.6
853.2
848.5
842.4
Employment (in thousands)
821.4
820.9
817.6
823.8
819.2
812.5
Unemployment (in thousands)
30.5
32.3
30.9
29.3
29.3
29.9
Unemployment Rate (%)
3.6
3.8
3.6
3.4
3.5
3.6
- The civilian labor force fluctuated slightly, peaking at 853.2 thousand in July and September 2024 before decreasing to 842.4 thousand in November according to BLS.
- Employment followed a similar pattern, reaching its highest in September at 823.8 thousand and dropping to 812.5 thousand in November.
- Unemployment remained relatively stable, with the lowest value recorded in September (29.3 thousand) and a slight increase to 29.9 thousand in November.
- The unemployment rate ranged from 3.4% to 3.8%, showing consistently low levels. It was at its lowest in September (3.4%) and slightly increased to 3.6% by November.
Migration and Mobility
Jacksonville was recently recognized as the fifth-ranking U.S. city for “brain gain” by USA Today. This distinction is given to cities that effectively attract and retain college-educated individuals, countering the phenomenon of “brain drain,” where communities lose college graduates.
According to the publication, which analyzed the 2023 U.S. Census American Community Survey data and state-level migration patterns, Jacksonville recorded a net migration of 5,310 college-educated residents in 2023.
- Cost of Living: Jacksonville offers a more affordable cost of living compared to many peer cities.
- Tax Environment: The city provides a favorable tax environment, attracting professionals seeking economic stability.
Households in Jacksonville, FL
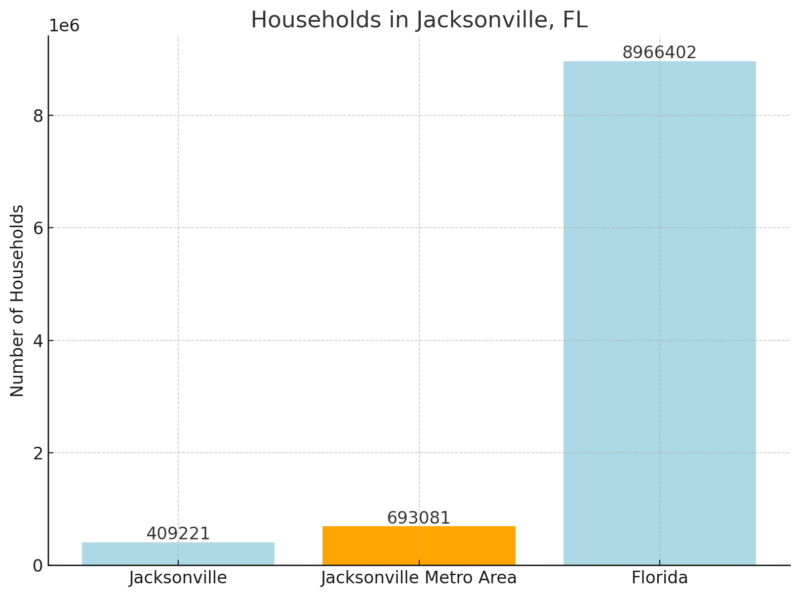
Jacksonville has 409,221 households, with an average of 2.4 persons per household, aligning with the metro area average but slightly below the state average (2.5). This smaller household size could reflect a mix of family and non-family household types.
Population by Household Type
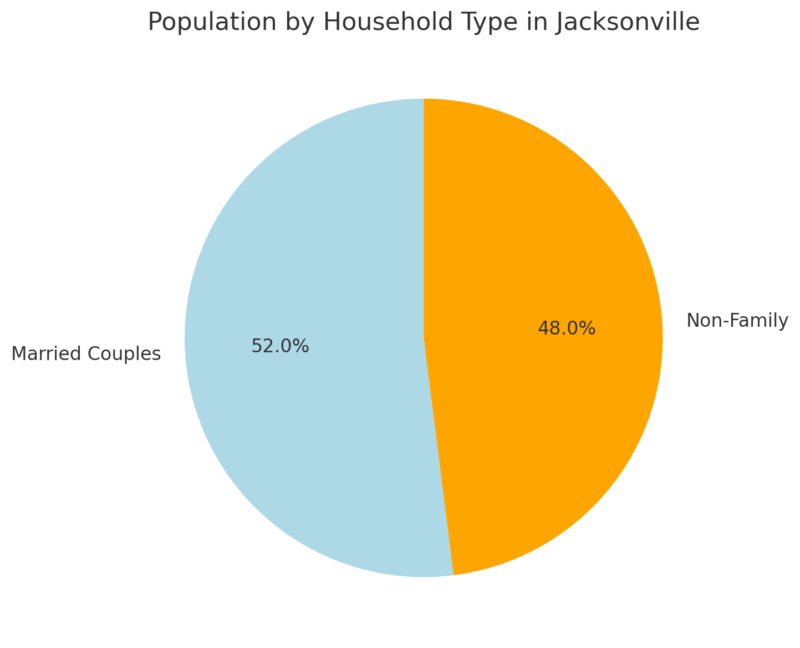
Married couples constitute 52% of households in Jacksonville, indicating a balanced distribution between family and non-family households. This suggests a diverse housing landscape suitable for various demographics.
Marital Status (Population 15 Years and Over)
Marital Status
Percentage
Married
44%
Single
Remaining (not explicitly detailed)
At 44%, the proportion of married individuals in Jacksonville is slightly lower than both the metro area (51%) and the state (50%). This difference may reflect variations in demographics or lifestyle preferences in the city.
Marital Status by Sex
Widowhood and divorce are more common among females, with 8% widowed and 15% divorced compared to 3% and 11% for males, respectively.
Men are also slightly more likely to be married than women (46% vs. 42%).
Fertility Rates in Jacksonville, FL
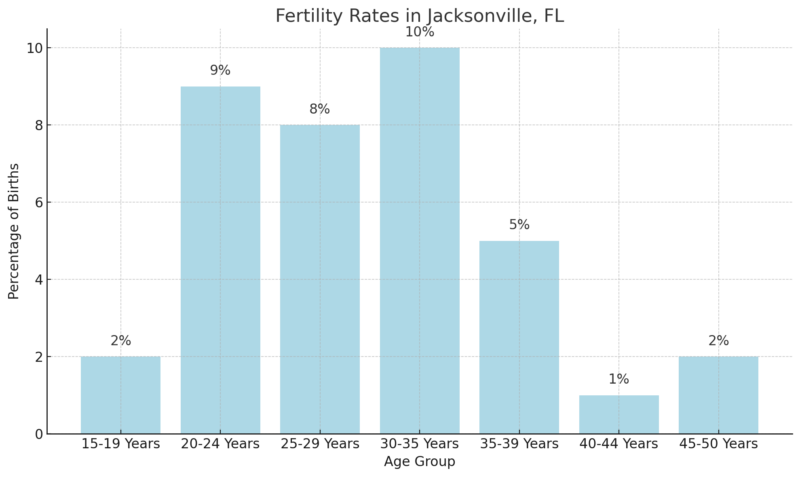
The highest fertility rates are observed in women aged 30-35 (10%) and 20-24 (9%), reflecting trends of childbearing in early adulthood and early middle age as noted by Censusreporter.
Fertility sharply declines in women aged 40 and above. Jacksonville’s fertility rate of 5.4% is slightly below the metro area (5.7%) but higher than the state average (5.1%).
Educational Attainment of Adults in Jacksonville, FL
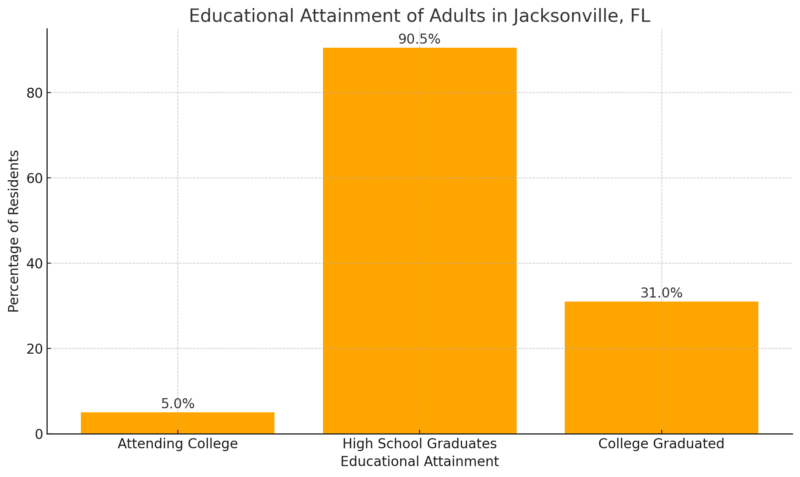
The majority of Jacksonville residents (90.5%) have completed high school, with 31.0% holding college degrees.
A smaller proportion (5.0%) are currently attending college. These figures indicate a solid foundation of basic education, with room to improve higher education attainment levels.
Income Levels in Jacksonville, FL
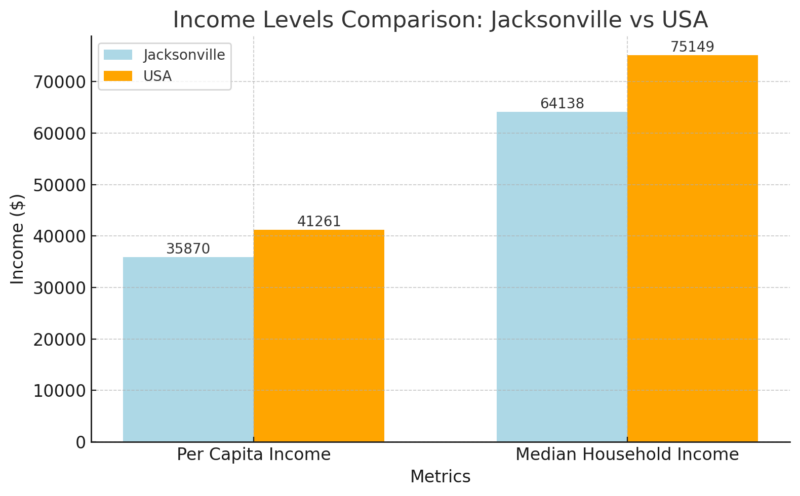
Jacksonville’s per capita income ($35,870) and median household income ($64,138) are both below the national averages of $41,261 and $75,149, respectively according to Neighborhood Scout.
This suggests a lower cost of living but may also reflect disparities in high-wage job opportunities compared to national trends.
Individuals Below Poverty Level
Metric
Percentage of Residents
Individuals Below Poverty Level
14.8%
At 14.8%, Jacksonville’s poverty rate is significant, highlighting economic challenges for a portion of the population. Addressing income inequality and providing economic opportunities remain key priorities for the community.
Employment by Industry in Jacksonville, FL
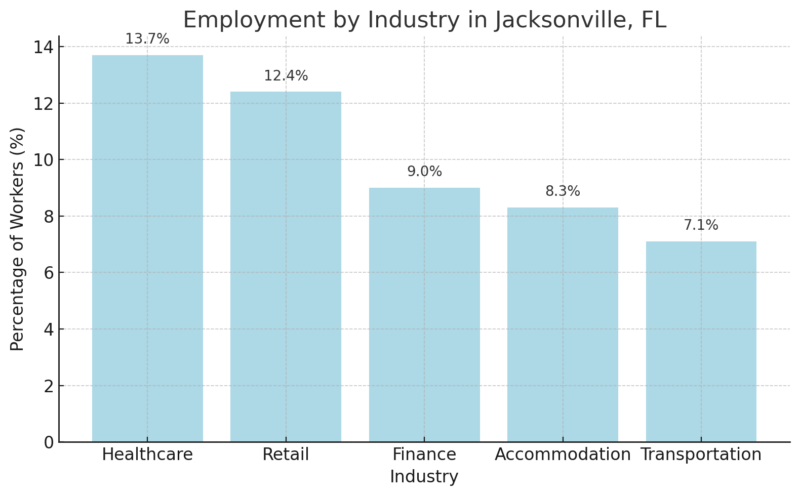
Healthcare leads employment industries in Jacksonville, accounting for 13.7% of the workforce, followed by retail (12.4%) and finance (9.0%). Accommodation and transportation sectors also employ a significant share of workers. This diversity in industries reflects a balanced economic structure with opportunities across multiple sectors.
Why people move to Jax https://t.co/lEXDw7DqfC
— Jacksonville Business Journal (@JaxBizJournal) December 11, 2024
Housing Market Trends 2025
Metric
Jacksonville, FL
Growth (% YoY)
Median Sale Price
$311,995
+0.6%
Number of Homes Sold
1,189
+28.3%
Median Days on Market
67 days
+20 days
Redfin notes that the median home sale price in Jacksonville increased slightly by 0.6% year-over-year to $311,995, reflecting a stable housing market with modest price growth.
Home sales surged by 28.3% year-over-year, with 1,189 homes sold in December 2024 compared to 927 in December 2023. This indicates increased demand and activity in the housing market.
Homes are staying on the market longer, with a median of 67 days compared to 47 days last year, a 20-day increase. This could suggest a slight cooling in the speed of transactions despite the rise in home sales.
Crime Rate 2025
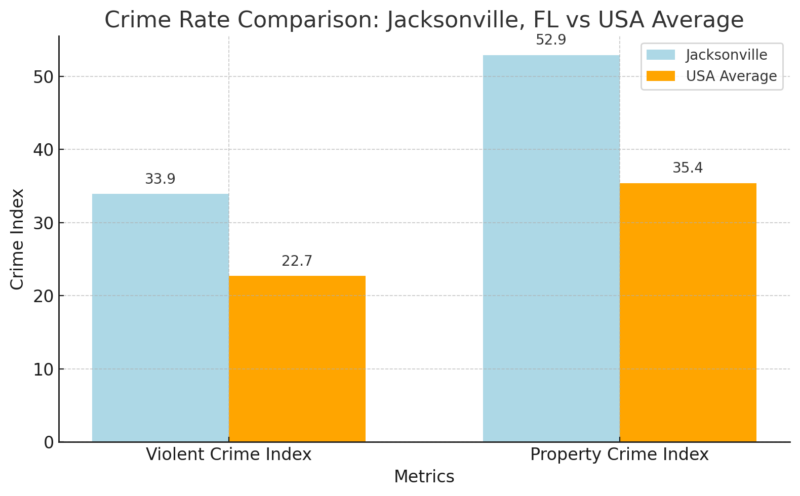
- Violent Crime: Best Places notes that Jacksonville has a violent crime index of 33.9, higher than the U.S. average of 22.7, indicating more frequent occurrences of violent offenses compared to the national norm.
- Property Crime: The property crime index in Jacksonville is 52.9, significantly above the national average of 35.4, suggesting higher rates of theft, burglary, or vandalism.
The indices, ranging from 1 (low crime) to 100 (high crime), are derived from FBI data and highlight areas where Jacksonville exceeds national averages in crime rates. This suggests a need for focused efforts on crime prevention and community safety initiatives.
Methodology
Population and demographic data were sourced from the 2023 U.S. Census American Community Survey and Macrotrends projections for 2025.
Housing market insights were derived from Redfin’s analysis of MLS data and year-over-year trends.
Employment and industry distribution statistics were provided by the Bureau of Labor Statistics and Census Reporter.
Educational attainment and income levels were extracted from the American Community Survey and Neighborhood Scout reports.
Historical and cultural context was compiled from local records and historical surveys.
The analysis focused on identifying trends, growth patterns, and key socioeconomic factors relevant to Jacksonville’s community and economy.
References
- Macrotrends – Jacksonville Population
- World Population Review – Jacksonville, FL Population
- Neilsberg – Jacksonville FL Population by Age
- Neilsberg – Jacksonville FL Population by Gender
- Neilsberg – Jacksonville FL Population by Race
- Statistical Atlas – Jacksonville, FL Population
- Bureau of Labor Statistics (BLS) – Jacksonville Economic Data
- USA Today – Jacksonville is Ranked 5 for U.S. Cities Attracting College-Educated Residents
- Census Reporter – Jacksonville, FL Profile
- Neighborhood Scout – Jacksonville, FL Demographics
- Redfin – Jacksonville Housing Market
Related Posts:
- Map of Jacksonville, Florida – Geography,…
- Houston Population 2025 - Growth Trends and Projections
- Oklahoma City Population 2025 - Growth Trends and…
- Columbus Population 2025 - Growth Trends and Projections
- Portland, OR Population 2025 - Growth Trends and Projections
- Nashville Population 2025 - Growth and Future Projections


