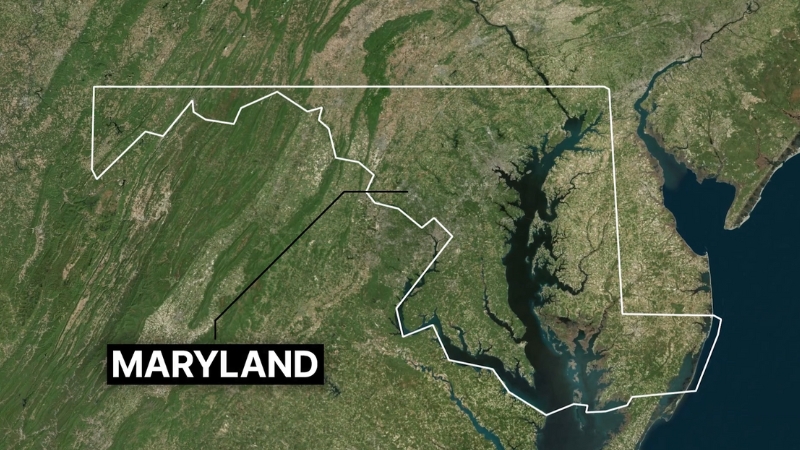
The population of Maryland reached approximately 6,196,520, an indicator of steady growth despite previous fluctuations according to World Population Review.
The last confirmed population count for Maryland was recorded in the 2020 Census, indicating a population of 6,177,224, which represented a 9% increase from the 2000 figures.
With a steady growth rate of 0.96%, Maryland ranks 20th in the nation for population growth.
Key Takeaways
Demographic Breakdown by Age
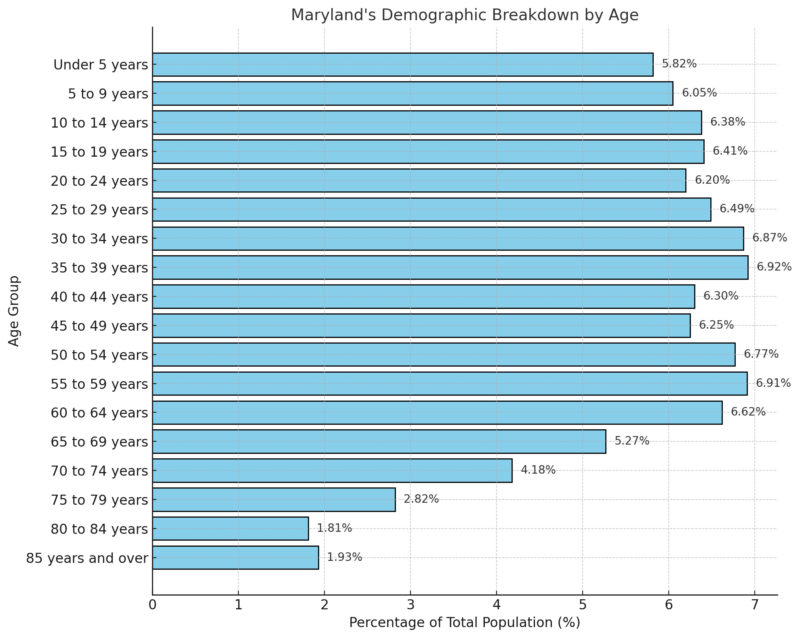
According to the 2018-2022 ACS 5-Year Estimates, Maryland’s median age is 39.1.
Within the population, 18.25% are under 15 years old, 19.10% are between 15 and 29, 46.64% are aged 30 to 64, 14.08% are between 65 and 84, and 1.93% are 85 and older.
Population by Major Age Cohorts
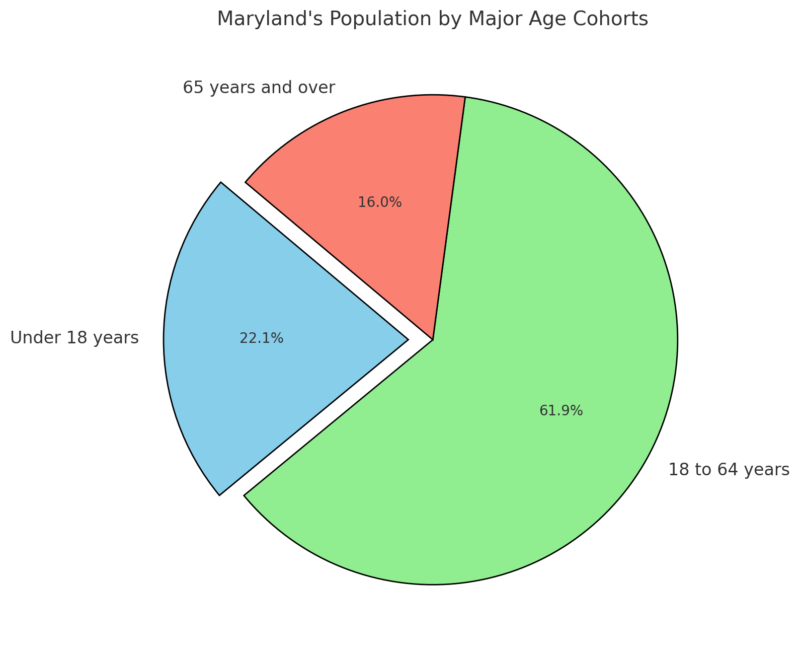
The working-age population (18 to 64 years) makes up the majority at 61.92%, slightly above the national average of 61.36%, indicating a strong labor force potential in Maryland.
Children under 18 constitute 22.08% of the population, nearly aligned with the national average, while seniors aged 65 and over make up 16%, slightly below the national rate of 16.53%.
Maryland Population Distribution by Select Age Groups
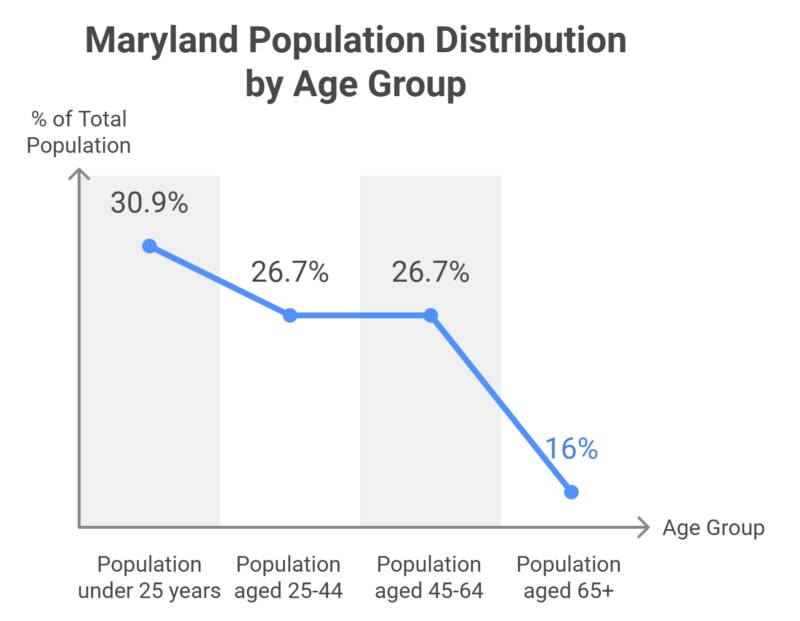
Maryland population distribution shows that approximately 30.9% are under 25 years old, which includes a substantial number of youth and young adults, indicating future workforce growth.
Both the 25-44 and 45-64 age groups represent 26.7% each, forming the core of Maryland’s active working population. Meanwhile, the senior population aged 65 and older represents 16%, pointing toward a moderate but growing need for healthcare and retirement services as this cohort increases over time.
Dependency Ratios
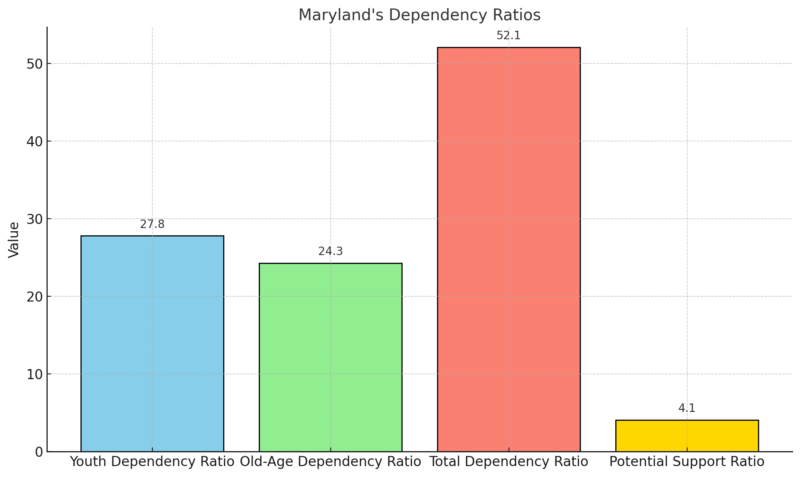
The Youth Dependency Ratio of 27.8 means there are about 28 children aged 0-14 for every 100 people aged 15-64, suggesting a significant proportion of the population is young and not yet of working age.
The Old-Age Dependency Ratio of 24.3 indicates that there are about 24 seniors for every 100 working-age individuals, which is manageable but likely to grow. The Total Dependency Ratio of 52.1 reflects the overall number of dependents (both young and elderly) for every 100 working-age individuals, indicating a relatively balanced dependency burden.
The Potential Support Ratio of 4.1 highlights that for every elderly person, there are approximately four working-age individuals, which is sustainable but may require future adjustments as the population ages.
Age Groups (Largest and Smallest)
Age Group
Population
% of Total Population
Largest (35-39)
426,135
6.92%
Smallest (80-84)
111,570
1.81%
The 35-39 age group is the largest with 6.92% of Maryland’s population, signifying a robust segment of experienced working adults who likely contribute significantly to the economy. The smallest age group is 80-84, comprising just 1.81%, highlighting a relatively smaller elderly population.
This age distribution may indicate that Maryland’s population is relatively young, with fewer older residents compared to other states, which could ease demands on healthcare services for the elderly in the short term.
Racial Diversity
Maryland population racial and ethnic composition shows notable diversity. White residents make up the largest racial group at 46%, followed by Black or African American residents at 29% according to Census reporter.
This significant Black population proportion highlights Maryland’s status as one of the more racially diverse states, with historical and cultural roots that contribute to this demographic.
Asian residents represent 7%, indicating a growing minority population in line with national trends of increasing Asian representation.
Maryland Counties by Population, Growth Rate, Area, and Density
County
Population
Growth Rate
Area (sq mi)
Population Density (per sq mi)
Montgomery County
1,063,881
0.28%
190
2,158
Prince George’s
947,880
-1.81%
186
1,962
Baltimore County
843,420
-1.17%
231
1,410
Anne Arundel
595,817
1.14%
160
1,436
Baltimore City
561,371
-3.74%
31
6,931
Howard County
336,636
1.15%
97
1,341
Frederick County
299,242
9.7%
255
453
Harford County
265,473
1.62%
169
607
Carroll County
177,806
2.81%
173
397
Charles County
173,835
4.25%
177
380
Washington County
156,369
1.08%
177
341
St. Mary’s County
115,779
1.56%
139
323
Cecil County
106,474
2.58%
134
308
Wicomico County
105,114
1.5%
144
281
Calvert County
94,897
2.13%
82
446
Allegany County
67,280
-1%
163
159
Worcester County
54,408
3.59%
181
116
Queen Anne’s County
53,296
6.52%
144
143
Talbot County
37,832
0.92%
104
141
Caroline County
33,759
1.47%
123
106
Dorchester County
33,175
1.98%
209
61
Garrett County
28,258
-1.88%
251
44
Somerset County
25,212
2.65%
124
79
Kent County
19,311
1%
107
70
World Population Reveiw notes that Montgomery County, with a population of 1,063,881, is Maryland’s most populous county, adjacent to Washington, D.C., and known as one of the most affluent areas in the nation. Since the 2010 Census, Montgomery has grown by 8.47%, contributing to its substantial size.
Other highly populated counties include Prince George’s County, Baltimore County, Baltimore City, and Anne Arundel County, each with populations exceeding 500,000. Among these, Baltimore City is the only area experiencing population decline, with a reduction of 1.51%.
In contrast, Maryland’s least populated county is Kent, with just 19,311 residents. This county, along with Somerset, Garrett, Dorchester, Caroline, and Talbot, has fewer than 40,000 residents.
Chestertown, Maryland
Kent County
Population: 6,878
Photos from Google Places API
Link: https://t.co/Y20HVageoI pic.twitter.com/gTtUbhpP0a— New town every hour (@TownsUsa) October 28, 2024
Population trends in these less populated counties reveal a mix of minor growth and decline, with Kent County’s population decreasing by 4.07% since the last census.
Howard County leads in growth, boasting an 11.26% increase since 2010, with a population now reaching 336,636. Other counties showing significant growth include Charles (8.53%), Montgomery (8.47%), Frederick (7.62%), and St. Mary’s (6.53%).
On the other hand, Allegany County has experienced the largest population decline, with a decrease of 4.48%, reflecting demographic shifts within the state.
Labor Force Data (April – September 2024)
Month
Civilian Labor Force (in thousands)
Employment (in thousands)
Unemployment (in thousands)
Unemployment Rate (%)
April 2024
3,201.5
3,116.9
84.6
2.6
May 2024
3,208.6
3,122.7
85.9
2.7
June 2024
3,215.0
3,126.5
88.4
2.8
July 2024
3,220.9
3,129.5
91.4
2.8
August 2024
3,226.1
3,131.5
94.6
2.9
September 2024 (p)
3,227.2
3,133.2
94.0
2.9
Note: (p) indicates preliminary data for September 2024.
The labor force has steadily increased from April to September 2024, growing from 3,201.5 thousand to a preliminary 3,227.2 thousand in September.
Employment also shows a consistent rise, reaching 3,133.2 thousand in September from 3,116.9 thousand in April. Despite this employment growth, unemployment figures have increased slightly over the period, rising from 84.6 thousand in April to a preliminary 94.0 thousand in September according to BLS.
The unemployment rate, starting at 2.6% in April, rose gradually to 2.9% by September. While the overall increase is minor, it suggests a tightening in the job market, which may point to an economic cooling or slower job growth relative to the expanding labor force.
Housing Market
Metric
Value
Year-over-Year Change
Median Sale Price
$430,800
+5.3%
Number of Homes Sold
5,456
-1.4%
Median Days on Market
31 days
+7 days
The housing market in September 2024 shows a moderate increase in home prices, with the median sale price up 5.3% year-over-year, reaching $430,800 according to Redfin.
While home prices have appreciated, the number of homes sold has declined slightly by 1.4%, and homes are spending an additional seven days on the market compared to the previous year, suggesting a slight cooling in buyer urgency.
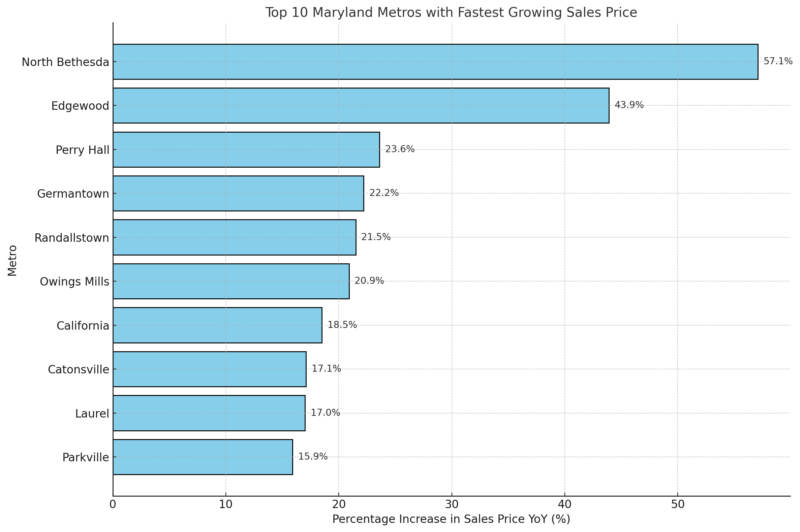
Top 10 Maryland Metros with Fastest Growing Sales Price
Housing Supply
Metric
Value
Year-over-Year Change
Homes for Sale
18,444
+13.0%
Newly Listed Homes
6,719
+3.8%
Months of Supply
2 months
No change
In terms of supply, there has been a 13.0% increase in the number of homes for sale, indicating more options available to buyers.
The months of supply remain steady at 2, showing a market still somewhat constrained in inventory, though slightly less competitive than a year ago.
Maryland Housing Demand
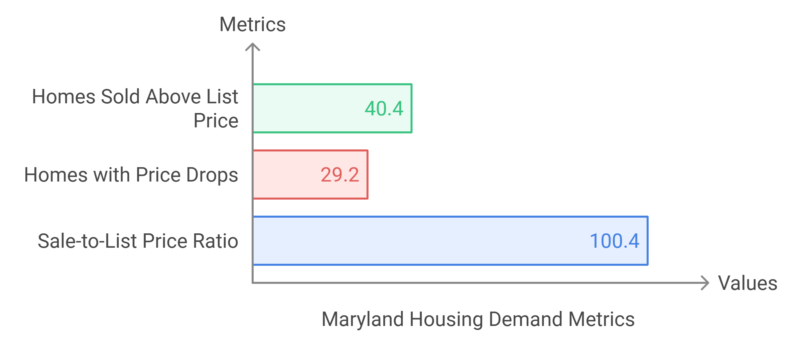
Demand metrics reveal that 40.4% of homes sold above list price, down 3.0 percentage points year-over-year, indicating a slight reduction in market competitiveness.
The increase in price drops to 29.2% suggests that sellers may be adjusting expectations due to a more balanced buyer-seller dynamic.
Overall, while the market is still relatively competitive, these indicators point to a gradual shift toward stabilization.
Educational Stats
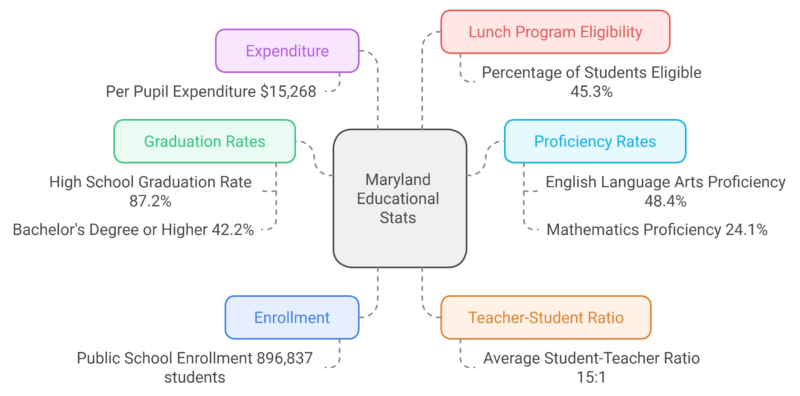
The high school graduation rate stands at 87.2%, reflecting a commitment to student retention and completion.
However, proficiency levels in core subjects indicate areas for improvement. English Language Arts proficiency for students in grades 3 through 8 is at 48.4%, while mathematics proficiency is notably lower at 24.1% according to Maryland Planning.
These figures suggest a need for targeted interventions to enhance student performance in these critical areas.
The state’s investment in education is evident, with a per-pupil expenditure of $15,268, which is above the national average. This funding supports an average student-teacher ratio of 15:1, facilitating more personalized instruction.
In terms of higher education, 42.2% of Maryland residents aged 25 and over hold a bachelor’s degree or higher, indicating a relatively educated adult population.
Healthcare and Public Health Considerations
Maryland Demographic Overview (2021)
Category
Value
Total Population
~6.2 million
Women of Childbearing Age (15-45)
1.2 million
Children and Adolescents (0-19)
1.5 million
Young Adults (20-24)
372,307
Percent of Children with Special Health Care Needs
12.7%
Maryland population includes a substantial number of women of childbearing age, children, and young adults, emphasizing the need for robust maternal and child health services. The large cohort of children and adolescents suggests that resources for pediatric and adolescent healthcare are critical.
Additionally, with 12.7% of children identified as having special health care needs, Maryland faces significant demand for specialized pediatric care, ensuring successful health outcomes for children with complex health conditions according to gov sources.
Maternal and Child Health Population by Race
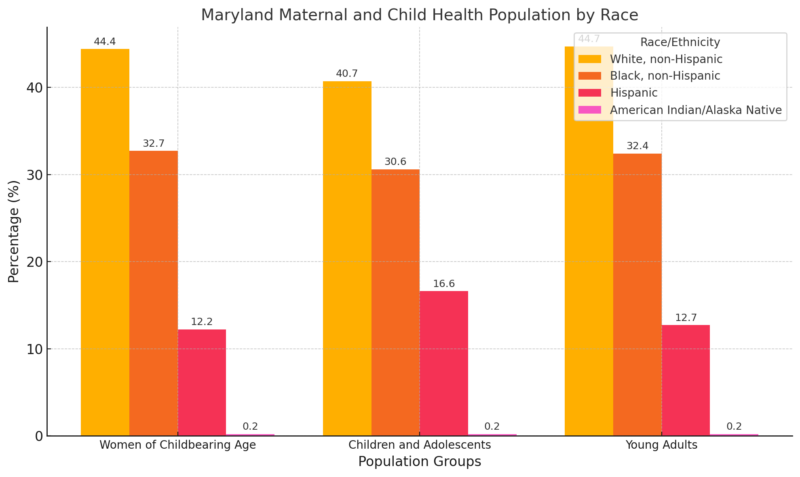
Maternal and child health population is racially diverse, with substantial representation of Black and Hispanic populations alongside White residents. This diversity underscores the need for culturally responsive healthcare services that address the unique needs and disparities among racial and ethnic groups.
For instance, targeted programs for Black and Hispanic populations may be necessary to address specific health challenges and promote equitable outcomes across demographics, especially in maternal and pediatric healthcare.
Healthcare Access & Resources
Metric
Value
Medicaid Enrollees (2022)
1,834,677
Children & Adolescents Enrolled in Medicaid (0-22)
714,292
Federally Qualified Health Centers (FQHCs)
21
Jurisdictions with Health Professional Shortages
19 (of 24)
Jurisdictions Designated as Medically Underserved
23 (of 24)
Maryland’s extensive Medicaid program supports over 1.8 million residents, with a significant portion being children and adolescents, reflecting the state’s commitment to healthcare coverage for vulnerable groups.
However, the shortage of healthcare professionals and medically underserved designations in nearly all jurisdictions reveal substantial access issues, particularly for rural and urban areas.
As indicated in the 2024 State Health Improvement Plan, Maryland prioritizes health equity and infrastructure to support these initiatives.
This data becomes instrumental in shaping policies and strategies for better health outcomes statewide.
Population Projections by Age Group (2020-2040)
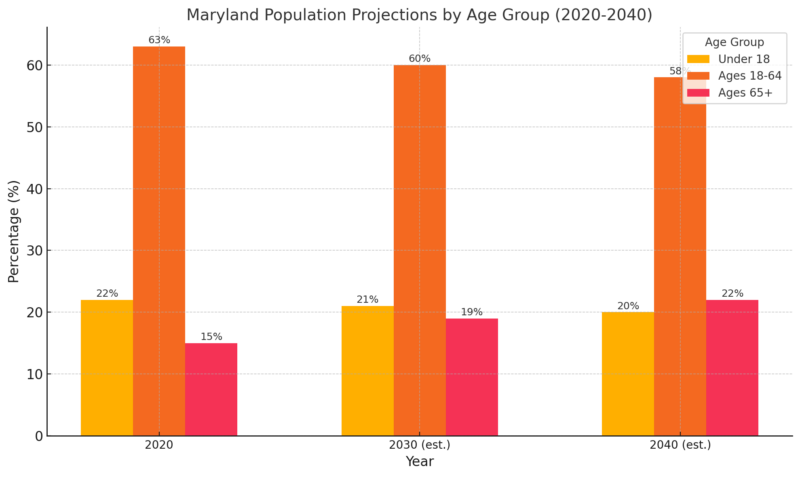
Maryland’s population is expected to increase gradually over the next two decades, from 6.2 million in 2020 to approximately 7 million by 2040 as per MCBA data.
However, the distribution among age groups highlights notable shifts.
The under-18 population is projected to decline slightly as a proportion of the total, while the elderly population (65+) is expected to grow significantly, reaching 22% by 2040.
This aging trend suggests an upcoming demand for expanded healthcare services, senior care facilities, and social support tailored to older adults, which may place strain on Maryland’s healthcare system, especially in underserved areas.
The working-age population (18-64) is expected to remain the largest group but will see a slight reduction as a share of the total population.
Methodology
To craft this article, we began by collecting and synthesizing the latest demographic data from reliable sources like the U.S. Census Bureau, Maryland Department of Planning, and relevant public health reports.
We categorized information into sections on population growth, age distribution, healthcare access, education, and housing market trends. Key data points were organized into tables to ensure clarity and to facilitate easy comparison across categories.
For each section, we provided a concise analysis to highlight trends, challenges, and projections for Maryland’s demographics and health landscape.
Finally, we focused on relevant indicators, like dependency ratios and educational attainment, to offer insights into Maryland’s future population needs and growth potential.
References
- World Population Review – Maryland Population 2024
- U.S. Census Bureau – QuickFacts Maryland
- Neilsberg Insights – Maryland Population by Age
- Census Reporter – Maryland Demographics by Race
- Bureau of Labor Statistics (BLS) – Maryland Economy at a Glance
- Redfin – Maryland Housing Market
- Maryland Department of Planning – 2023 School Enrollment Projections Report
- Maternal and Child Health Bureau – Overview of Maryland’s Health Data
- Maryland State Health Improvement Plan – 2024 State Health Improvement Plan


