

Americans today wait an average of 31 days for a new doctor appointment, according to the 2025 AMN Healthcare survey of major U.S. metro areas.
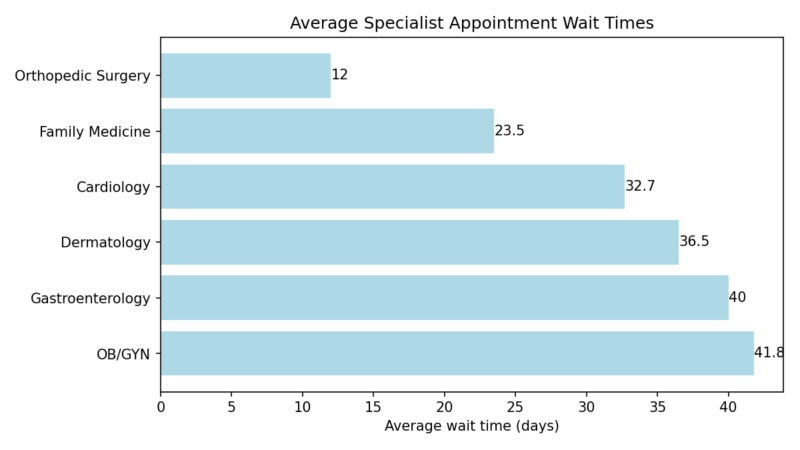
Specialist waits are even longer, with patients now waiting 41.8 days for OB/GYN, 40 days for gastroenterology, 36.5 days for dermatology, and 32.7 days for cardiology.
Diagnostic imaging is also delayed: many hospitals report 2–3+ weeks just to schedule an MRI, with nearly 50 percent of MRI appointments taking longer than the expected date.
Emergency department delays remain severe, with a median ED visit length of 163 minutes, and more than 25 percent of admitted patients waiting at least four hours for a hospital bed.
Elective surgeries frequently take over one month to schedule, especially for non-urgent procedures.
| Category | Average or Typical Wait | Source Notes |
| New Patient Doctor Visit | 31 days | National average across major metros |
| OB/GYN | 41.8 days | Longest specialty wait |
| Gastroenterology | 40 days | Driven by screening demand |
| Dermatology | 36.5 days | Skin cancer checks increase volume |
| MRI Scheduling | 2–4+ weeks | Nearly half are delayed beyond the initial date |
| MRI Results | 1–2 weeks | Radiologist shortage |
| ED Total Visit Time | 163 minutes | CMS-linked data |
| ED Boarding (Admitted) | 4+ hours | Affects 25–35% of patients |
| Elective Surgery | >1 month for many | Especially non-urgent procedures |
How Long Americans Wait for Doctor and Specialist Appointments

Wait times for physicians have steadily risen over two decades. The 2025 AMN Healthcare survey, which studied 15 major metropolitan regions, found that the average new-patient appointment wait time is now 31 days, a 19 percent increase since 2022 and a 48 percent increase since 2004.
Longer delays occur in specialties facing workforce shortages, aging patient populations, and increased demand for chronic disease management.
Average Specialist Appointment Wait Times (2025)
These averages can be misleading because variation is extreme. Individual clinics in surveyed regions reported patients waiting as few as 1 day and as many as 200+ days for the same specialty.
Smaller metropolitan areas and rural regions consistently show longer delays, often due to physician shortages and hospital consolidation.
Diagnostic Imaging Wait Times: MRI, CT, and X-Ray
Diagnostic imaging bottlenecks are among the most persistent access challenges. MRI, the slowest modality, shows the steepest delays.
Hospitals report that routine MRI appointments often require 2–3 weeks of waiting, even when the exam takes only 15 minutes. A national analysis of outpatient imaging found that nearly half of all MRI orders are delayed, meaning the scan is performed more than 10 days after the originally scheduled date.
Typical Diagnostic Imaging Wait Times (U.S.)
| Imaging Type | Average Wait Time | Notes |
| MRI | 2–4+ weeks | Most backlogged; staffing and equipment limitations |
| CT Scan | Several days to 1–2 weeks | Faster than MRI, but it depends on the facility’s volume |
| X-Ray | Same day to 48 hours | Minimal wait; high throughput |
| MRI Results (Interpretation) | 1–2 weeks | Radiology staffing shortages slow reporting |
While CT and X-ray remain relatively quick, the MRI bottleneck impacts orthopedic surgery evaluations, neurological diagnoses, and cancer detection, making MRI wait times a critical access barrier.
Emergency Department Wait Times and Boarding
Emergency departments must treat patients immediately based on severity, not arrival order. However, the overall length of stay continues to rise as hospital bed shortages worsen.
The current median ED visit time is 163 minutes, which includes waiting, evaluation, treatment, and discharge or admission. This represents an ongoing upward trend tied to seasonal surges, staff shortages, and increased acuity in older patients.
More concerning is boarding, the time a patient waits in the ED after the decision to admit them.
Emergency Department Delays
| Metric | National Median / Typical Figure | Notes |
| Total ED visit length | 163 minutes | Includes treatment and discharge/admission |
| Boarding time (admitted patients) | 4+ hours for 25–35% of patients | Peaks in winter |
| Wait to see a provider | Varies from minutes to 1+ hours | Depends on triage category |
ED crowding is heavily influenced by hospital occupancy rates, which rise above 90 percent in many systems during peak months. When inpatient beds are unavailable, admitted patients remain in the ED, causing long delays for new arrivals.
Elective Surgery Wait Times in the U.S.

Elective surgery wait times are not tracked by a single national database, but surveys across insurers and hospital systems consistently show:
- Many U.S. patients wait longer than one month for non-urgent elective surgeries.
- About 30 percent report waits longer than four weeks from scheduling to procedure.
Procedures most affected include:
- Joint replacements (knee, hip)
- Cataract surgery
- Hernia repair
- Gastrointestinal procedures
- ENT surgeries
Wait times vary sharply by insurance type:
- Medicaid patients typically wait the longest, partly because fewer specialists accept Medicaid.
- Private insurance patients see shorter waits, especially in urban centers.
- Medicare beneficiaries fall in the middle, depending on the region.
Elective Surgery Wait Time Ranges
| Procedure Category | Typical Wait Time | Factors Influencing Delay |
| Orthopedic (knee/hip) | 3–6 weeks | Imaging bottlenecks, surgeon availability |
| Ophthalmology (cataract) | 3–8 weeks | High demand among older adults |
| GI Endoscopy | 4–6 weeks | Screening guidelines increase demand |
| General Surgery (hernia, gallbladder) | 2–5 weeks | Pre-op imaging wait times contribute |
Because elective care is capacity-dependent, certain hospitals with high surgical volume can reduce wait times dramatically, while smaller or rural hospitals experience chronic delays.
Why U.S. Wait Times Are Rising: Key System Factors
View this post on Instagram
Although the U.S. does not operate a universal wait-list system like Canada or the U.K., American wait times still rise due to structural bottlenecks.
Core Drivers
- Physician workforce shortages: projected deficit of up to 86,000 doctors by 2036.
- Aging population: More chronic disease increases specialty visits and imaging demand.
- Hospital consolidation: Fewer independent practices → fewer appointment openings.
- Radiology shortages: Both imaging acquisition and interpretation are bottlenecks.
- Seasonal surges: Flu, RSV, and COVID peaks overwhelm EDs.
Secondary Contributors
- Insurance authorization delays
- Outdated scheduling systems
- Limited MRI and CT machine availability in rural settings
Many health systems are now adopting automated scheduling and real-time patient intake platforms to reduce bottlenecks. Solutions such as Clearwave have gained traction because they streamline appointment booking, reduce no-show rates, and help organizations better manage high-demand specialties.
These tools do not eliminate workforce shortages, but they address the administrative delays that contribute to prolonged wait times.
Conclusion

The latest data shows that Americans experience significant waiting times for specialist appointments, MRI scans, emergency department care, and elective surgeries.
The U.S. system provides rapid critical care, but routine access is increasingly limited by physician shortages, imaging backlogs, and overcrowded hospitals.
With 31-day average appointment waits, 2–4 week MRI delays, and 163-minute emergency visits, the trend indicates a system pushed to capacity.