Minneapolis, a vibrant city in Minnesota, continues to experience fluctuations in its population growth.
In 2024, the population of the Minneapolis metro area has reached approximately 3,014,000, which marks a 0.8% increase from 2023.
Despite the overall increase, the city itself presents a slightly different picture.
The central population of Minneapolis is projected to be around 423,250, which shows a modest decline of roughly 0.44% annually according to World Population Review.
This contrasts with broader metropolitan growth and suggests shifting dynamics within the urban core.
Table of ContentsKey Takeaways
Historical Context of Population Growth in Minneapolis
Minneapolis has experienced varying rates of population growth over the years.
From 2000 to 2010, the city’s population increased slightly by 390 people, equating to a growth rate of 0.10%.
This period contrasts sharply with the national growth rate of 9.63% observed at the same time.
In recent years, the city’s population reached around 425,115 in 2025 as per biggestuscities.com.
However, recent data from World Population Review indicates a decline, with a current annual decreasing rate of -0.44%.
Between 2010 and 2020, the population fell by approximately 1.73%, dropping from 430,710 to 423,250.
Statewide, Minnesota has shown more consistent growth. According to USAFacts, the state population increased every year from 2010 to 2022, with the most significant rise—1.2%—occurring between 2019 and 2020.
The current metro area population of Minneapolis in 2025 is 3,014,000, a 0.8% increase from 2023 according to Macrotrends.
Age Distribution

The age distribution in Minneapolis reflects its dynamic and evolving population. In 2025, the city hosts a substantial percentage of young adults, with approximately 25% of the population between 18 and 34 years old.
A significant portion, about 20%, comprises children under 18. The working-age population (35 to 64 years) makes up roughly 40%, indicating a robust labor force. Seniors aged 65 and over account for around 15%, highlighting the city’s aging segment according to mncompass.org.
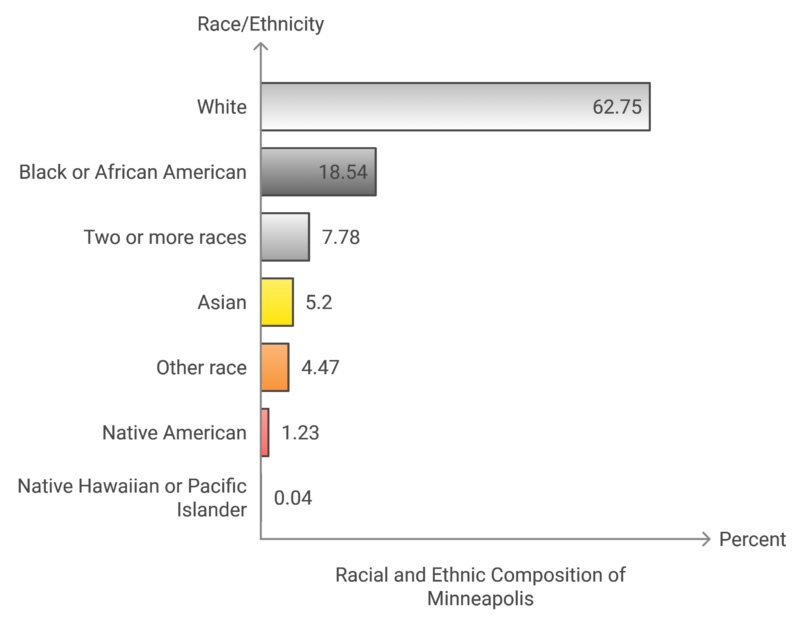
The ethnic diversity is significant, with whites comprising 62.75% of the population. The Black or African American community forms 18.54%, adding cultural richness to the city. Asians represent 5.20%, contributing to Minneapolis’s vibrant international character. Smaller groups include American Indian and Alaska Natives at 1.23%, and Native Hawaiian and Pacific Islanders at 0.04%. Multiracial residents make up 7.78%, while 4.47% identify as belonging to other races.
Age (2018-2022)
Count
Percent
Under 5 years
24,883
5.8%
5-9 years
23,220
5.4%
10-14 years
21,259
5.0%
15-17 years
12,314
2.9%
18-24 years
57,797
13.5%
25-34 years
92,299
21.6%
35-44 years
62,141
14.6%
45-54 years
44,303
10.4%
55-64 years
42,981
10.1%
65-74 years
29,474
6.9%
75-84 years
11,391
2.7%
85 years and older
4,815
1.1%
Ethnic and Racial Composition
Education Levels Among Residents
Economic Factors Influencing Population Growth
Category
Median Income
Average Income
Families
$109,514
$144,046
Households
$76,332
$108,980
Married Families
$137,613
$176,506
Non-Families
$58,035
$79,309
Analysis and Additional Information
The average household income in Minneapolis is $108,980, and the city has a poverty rate of 16.76%. These figures suggest a relatively high average income level compared to national standards, indicating a prosperous community. However, the significant poverty rate highlights income disparity within the city.
Married families have the highest income, with an average income of $176,506. This trend is typical in many cities, where combined incomes of working spouses tend to elevate household income levels.
Families, in general, show strong income figures, with an average of $144,046, which supports the observation that family households often have multiple income sources. Households, which include non-family living arrangements, show a lower average income of $108,980.
Non-family households, which may consist of single individuals or roommates, report significantly lower average earnings at $79,309. This discrepancy underscores the financial benefits of living in family units or married partnerships.
According to recent U.S. Census data, Minneapolis has shown economic growth over the past decade, with a rise in average household incomes reflecting overall prosperity.
However, income inequality remains a significant issue, with disparities often seen along racial and geographic lines within the city. The poverty rate of 16.76% is higher than the national average, highlighting areas within Minneapolis that may be underserved or struggling economically.
Programs aimed at addressing these inequalities include local government initiatives focusing on affordable housing, educational opportunities, and workforce development. These efforts are critical in closing the income gap and reducing poverty levels across different demographics in Minneapolis
Employment Opportunities
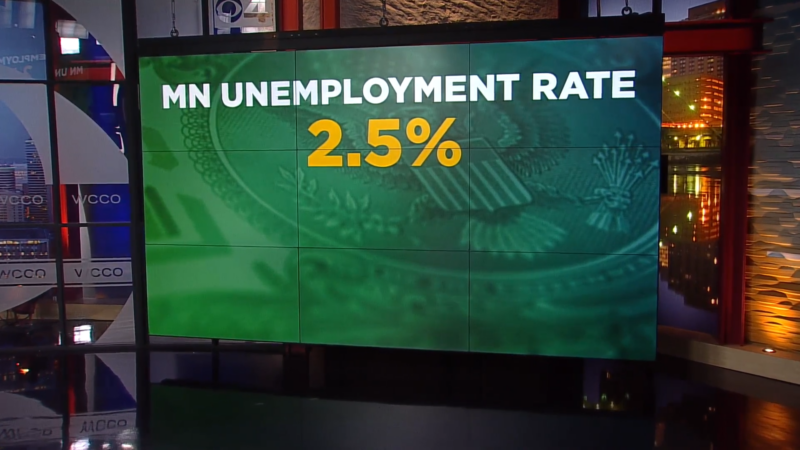
Minneapolis serves as a central hub for numerous industries including finance, healthcare, and education. Companies such as Target and Best Buy, headquartered in the city, contribute significantly to job creation. Additionally, the healthcare sector, led by institutions like the Mayo Clinic and UnitedHealth Group, provides extensive job opportunities.
Unemployment rates in Minneapolis tend to be lower than the national average around 19% according to Axios. This lower unemployment rate attracts talent from various regions. Robust job growth particularly in tech and healthcare sectors continues to draw individuals seeking stable employment and career advancement.
Housing Market Trends
Metric
Value
Median Home Price
$345,000
Average Home Price
$360,000
Home Price Increase (YoY)
3.2%
Median Rent
$1,600 per month
Rent Increase (YoY)
2.5%
Inventory Level
1.5 months of supply
Average Days on Market
20 days
Mortgage Rates (30-year)
6.5%
Homeownership Rate
53%
In 2024, the median home price in Minneapolis is approximately $345,000, with the average home price slightly higher at $360,000 according to Realtor. Home prices have shown a year-over-year increase of about 3.2%, reflecting steady demand despite broader economic uncertainties. This growth rate is slower compared to the post-pandemic surge observed in 2021 and 2022, but it still indicates a healthy market with potential for investment.
The rental market remains strong, with the median rent in Minneapolis at around $1,600 per month. Year-over-year, rents have increased by 2.5%, showing moderate growth. This is partly due to a growing population and the increasing demand for rental properties among young professionals and students.
The inventory of homes for sale is low, with only 1.5 months of supply available. A balanced market typically has about six months of supply, indicating that Minneapolis is currently a seller’s market.
Homes are selling relatively quickly, with the average time on the market being around 20 days. This quick turnover highlights the competitive nature of the market, where well-priced homes are in high demand.
The average 30-year mortgage rate in Minneapolis is about 6.5% as per Bankrate. Although higher than the historically low rates of the past few years, these rates are still within a manageable range for many buyers. However, higher mortgage rates can impact affordability, especially for first-time buyers, contributing to the ongoing rental demand.
The homeownership rate in Minneapolis stands at 53%, slightly lower than the national average. This reflects a diverse market with both a strong rental presence and a significant proportion of homeowners. Factors such as affordability challenges and lifestyle preferences are driving the rental market, especially among younger demographics.
Cost of Living Comparisons

When comparing the cost of living in Minneapolis to other large cities, it remains relatively reasonable. Basic necessities such as groceries, transportation, and healthcare generally cost less than in cities like San Francisco or New York.
Category
Compared to State Average
Compared to National Average
Housing
1% higher
14% lower
Utilities
1% lower
5% lower
Food
1% lower
1% lower
Healthcare
7% lower
1% higher
Transportation
0%
3% lower
Goods & Services
5% lower
5% lower
The cost of living in Minneapolis is slightly lower than both the state and national averages, except for housing, which is 1% higher than the state average but 14% cheaper than the national average.
Healthcare is 1% more expensive than the national average, though overall, Minneapolis offers a relatively affordable cost of living, particularly in utilities and goods/services according to RentCafe.
Housing Costs in Minneapolis
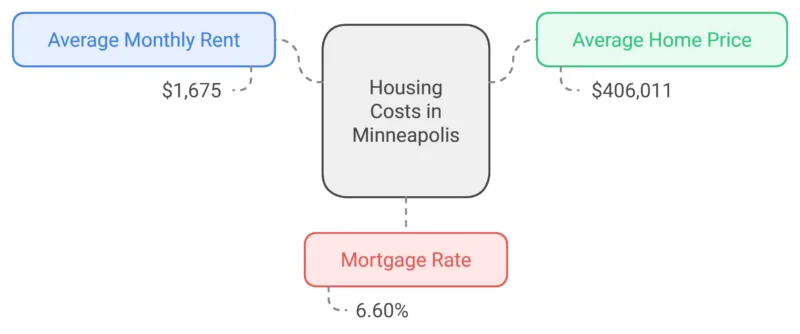
Housing remains a significant expense for Minneapolis residents. With an average rent of $1,675 and home prices averaging $406,011, the market presents affordable options compared to the national average, especially for buyers. Mortgage rates are 6.60%, reflecting the current market conditions that may influence homeownership decisions.
Utility Costs
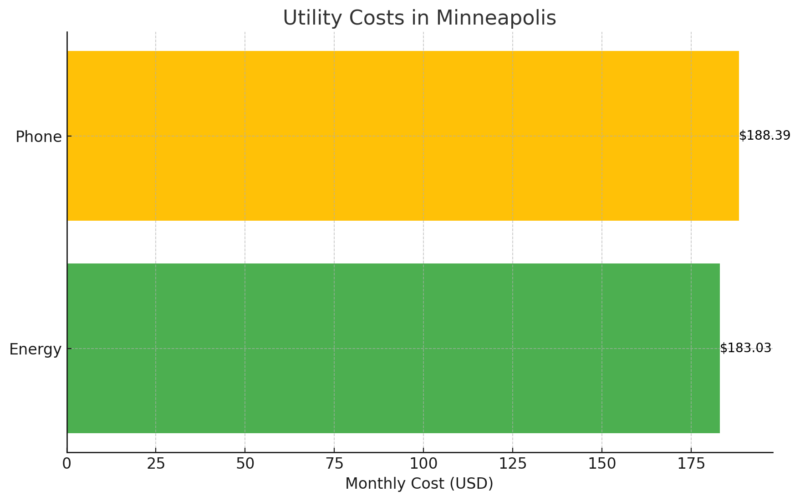
Monthly utility expenses in Minneapolis are moderate, with energy bills averaging $183.03. Phone service costs around $188.39 per month. These rates are relatively low compared to other major cities, adding to the affordability of living in Minneapolis.
Food Costs in Minneapolis
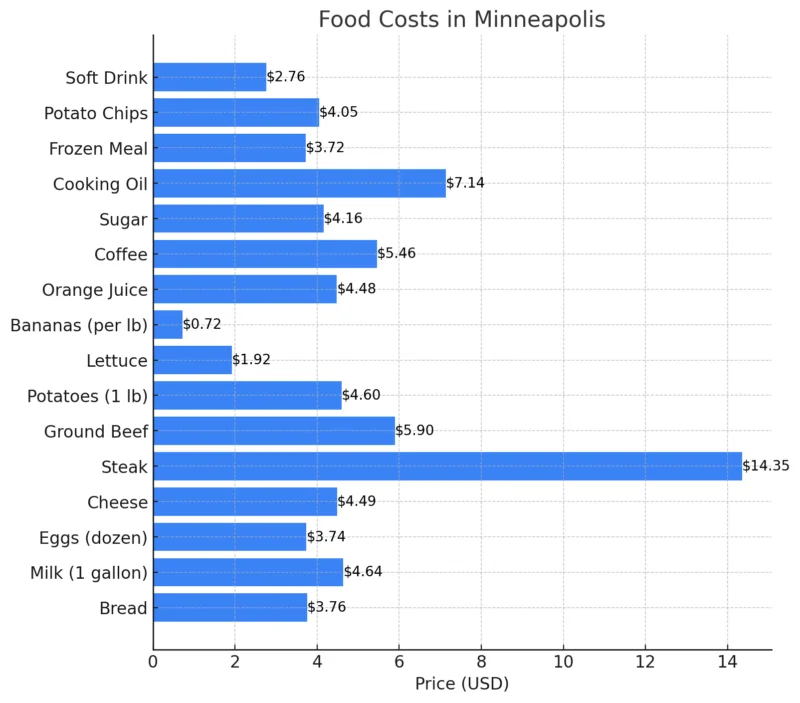
Grocery prices in Minneapolis are comparable to the national averages, with essentials like bread, milk, and eggs priced fairly. While items like steak are relatively pricey at $14.35 per pound, other staples, such as bananas and lettuce, offer affordable options, keeping food costs reasonable for families.
Crime Rate
Crime Type
Number of Crimes
Crime Rate (per 1,000 residents)
National Rate (per 1,000 residents)
Total Crimes
28,177
66.28
N/A
Violent Crimes
5,293
12.45
N/A
Property Crimes
22,884
53.83
N/A
Minneapolis experiences a high crime rate compared to national and state averages. The total crime rate of 66.28 per 1,000 residents is concerning, making the city safer than only 1% of U.S. cities. Violent crimes account for 12.45 per 1,000 residents, and property crimes are particularly high at 53.83 per 1,000 as per Neighborhood Scout.
Violent Crimes in Minneapolis vs. National Data
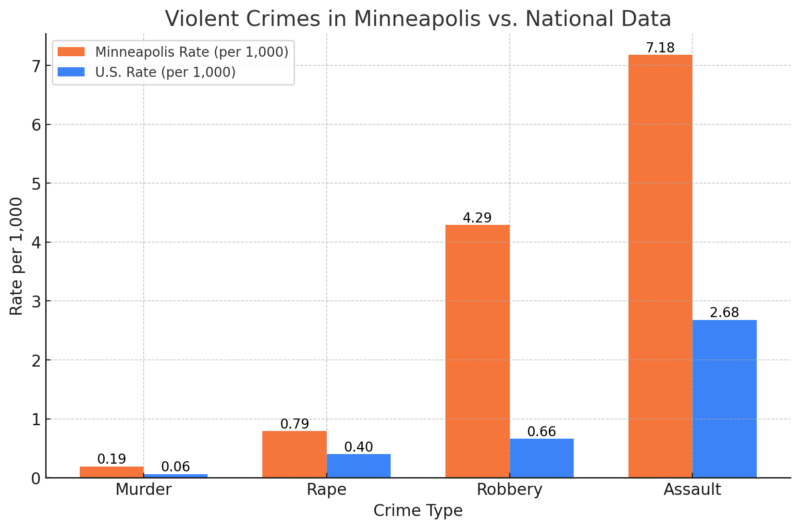
Minneapolis has a significantly higher rate of violent crimes across all categories compared to national averages. The robbery rate is 4.29 per 1,000 residents, which is over six times higher than the U.S. average. Assaults are also notably elevated, at 7.18 per 1,000 residents, compared to the national rate of 2.68.
Property Crimes in Minneapolis vs. National Data
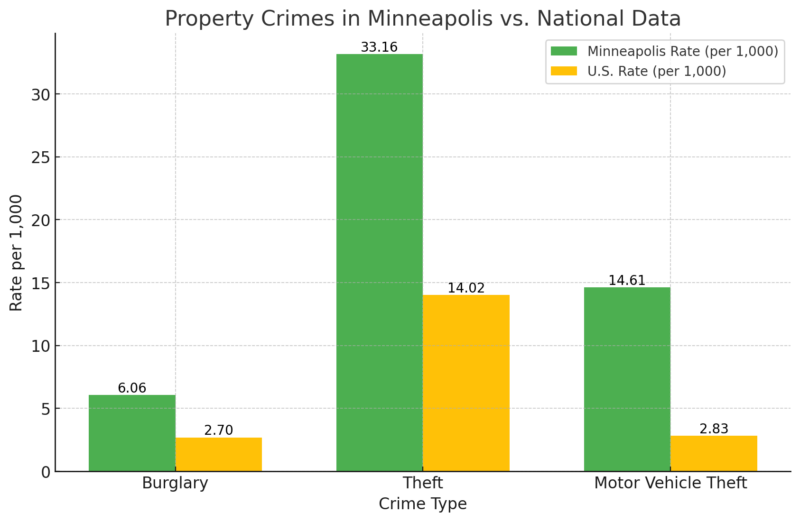
Property crime rates in Minneapolis are considerably higher than national averages. The theft rate is particularly alarming at 33.16 per 1,000 residents, more than double the U.S. rate of 14.02. Motor vehicle thefts are also disproportionately high, with a rate of 14.61 compared to the national rate of 2.83 per 1,000.
Crime Rate Comparison (Minneapolis vs. Minnesota)
Crime Type
Minneapolis Rate (per 1,000)
Minnesota Rate (per 1,000)
Violent Crime
12.45
2.81
Property Crime
53.83
19.60
Chances of Being a Victim (Violent)
1 in 80
1 in 356
Chances of Being a Victim (Property)
1 in 19
1 in 51
The crime rates in Minneapolis far exceed those of the state of Minnesota. Residents of Minneapolis have a 1 in 80 chance of being a victim of a violent crime, compared to 1 in 356 in the state. Property crimes are also much more prevalent, with a 1 in 19 chance in Minneapolis, versus 1 in 51 across the state.
Urban Development and Land Use
The city of Minneapolis has accelerated residential development projects to address housing demand. Innovations in zoning regulations have allowed for higher-density housing, particularly with the adoption of the Minneapolis 2040 plan.
This plan paves the way for mixed-use developments that integrate residential properties with commercial spaces. Efforts to build affordable housing are also visible, as developers are incentivized to include low-income housing units in new projects.
Renovating older neighborhoods has been another focus, aiming to preserve the city’s historic charm while providing modern amenities. This holistic approach seeks to create inclusive communities that cater to diverse populations.
Commercial and Industrial Growth

Commercial and industrial growth in Minneapolis is buoyed by various strategic initiatives. The city has seen a rise in tech hubs and office spaces, partly driven by zoning changes that make it easier to set up new businesses.
The North Loop area, known for its warehouse conversions, has become a vibrant commercial zone attracting startups and established firms alike. Additionally, the Minneapolis Land Use Reforms have played a key role in stabilizing rent prices, making it an attractive destination for businesses.
Industrial zones are also expanding, with the city supporting developments in the manufacturing and logistics sectors. These efforts aim to create job opportunities and drive economic growth, ensuring Minneapolis remains a resilient urban center.
Government Policies and Population Growth
Government policies play a significant role in shaping population growth dynamics in Minneapolis. Key areas of focus include zoning and urban planning initiatives, immigration and residency policies, as well as sustainability and environmental regulations.
Zoning and Urban Planning Initiatives
Zoning and urban planning initiatives in Minneapolis have been critical in managing population growth. The city has implemented mixed-use zoning to encourage both residential and commercial development in the same areas. This approach promotes higher-density living, which can support a growing population without expanding the urban footprint.
The 2040 Comprehensive Plan emphasizes affordable housing. Policies aim to eliminate single-family zoning, allowing multifamily units like duplexes and triplexes in areas previously limited to single-family homes. This change is designed to increase housing availability and affordability.
Transportation infrastructure also plays a part. Projects like the Southwest Light Rail Transit Line aim to connect more residents to job centers and other cities. These initiatives collectively aim to balance growth with quality of life by addressing housing and transportation needs comprehensively.
Immigration and Residency Policies
Immigration policies significantly impact Minneapolis’s population composition and growth. The city’s welcoming stance toward immigrants has bolstered its population, contributing to cultural and economic vitality. Local government collaborates with organizations to offer resources such as legal assistance and language services to newcomers.
Minneapolis has established itself as a sanctuary city, providing protections for undocumented immigrants. This status means local law enforcement agencies limit their cooperation with federal immigration authorities, fostering a more inclusive environment for all residents.
Sustainability and Environmental Regulations

Sustainability and environmental regulations in Minneapolis aim to ensure long-term growth is aligned with environmental stewardship. The city’s climate action plan seeks to reduce greenhouse gas emissions by promoting renewable energy sources and improving energy efficiency in buildings.
Regulations also focus on preserving green spaces and enhancing urban biodiversity. Initiatives include the implementation of green roofs and extensive tree-planting programs. These efforts not only contribute to environmental sustainability but also improve the quality of life for residents.
Water management policies are another key area. Minneapolis has implemented strict regulations to protect its lakes and rivers from pollution. Programs promoting rain gardens and permeable pavements help manage stormwater runoff, reducing the impact on natural water bodies.
These policies ensure the city’s growth does not come at the expense of its environmental health, thereby supporting a sustainable future for Minneapolis.
Social and Cultural Impact of Population Increase

The population increase will make Minneapolis a more diverse city. According to projections, close to four in ten residents will be from Black, Asian, or Latino communities by 2040, up from 28% in 2020. This growing diversity will bring richer cultural experiences and opportunities for community engagement.
Local organizations and community centers will likely expand programs to include cultural festivals, language classes, and diversity training. This will help foster mutual respect and understanding among residents. Residents will have more opportunities to engage in various cultural experiences, making the city a vibrant and inclusive place.
Healthcare Services Adaptation
Healthcare services will need to adapt to meet the needs of a growing and diverse population. The aging population, projected to account for a quarter of the city’s residents by 2050, will require more specialized geriatric care according to findings.
Primary care facilities and hospitals will need to increase capacity, employing additional healthcare professionals to serve a larger community. Culturally competent care will become a focus, with healthcare providers offering services in multiple languages and understanding cultural differences in healthcare practices.
Community health programs will also promote health literacy and preventive care among diverse populations, ensuring equitable access to healthcare.
Methodology
This article was crafted using a combination of population data from reliable sources like World Population Review and USAFacts.
We analyzed age distribution, racial composition, and economic factors using census data.
Housing trends were gathered from Realtor data, and insights into urban planning were based on Minneapolis’s 2040 plan and government policies.
Conclusion

Minneapolis, home to a diverse population, reached 423,250 residents in 2024. This city, firmly located in Hennepin County, has seen various shifts in population trends over the past decade.
Minneapolis experienced a population increase of 6.23% between 2013 and 2023, with a peak in 2020 at 430,710 residents. Yet, recent data indicates a slight annual decline rate of -0.44% since 2020.
Factors such as natural population growth and migration patterns contribute to these trends. In addition to natural increases, the dynamics of the Twin Cities metro area are shaped by policies and planning orchestrated by the Metropolitan Council.
Understanding these patterns and their implications is crucial for future urban planning and development within Minneapolis. The focus remains on balancing growth with the necessary infrastructure and services to support the city’s residents.
References
- World Population Review – Minneapolis Population 2024
- Biggestuscities.com – Minneapolis Population History 1880 – 2023
- Macrotrends – Minneapolis Metro Area Population 1950-2024
- Mncompass.org – Minneapolis, population by age group
- Census.gov – Income in the United States: 2022
- Realtor.com – Minneapolis, MN
- Rentcafe.com – Cost of Living in Minneapolis, MN
- Neighborhoodscout – Minneapolis, MN Crime Rates
- Minneapolis2040.com – Land Use & Built Form
- Pewtrusts.org – Minneapolis Land Use Reforms Offer a Blueprint for Housing Affordability
- Axios – How the Twin Cities’ population will change
- Startribune.com – What will Twin Cities area look like in 2050? Larger, older and more diverse
Related Posts:
- Closer Look at Population of Pennsylvania in 2025
- Closer Look at New Jersey’s Population Data in 2025
- Closer Look at Ohio’s Population Data for 2025
- Texas Population in 2025 - Closer Look at The Demographics
- Teen Depression Statistics in the US - A Closer Look…
- Nebraska Population Statistics for 2025 - An In-Depth Look


