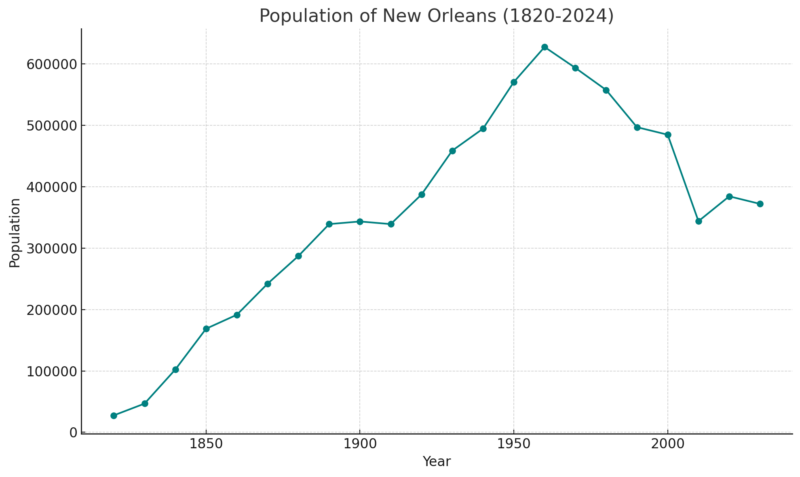
As of 2025, New Orleans population stands at 357,767, continuing a decline that has seen its numbers decrease by 6.65% since the 2020 census according to World Population Review.
In the 2020 census it had 383,997 people living there.
This ongoing trend raises critical questions about the socio-economic factors contributing to the population loss.
Examining data from recent years, it becomes clear that the city has consistently seen a drop in residents. In 2023, the population was recorded at 364,136, marking a 1.56% decrease from the previous year.
Such data indicate a broader, more sustained trend rather than an isolated anomaly.
Various factors are influencing this decline, including economic challenges and natural disasters, which have historically affected the region.
Table of Contents
Toggle2025 Population Data
In 2025, the metro area has achieved a New Orleans population of 1,237,748 residents according to the data research center. This marks a slight increase of 0.79% from the previous year.
Income statistics show that the average household income in New Orleans stands at $84,158, highlighting economic conditions amid population changes.
Historical Population Context
New Orleans has seen significant shifts in its population over the decades. In 2020, the population was recorded at 383,241.
By 2023, this had dropped to 364,136 according to Neilsberg.
The broader metro area has shown relatively steadier trends, currently holding 93% of its 2000 population of 1,337,726.
Comparing year-to-year, the data shows a mix of modest growth in the metro area and a noticeable decline within the city limits, underscoring varying regional dynamics.
A timeline of key historical population numbers:
- 1960: Over 620,000 residents
- 1980: Approximately 557,000 residents
- 2005: Pre-Katrina population near 455,000
- 2010: Post-Katrina recovery, population around 343,000
Key demographic data for New Orleans in 2025 includes:
- Population density: 2,181.4 people per square mile
- Total area: 169.5 square miles
- Average household income: $84,158
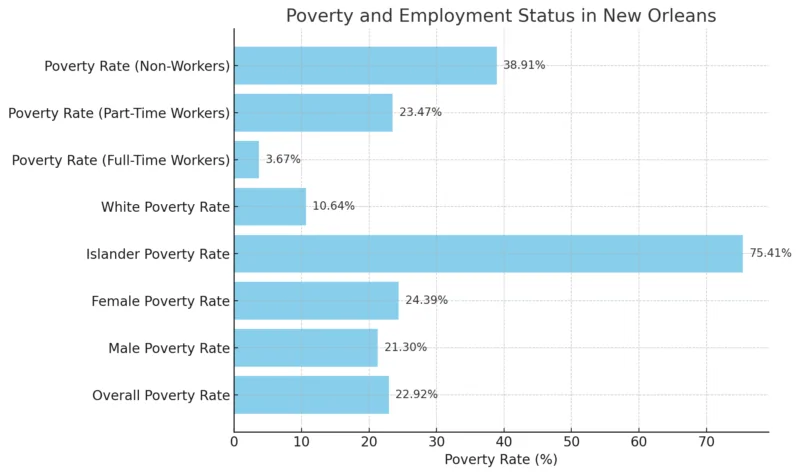
- Poverty rate: 22.92%
Demographic Analysis

The median age in New Orleans is 37.9 years, with a slight difference between genders. The median age for males is 37.3 years, while for females, it is slightly higher at 38.6 years according to Axios. The city has a total of 305,680 adults, of which 60,419 are seniors, highlighting a significant elderly population.
New Orleans has an overall age dependency ratio of 55.1. This means that there are approximately 55 dependents (children and seniors) for every 100 working-age adults.
Breaking this down, the old-age dependency ratio is 24.6, indicating that for every 100 working-age adults, there are about 25 seniors. The child dependency ratio is 30.5, meaning there are about 31 children for every 100 working-age adults.
The population of New Orleans shows a higher percentage of females than males. Females make up 52.76% of the population, totaling 200,720, while males account for 47.24%, totaling 179,688.
Category
Value
Median Age (Total)
37.9 years
Median Age (Male)
37.3 years
Median Age (Female)
38.6 years
Total Adults
305,680
Seniors (Age 65+)
60,419
Age Dependency Ratio (Total)
55.1
Old Age Dependency Ratio
24.6
Child Dependency Ratio
30.5
Female Population
200,720 (52.76%)
Male Population
179,688 (47.24%)
Diversity and Religion
In 2006, estimates suggested there were between 10,000 and 14,000 undocumented immigrants in New Orleans, mainly from Mexico. Janet Murguia, president of the National Council of La Raza, mentioned that the city could have around 120,000 Hispanic workers.
Over the past decade, New Orleans has grown more diverse, with the Latino population in the metro area increasing by 69% from 2000 to 2012, outpacing the national growth rate of 50%.
New Orleans’ French and Spanish colonial roots have left a strong Catholic influence, making Catholicism the dominant religion, with 35.9% of the population identifying as Roman Catholic.
The city also has a presence of Louisiana Voodoo, which blends African and Afro-Caribbean practices with Catholic beliefs. Although the tourism industry often highlights Voodoo, true practitioners in New Orleans are quite rare according to World Population Review.
Ethnic and Racial Composition
New Orleans is renowned for its rich cultural tapestry, mirrored in its ethnic and racial composition. The city’s population predominantly consists of African Americans, who form a slight majority. This demographic plays a crucial role in shaping the city’s culture, politics, and community life.
Whites represent a significant portion, contributing to the city’s diverse heritage. Hispanic and Latino communities, though smaller, are growing, adding new cultural influences and economic contributions.
Other ethnic groups, including Asians and Native Americans, also reside in the city, enriching its multicultural identity. This diversity influences various sectors, from cuisine and festivals to business and educational initiatives.
One significant factor behind New Orleans’ population decline is its economy. The city’s job market has faced challenges, leading to lower employment opportunities. Many industries, particularly those related to tourism and hospitality, were severely impacted by the COVID-19 pandemic. Moreover, New Orleans’ economic recovery has been slower compared to other metropolitan areas. Businesses have struggled to reopen or sustain operations, contributing to higher unemployment rates. The lack of economic growth has caused many residents to seek opportunities elsewhere. Emigration is especially common among younger professionals looking for stable jobs and career progression. These economic difficulties form a primary driver for the population loss in New Orleans. New Orleans has an overall poverty rate of 22.92%, with notable differences between genders as per World Population Review. The poverty rate for males is 21.3%, while it is higher for females, at 24.39%. Environmental issues also play a crucial role in the population decline. New Orleans is highly vulnerable to natural disasters, particularly hurricanes. Recurrent storms cause extensive damage to infrastructure, homes, and businesses, leading to displacement. Hurricane Katrina in 2005 was a turning point, resulting in a mass exodus from the city. Although recovery efforts have been ongoing, the city’s aging infrastructure remains susceptible to future storms and flooding as stated by World Vision. Public safety remains a concern, with crime rates higher than the national average. Issues like violent crime and property crimes create a perception of insecurity, further driving people away. Education quality is another concern influencing family decisions to relocate. Many parents prefer to move to areas with better school systems for their children’s future according to costar.com. Political challenges, including issues with governance and public policy, contribute to a lack of confidence in the city’s leadership. Discontent with local government can deter residents from staying or attract new ones. These combined social and political factors create a challenging living environment, impacting New Orleans’ ability to retain its population. New Orleans population has been declining steadily. In 2023, it saw a 1.56% drop from the previous year, bringing the total to 364,136. This stands in stark contrast to cities like Austin, Texas, which keeps experiencing growth. Factors contributing to these differences include economic opportunities and natural disasters. Cities with a population of at least 500,000 residents have generally shown mixed trends. While New Orleans experienced a notable 4.3% loss in the last three years, the nation’s population overall increased by 1%. Other cities like Detroit have experienced similar declines, largely due to economic downturns and urban flight. Understanding how New Orleans compares with other cities helps to pinpoint key challenges and potential areas of improvement. Projections indicate that the New Orleans population will continue to experience population decline if current trends persist. In 2023, the population was 364,136, reflecting a 1.56% decrease from the previous year. This followed similar declines in 2022 and 2021. The projected population for 2025 is 401,182. Factors such as migration, economic opportunities, and environmental concerns play significant roles in these trends. Accurate forecasting requires analyzing historical data and considering current socio-economic conditions. The New Orleans metro area saw a 4.3% population loss over the past three years. Efforts must be concentrated on understanding and mitigating the factors contributing to this decline. Addressing the population decline in New Orleans requires a multi-faceted approach. Economic revitalization is crucial, focusing on job creation in diverse sectors to attract and retain residents. Enhancing education and healthcare infrastructure will improve quality of life. Investments in resilient infrastructure can mitigate the impacts of natural disasters, a significant factor in population shifts. Policies encouraging affordable housing can help stabilize the population. Promoting cultural and tourism industries, given New Orleans’ rich heritage, can also foster growth. The continuing recovery post-Katrina shows the potential for resilient and sustainable growth when communities are supported effectively. Nations, projecting efforts include inclusive planning and engaging local communities to ensure long-term success. This article was crafted using a combination of the most recent population and socio-economic data for New Orleans, including information from reputable sources like the 2020 Census, World Population Review, Neilsberg, and Axios. We also analyzed historical population trends and socio-economic factors such as income, poverty rates, and employment statistics. Demographic analysis was conducted using median age, dependency ratios, and gender distribution data, which helped provide insight into the shifting dynamics of the population. Economic influences, such as income levels, poverty rates, and the impact of natural disasters, were also examined to identify factors contributing to the ongoing population decline. Additionally, a comparative analysis with other U.S. cities, including those experiencing growth and decline, was utilized to understand how New Orleans’ trends fit into a broader national context. Finally, we used authoritative studies on poverty, migration, and environmental impacts to propose potential strategies for sustainable population growth. New Orleans population has experienced notable changes over recent years. In 2025, the population stands at 357,767, showing a decline from the previous year. The population data over the past few years indicate a downward trend. For instance, in 2023, the city’s population was 364,136, decreasing by 1.56% from 2022. The metropolitan area has also seen a significant decrease. As of July 2023, there were 1,237,748 residents in metro New Orleans, reflecting a 3% decline since April 2020. Several factors contribute to these trends, including economic shifts and natural disasters. Notably, post-Katrina recovery spurred growth earlier in the decade with the city’s population growing to 383,997 in 2020 from 343,829 in 2010 according to research. Similarly, Illinois has faced population challenges, particularly in Chicago, where outmigration and economic factors have influenced demographic shifts in recent years. The population decrease is not only a local issue. New Orleans’ metro area recorded the largest population drop among U.S. cities with over 500,000 residents, witnessing a 4.3% decrease over the past three years. This decline contrasts with a nationwide population increase of 1%. Plans and policies will need to address these demographic changes to support New Orleans’ growth and sustainability. The complexity of population dynamics in New Orleans requires continuous monitoring and targeted interventions to manage and potentially reverse these trends.
Race or Ethnicity
Population
Percentage
Black or African American
216,866
57.01%
White
123,390
32.44%
Two or more races
20,186
5.31%
Asian
10,680
2.81%
Other race
8,407
2.21%
Native American
818
0.22%
Native Hawaiian or Pacific Islander
61
0.02%
Racial Disparities in Poverty
Poverty and Employment Status
Income
Household Type
Median Income (2020)
Median Income (2023)
Families
$73,549
$114,432
Households
$51,116
$84,158
Married Families
$113,055
$156,680
Non-Families
$34,587
$55,630
Environmental Challenges
Social and Political Factors
Comparison with Other U.S. Cities
Future Projections and Recommendations
Strategies for Sustainable Growth
Methodology
Conclusion
References
Related Posts:


