New York City, located in New York County, New York, is one of the most iconic and populous cities in the United States.
As of 2025, the city has an estimated population of 8,097,282.
However, according to the World Population Review, New York City is currently experiencing a population decline, with an annual decrease rate of -1.95%.
Since the 2020 Census, which recorded a population of 8,740,292, the city has seen a total decrease of -7.36% in its population.
Key Takeaways
Age Distribution Across NYC and Boroughs
Age Group
NYC (%)
Manhattan (%)
Bronx (%)
Brooklyn (%)
Queens (%)
Staten Island (%)
Under 5 years
6.06%
4.7%
7.1%
7.1%
6.1%
5.3%
5 to 9 years
5.48%
3.7%
6.3%
5.9%
5.2%
6.3%
10 to 14 years
5.82%
3.8%
7.3%
6.2%
5.6%
6.2%
15 to 19 years
5.46%
4.2%
6.6%
5.3%
5.1%
6.1%
20 to 24 years
6.28%
6.8%
7.0%
6.0%
5.6%
6.0%
25 to 29 years
8.80%
11.5%
8.4%
9.2%
8.0%
6.9%
30 to 34 years
8.38%
10.7%
7.6%
9.1%
8.0%
6.5%
35 to 39 years
7.06%
7.8%
6.4%
7.5%
7.0%
6.6%
40 to 44 years
6.42%
6.6%
6.4%
6.5%
6.6%
6.0%
45 to 49 years
6.26%
6.1%
6.0%
5.9%
6.6%
6.7%
50 to 54 years
6.26%
5.9%
6.3%
5.6%
6.7%
6.8%
55 to 59 years
6.40%
5.8%
6.0%
5.5%
7.2%
7.5%
60 to 64 years
5.84%
5.5%
5.4%
5.7%
6.2%
6.4%
65 to 69 years
4.80%
4.8%
4.1%
4.4%
5.1%
5.6%
70 to 74 years
3.96%
4.3%
3.3%
3.8%
4.1%
4.3%
75 to 79 years
2.76%
3.1%
2.5%
2.5%
2.8%
2.9%
80 to 84 years
1.96%
2.4%
1.7%
1.8%
2.1%
1.8%
85 years and over
2.06%
2.4%
1.7%
1.8%
2.3%
2.1%
Younger age groups (Under 5 years to 14 years) are more prevalent in the Bronx and Brooklyn compared to Manhattan and Staten Island as noted by Baruch.
Manhattan has the highest percentage of residents aged 25 to 34 years, indicating its appeal to younger working-age adults.
Staten Island and Queens have a higher proportion of older adults (aged 65 years and above) compared to other boroughs.
Median age is highest in Staten Island (40.0 years) and Queens (39.7 years), while the Bronx has the youngest median age (34.8 years).
Population Distribution by Borough and Sex
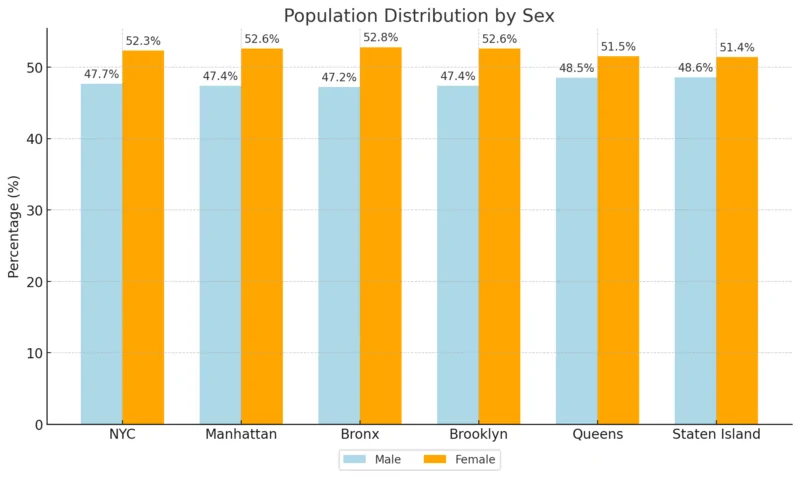
The overall sex ratio in NYC shows a slightly higher percentage of females (52.3%) compared to males (47.7%).
Queens and Staten Island have the highest proportion of males among all boroughs (48.5% and 48.6% respectively).
Manhattan, Bronx, and Brooklyn display a consistent distribution of males (around 47.4%) and females (52.6%).
Population Distribution by Race in NYC
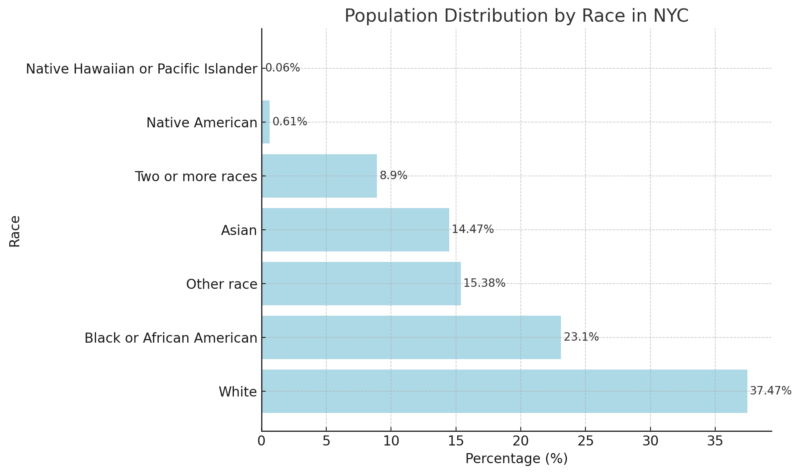
The majority of NYC’s population identifies as White, accounting for 37.47%.
Black or African American residents make up the second-largest racial group, representing 23.1% of the population.
Individuals identifying as Asian comprise 14.47% of the population, while those of Other Race account for 15.38%.
Smaller proportions are observed among Native Americans (0.61%) and Native Hawaiians or Pacific Islanders (0.06%), reflecting NYC’s diverse yet uneven racial distribution.
Trends in NYC Home Prices and Inventory
Year
Median Sales Price
Inventory
2010
$450,000
14,690
2015
$549,000
13,905
2020
$675,000
17,122
2022
$782,000
15,073
2023
$764,000
14,403
2024
$785,000
14,740
Over the years, NYC’s median home price has steadily increased, rising from $450,000 in 2010 to $785,000 in 2024, reflecting the city’s resilient property market. However, this increase is modest compared to the national average price growth of 42% since the pandemic according to the Comptroller.
Housing inventory has steadily declined, reaching a seven-year low in 2023. The “housing lock” effect, driven by low locked-in mortgage rates, has deterred homeowners from selling, further limiting inventory and keeping prices high.
The steady price increase and reduced inventory exacerbate affordability challenges, particularly for middle-income households, making home purchases increasingly difficult.
Homeownership and Housing Stock Profile 2025
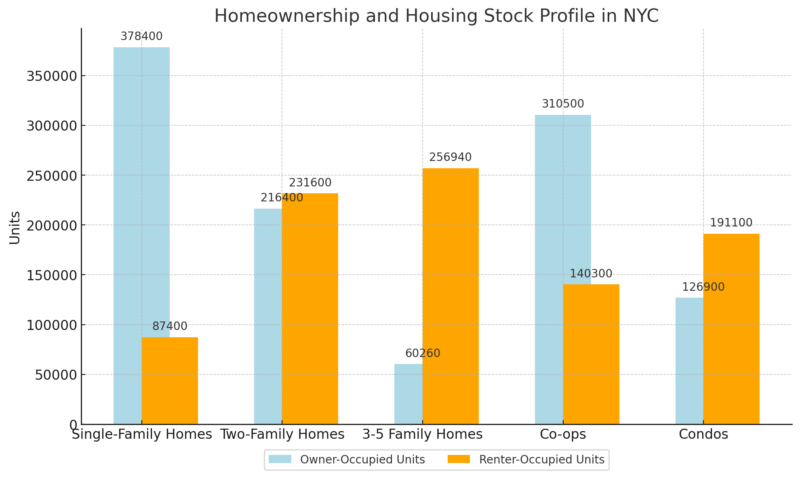
Single-family homes form the largest share of owner-occupied housing (81%). Two-family homes also play a critical role in NYC’s housing landscape, with many homeowners renting out one unit for supplemental income.
Renters occupy a significant proportion of housing traditionally considered owner-occupied, such as single-family homes (19%) and condos (60%). This reflects the dual use of these properties, especially as investment assets in a high-demand rental market.
Co-ops dominate the ownership market, likely due to their historical prevalence in NYC. However, condos, with higher renter occupancy, suggest they are increasingly viewed as investment opportunities rather than primary residences.
Homeownership Rates by Race
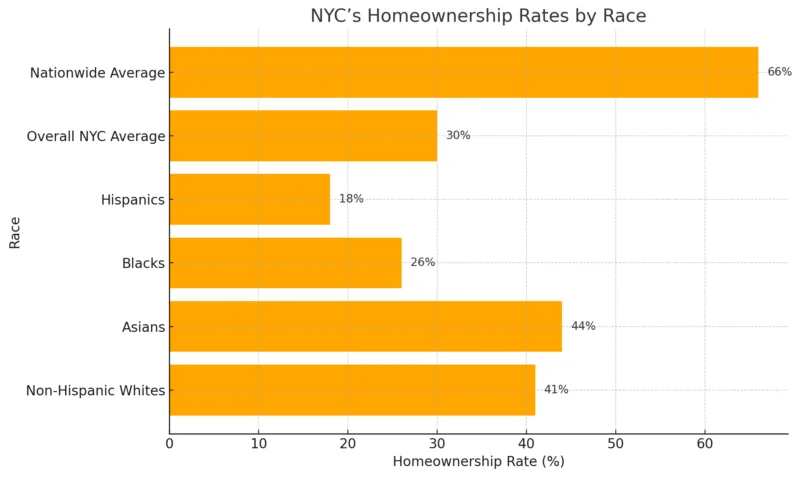
NYC’s homeownership rate (30%) is less than half the national average (66%), indicating systemic challenges such as high property prices and limited affordability.
Significant gaps exist in homeownership rates among racial groups. Non-Hispanic Whites and Asians have relatively higher rates (41% and 44%), while Black and Hispanic households face stark disparities (26% and 18%). This disparity reflects barriers such as income inequality, credit access issues, and historical housing discrimination.
Education and Health Statistics for NYC
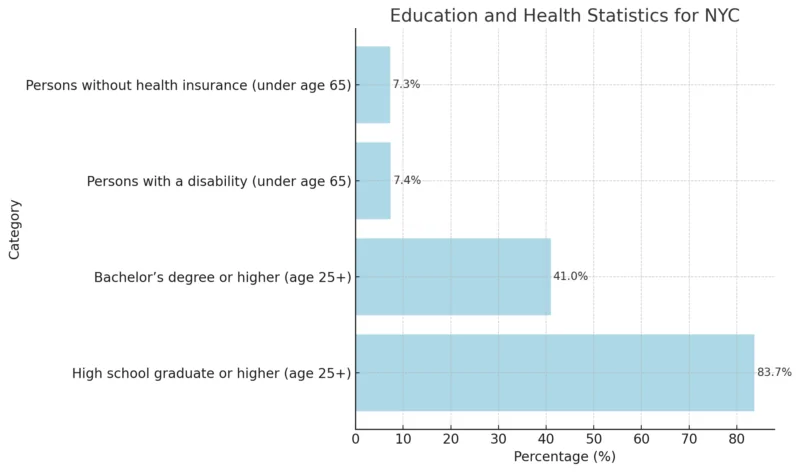
Education Levels
- A majority (83.7%) of NYC residents aged 25 and older have completed high school or higher education, reflecting a strong baseline of educational attainment according to the US Census.
- However, only 41.0% of the same demographic have a bachelor’s degree or higher, indicating potential gaps in higher education access or attainment, particularly when compared to national urban centers with similar economic dynamics.
Health Indicators
- The percentage of persons with a disability under age 65 (7.4%) highlights a moderate prevalence of disabilities within the population, necessitating inclusive healthcare and workplace policies.
- The proportion of uninsured individuals under 65 years (7.3%) is relatively low, suggesting that healthcare access has improved, potentially due to Medicaid expansion and public health initiatives. However, challenges remain in ensuring universal coverage, particularly for low-income and undocumented populations.
NYC Employment 2025
Category
Value
Private Sector Employment
3,906,900 jobs
Monthly Growth (May 2022)
+13,800 jobs
Year-over-Year Growth
+8.4%
Jobs Recovered (April 2020)
745,500 jobs (78.7% regained)
Unemployment Rate
6.2%
Labor Force Participation
59.9%
NYC Economics noted that the city has regained 78.7% of the jobs lost during the early pandemic, with 745,500 jobs recovered out of 946,900. However, sectors like Accommodation and Food Services and Retail remain below pre-pandemic levels, reflecting uneven recovery.
While the participation rate increased to 59.9%, it still lags behind its pandemic-era high of 60.0% in June 2021. This indicates a gradual recovery but highlights the persistent impact of pandemic disruptions.
The unemployment rate of 6.2% shows improvement but remains significantly higher than the pre-pandemic rate of 3.7%, reflecting ongoing challenges in achieving full economic recovery.
Developments in New York and New York City Employment Law: What Employers Need To Know Going Into 2025 https://t.co/T05TppRnQi
— Wage and Hour (@WageHourLaws) December 24, 2024
NYC Employment by Industry
Industry
Jobs Regained
Percent of Lost Jobs Regained
Job Change (Pre-Pandemic to May 2022)
Information
44,200
124.2%
+8,600
Professional & Business
87,300
93.5%
-6,000
Accommodation & Food
203,600
75.8%
-65,100
Retail
76,700
66.1%
-39,200
Healthcare & Social Assistance
135,000
116.3%
+18,900
Government
2,500
11.4%
-19,500
Information Services led recovery, regaining 124.2% of the jobs lost during the pandemic, showcasing its resilience and expansion during a period of digital transformation.
Accommodation and Food Services and Retail still face significant deficits, with 75.8% and 66.1% of jobs regained, respectively. This reflects ongoing challenges in sectors dependent on tourism and in-person consumption.
Healthcare and Social Assistance exceeded pre-pandemic employment levels, indicating robust demand for health-related services during and after the pandemic.
Comparison of Employment Recovery Across Major Metro Areas
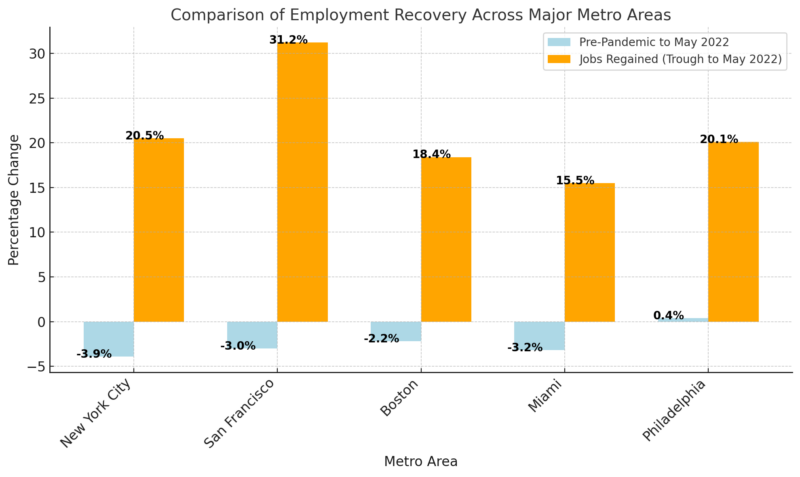
NYC’s employment rate is still 3.9% below pre-pandemic levels, performing worse than that of areas like Philadelphia (+0.4%) but recovering faster (+20.5%) compared to most metro areas.
San Francisco experienced the highest recovery rate (+31.2%), reflecting its tech-driven economy’s rapid adaptation during and after the pandemic.
The disparities in recovery rates across cities highlight the varying economic compositions and resilience of industries during the recovery period.
Median Household Income in New York
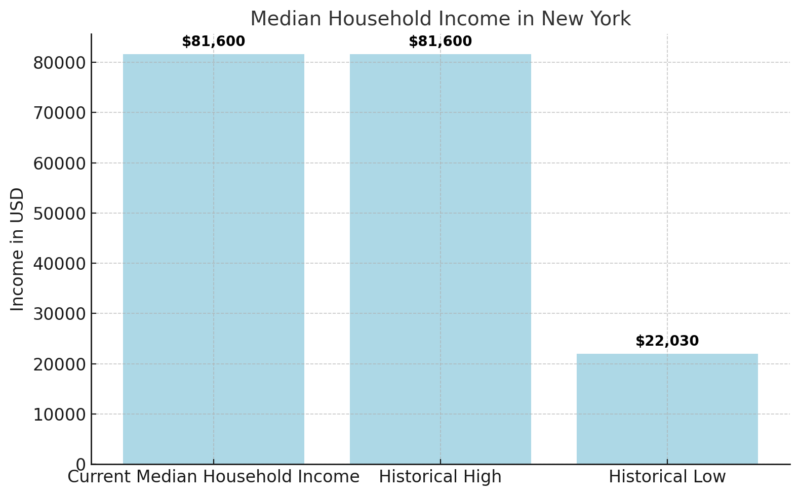
As of January 2023, the median household income in New York reached a record high of $81,600. This reflects significant growth in household earning potential over time, attributed to rising wages, economic development, and urbanization according to Trading Economics.
The lowest recorded median household income in New York was $22,030 in January 1984, showcasing a significant long-term increase of approximately 270% over four decades. This growth highlights the evolving economic landscape of New York, driven by shifts in industries, education levels, and overall cost of living.
Immigration in New York City
Metric
Value/Percentage
Total Immigrant Population
3.1 million (38% of NYC’s population)
Naturalized Citizens (of Foreign-Born)
Over 50%
Top Countries of Birth
Dominican Republic, China, Mexico
Undocumented Immigrant Population (2022)
Slight Increase After a Decade Decline
Languages Spoken by Foreign-Born Residents
200+
Common Languages Among Limited Proficiency
Spanish, Chinese, Russian, Bengali
- Immigrants comprise 38% of NYC’s population, with over half being naturalized citizens. This significant presence highlights New York City as a melting pot of global cultures and communities according to government sources.
- Dominant countries of birth include the Dominican Republic, China, and Mexico, showcasing the city’s strong ties to Latin America and Asia. Jamaicans, once a top-three group, now rank fourth.
- NYC immigrants contribute to linguistic diversity, with over 200 languages spoken. Spanish, Chinese (including Mandarin, Cantonese, and Fujianese), Russian, and Bengali are the most common languages among those with limited English proficiency.
- The undocumented immigrant population has seen a decade-long decline, with the largest decrease (54,000 residents) occurring between 2020 and 2021, influenced by COVID-19, economic challenges, and Title 42 policies. However, 2022 marked a slight rebound, hinting at potential stabilization.
Age Distribution by Immigration Status (2022)
Immigration Status
Average Age
Population Aged 18–64 (%)
Naturalized Citizens
56 years
Less than 85%
Lawful Permanent Residents (LPRs)
Younger
Over 85%
Nonimmigrants
Younger
Over 85%
Undocumented Immigrants
Younger
Over 85%
Immigrant populations, regardless of legal status, tend to be older than U.S.-born citizens, with naturalized citizens being the oldest group (average age of 56).
The majority of undocumented immigrants (over 85%) fall within the prime working-age bracket (18–64), emphasizing their significant role in the NYC labor force.
NYC Index Crime Statistics – December 2024 vs. December 2023
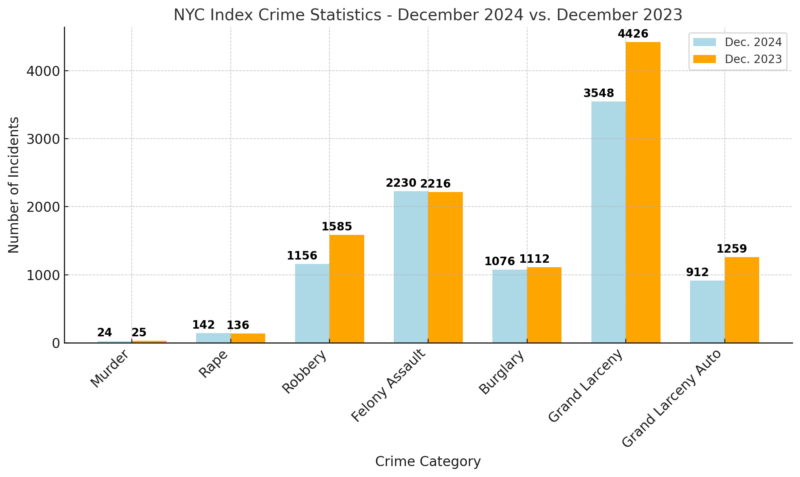
- December 2024 saw a significant reduction in overall index crimes (-15.5%), the largest one-month decrease since February 2021 according to NYC.GOV.
- Robbery (-27.1%), Grand Larceny (-19.8%), and Grand Larceny Auto (-27.6%) led the declines, reflecting effective law enforcement and crime prevention strategies.
- Rape (+4.4%) and Felony Assault (+0.6%) saw small increases, indicating areas where further preventive measures and community engagement may be needed.
- Precision policing and targeted interventions in high-crime areas contributed to this remarkable December decrease.
NYC Index Crime Statistics – End of Year 2024 vs. 2023
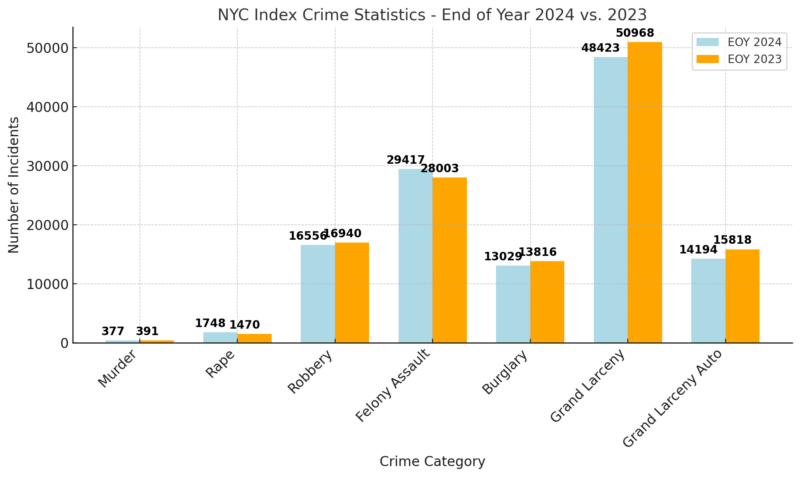
The overall index crime dropped by 2.9%, equating to 3,662 fewer incidents and thousands of fewer victims, reflecting sustained efforts in crime reduction.
Significant reductions were seen in Grand Larceny Auto (-10.3%), Burglary (-5.7%), and Grand Larceny (-5.0%).
Rape (+18.9%) and Felony Assault (+5.0%) increased notably, indicating a need for enhanced support for victims and strategic initiatives to address these crimes.
This consistent improvement highlights the NYPD’s focused crime prevention strategies and use of advanced technology to enhance public safety.
NYC Shooting Statistics – December and Full Year 2024-25
Metric
Dec. 2024
Dec. 2023
+/-
% Change
EOY 2024
EOY 2023
+/-
% Change
Shooting Incidents
61
72
-11
-15.3%
903
974
-71
-7.3%
Shooting Victims
78
90
-12
-13.3%
1,102
1,150
-48
-4.2%
Illegal Firearms Recovered
N/A
N/A
N/A
N/A
6,150
N/A
N/A
N/A
- Shooting Incidents: A 15.3% drop in shooting incidents in December 2024 compared to the previous year, and a 7.3% annual reduction, demonstrate the success of targeted efforts against gun violence.
- Victim Reduction: Shooting victims also decreased by 4.2% for the year, reflecting fewer individuals harmed due to violent crimes.
- Firearm Seizures: NYPD recovered over 6,150 illegal firearms, highlighting proactive measures to disarm criminals and prevent violence.
- Strategic Focus: These improvements can be attributed to precision policing, advanced technology, and increased patrol presence in high-crime areas.
Arrests for Major Index Crimes (2024)
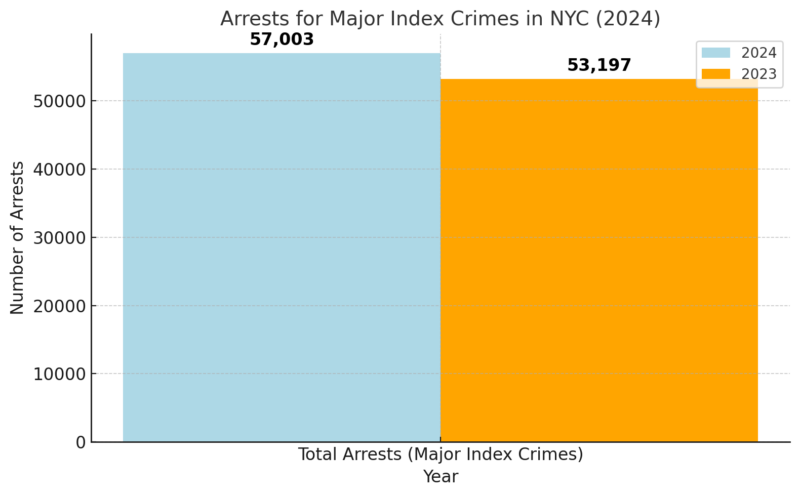
A 7.2% rise in arrests for major index crimes indicates the NYPD’s commitment to addressing criminal activities and holding offenders accountable.
Despite the success in arrests, challenges related to recidivism remain a concern, as emphasized by Police Commissioner Tisch. Addressing this issue through policy changes could enhance crime reduction efforts.
Methodology
This article was crafted using a combination of publicly available data from government sources, including the U.S. Census, NYC.GOV, the Federal Reserve, and NYC economic reports. We analyzed trends in population, employment, crime, housing, and immigration statistics over multiple years.
Data was summarized in tables for clarity and cross-referenced for accuracy. Key insights were derived from year-over-year comparisons and long-term historical trends. The article integrates expert commentary and official statements to contextualize findings. Statistical tools and reports from reputable agencies ensured reliability and relevance.
References
- World Population Review – New York Population
- Baruch College NYC Data – Age Distribution
- NYC Comptroller – Spotlight: NYC’s Homeowner Housing Market
- U.S. Census – Quick Facts for NYC
- NYC Economics – NYC Employment Summary
- Trading Economics – Median Household Income in New York
- NYC.gov – Crime Statistics 2024
- NYC Mayor’s Office of Immigrant Affairs – Annual Report 2023
Related Posts:
- Map of New York City, New York – Geography,…
- Louisiana Population Data in 2025 - Key Trends and Forecasts
- North Dakota’s Population Data in 2025 - Key…
- Map of the City of Albany, New York – Geography,…
- New York State Population - 2025 Growth, Decline,…
- New York’s Population Could Drop by Almost 3 Million by 2050


