
The population of North Carolina in 2025 is estimated to be approximately 10,975,000, reflecting a healthy growth rate of 1.13%, ranking 14th in the nation for population growth. The state has shown consistent and substantial growth over the years according to the World Population Review.
For context, during the 2010 U.S. Census, North Carolina’s population was reported at 9,535,483, marking an 18.5% increase from the 2000 census figures.
Several states, including Virginia to the north, South Carolina and Georgia to the south, and Tennessee to the west. Additionally, its eastern boundary meets the Atlantic Ocean, providing a mix of coastal and inland population dynamics.
Key Takeaways
Population Density, and Urban Growth
North Carolina’s population growth is spreading out across the state beyond the larger cities. https://t.co/JY7Pi1ljIz
— Triangle Business Journal (@TriangleBIZJrnl) January 4, 2025
Located on the East Coast of the United States, North Carolina ranks as the 28th largest state by area but stands out for its relatively high population density. Despite its modest size, the state’s population density positions it as the 15th most densely populated state in the nation.
- Total Area: 53,819 square miles (139,390 square kilometers)
- Population Density: 196 people per square mile
North Carolina’s urban areas significantly contribute to this density. As of 2016, the state hosts three major Combined Statistical Areas (CSAs) with populations exceeding 1.6 million:
- Metrolina (Charlotte – Gastonia – Salisbury, NC-SC): Population 2.38 million
- The Triangle (Raleigh – Durham – Chapel Hill, NC): Population 1.8 million
- The Triad (Greensboro – Winston-Salem – High Point, NC): Population 1.5 million
Charlotte is the largest city in the state, with a population of 827,097. Over the last three decades, North Carolina has transitioned from a historically rural area to a more urbanized state. Today, the majority of its residents live in urban or suburban regions.
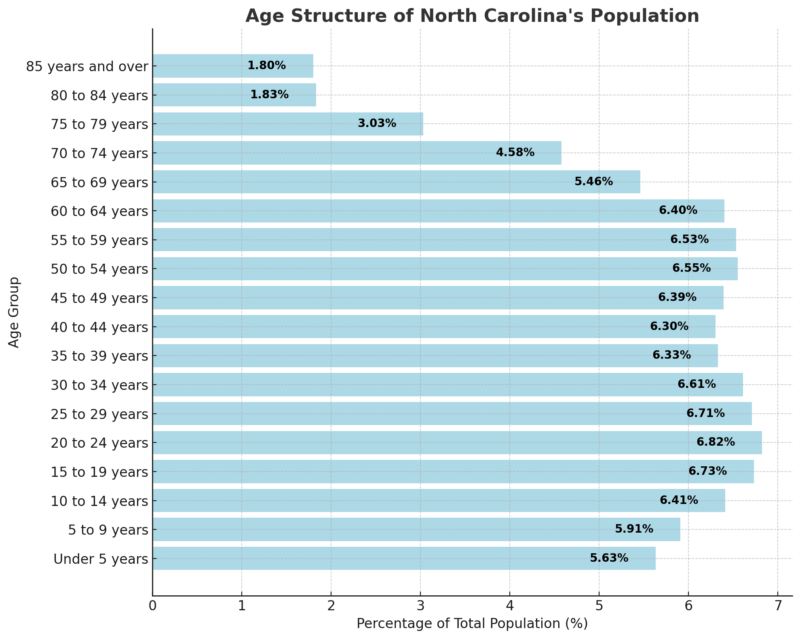
Age Structure
According to the 2018–2022 ACS 5-Year Estimates, the median age in North Carolina is 39.1 years. The population distribution by age group is as follows:
Population Pyramid Statistics for North Carolina
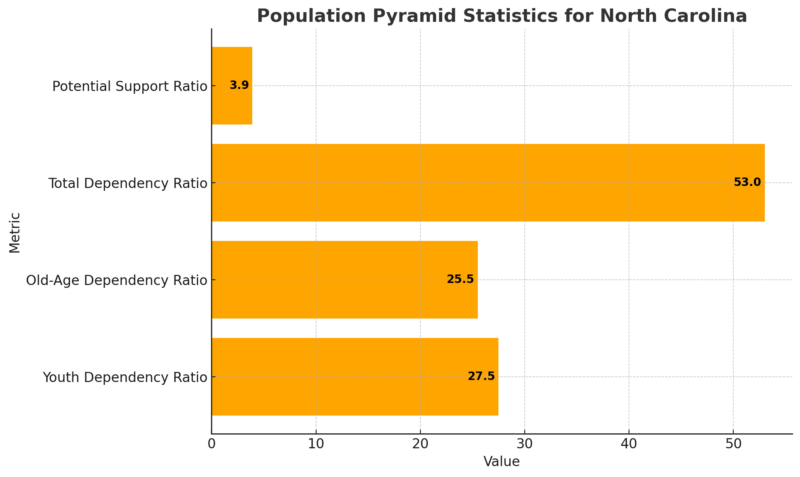
The population pyramid of North Carolina reveals key demographic trends:
- A youth dependency ratio of 27.5 indicates that for every 100 individuals of working age (15–64), there are approximately 27.5 children aged 0–14, suggesting a moderate level of youth dependency.
- An old-age dependency ratio of 25.5 highlights that for every 100 working-age individuals, there are about 25.5 elderly people (65+), pointing to a significant aging population.
- The total dependency ratio of 53.0 reflects the combined dependency burden, indicating that there are about 53 dependents (youth and elderly) for every 100 working-age individuals.
- The potential support ratio of 3.9 suggests there are approximately 3.9 working-age individuals for every elderly person, highlighting the workforce’s capacity to support the aging population.
Race and Ethnicity
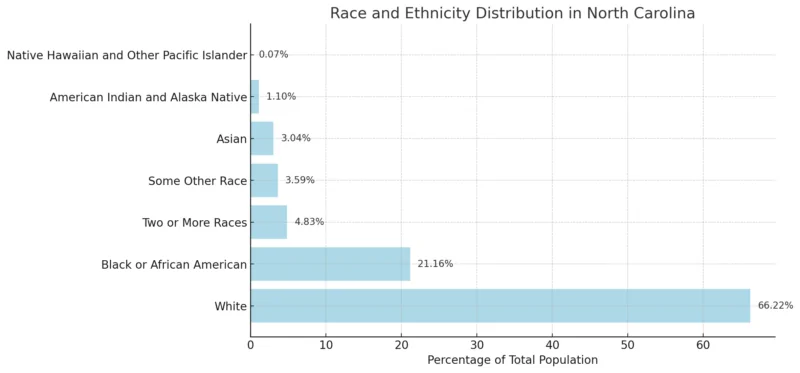
The largest racial group in North Carolina is White, making up 66.22% of the population according to the Neilsberg article.
The Black or African American population accounts for 21.16%, making it the second-largest racial group.
Smaller but notable segments include Two or More Races (4.83%), Asian (3.04%), and Some Other Race (3.59%).
The American Indian and Alaska Native population comprises 1.10%, while the Native Hawaiian and Other Pacific Islander group is the smallest, at 0.07%.
Migration Patterns
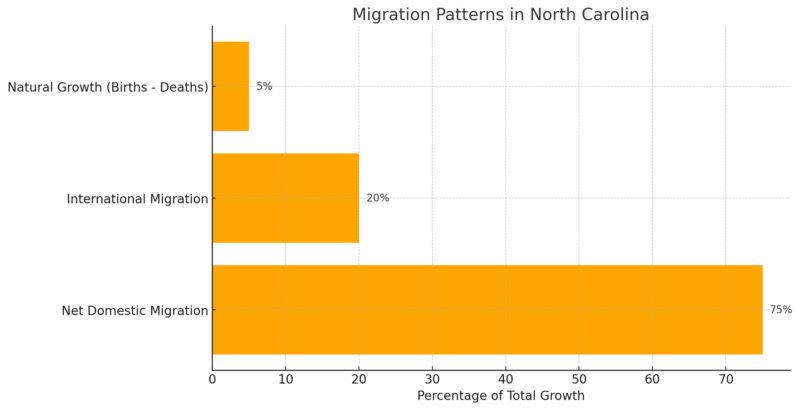
North Carolina experienced significant population growth between July 2021 and July 2022, driven by a combination of domestic migration, international migration, and natural growth. The state added a total of 133,088 new residents during this period, marking a growth rate of 1.3%, which is among the fastest in the United States according to government sources.
Net domestic migration was the largest contributor, with nearly 100,000 residents relocating from other states. This accounted for 75% of the total population growth and reflects the state’s strong appeal due to its business climate, affordable living, and quality of life.
International migration also played a significant role, adding 26,000 new residents, which more than doubled the previous year’s figure.
This indicates a return to pre-pandemic migration levels as global travel and movement resumed. Natural population growth, with around 6,000 more births than deaths, contributed modestly to the total increase.
Population Projections
View this post on Instagram
North Carolina is positioned to become the seventh most populated state by the early 2030s. This projection is based on data indicating significant population growth reaching approximately 11.7 million by 2030. The state demographer’s projections use past census data to forecast trends reliably.
Mecklenburg and Wake Counties are particularly significant contributors to this growth, each with populations exceeding one million. The aging population, with a median age of about 38.3 years, continues to shape the demographics. This trend emphasizes a need for resources and services catering to different age groups.
Population By Counties 2024
County Name
Population
County Name
Population
Wake County
1,209,772
Mecklenburg County
1,183,327
Guilford County
553,275
Forsyth County
396,181
Durham County
340,492
Cumberland County
338,999
Buncombe County
278,012
Union County
263,732
Johnston County
249,008
Cabarrus County
244,123
New Hanover County
241,920
Gaston County
240,514
Onslow County
218,321
Iredell County
203,546
Alamance County
181,712
Davidson County
177,228
Pitt County
176,628
Brunswick County
167,020
Catawba County
166,123
Rowan County
153,649
Orange County
150,999
Randolph County
148,720
Harnett County
144,476
Henderson County
120,162
Wayne County
119,923
Robeson County
118,264
Moore County
108,305
Craven County
103,695
Cleveland County
102,103
Lincoln County
98,242
Nash County
97,282
Rockingham County
93,070
Burke County
88,704
Chatham County
83,309
Caldwell County
80,801
Wilson County
79,634
Franklin County
79,602
Surry County
71,442
Pender County
71,344
Carteret County
69,904
Lee County
68,575
Stanly County
67,167
Wilkes County
66,235
Rutherford County
66,069
Haywood County
63,323
Granville County
62,682
Sampson County
60,175
Lenoir County
55,291
Hoke County
55,201
Watauga County
54,483
Columbus County
50,167
Duplin County
50,106
Edgecombe County
49,275
Halifax County
46,885
Stokes County
45,928
Jackson County
45,226
Davie County
45,083
McDowell County
45,031
Beaufort County
44,562
Vance County
42,448
Richmond County
42,075
Pasquotank County
41,720
Person County
40,131
Macon County
38,855
Dare County
38,233
Yadkin County
38,041
Alexander County
36,630
Scotland County
34,402
Transylvania County
33,725
Currituck County
32,178
Cherokee County
30,459
Bladen County
29,577
Ashe County
27,064
Montgomery County
26,329
Caswell County
23,183
Madison County
22,261
Anson County
21,836
Martin County
21,416
Greene County
20,693
Polk County
20,108
Hertford County
19,272
Yancey County
19,108
Warren County
18,995
Avery County
17,581
Bertie County
16,776
Northampton County
16,603
Mitchell County
14,950
Swain County
13,896
Chowan County
13,884
Perquimans County
13,533
Pamlico County
12,612
Clay County
12,113
Alleghany County
11,491
Camden County
11,184
Washington County
10,650
Gates County
10,316
Jones County
9,583
Graham County
8,072
Hyde County
4,558
Tyrrell County
3,449
Employment Rates
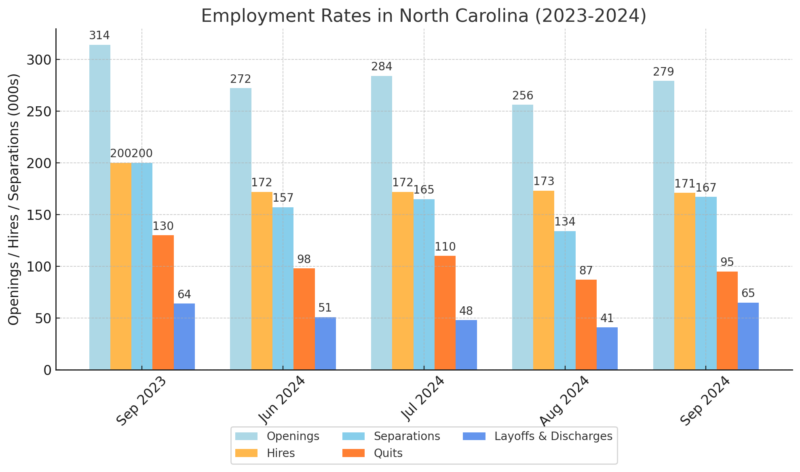
North Carolina saw a rise in job openings in September 2024, increasing by 23,000 positions from August, reaching 279,000.
Hires experienced a slight decline of 2,000, while total separations increased significantly by 33,000, driven by a sharp rise in layoffs and discharges (+24,000) according to the BLS.
Quits also rose by 8,000, indicating a higher voluntary turnover during the period.
Job Openings and Labor Turnover Rates for North Carolina (Seasonally Adjusted)
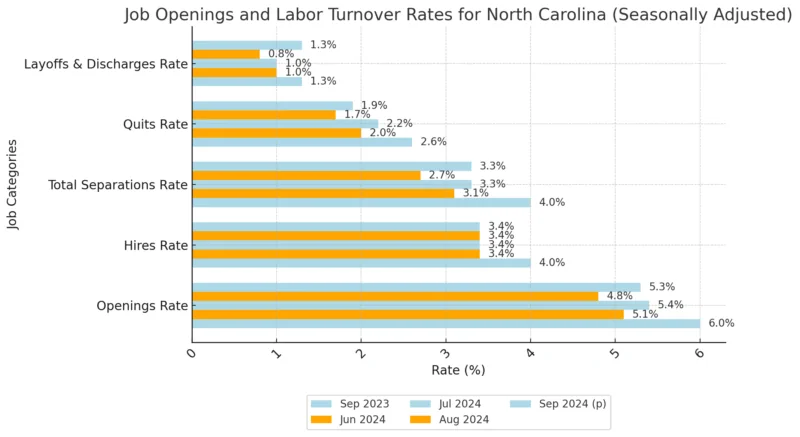
The job openings rate in North Carolina rebounded in September 2024, climbing to 5.3% from 4.8% in August.
The total separations rate also increased by 0.6 percentage points, reaching 3.3%, mainly due to a rise in layoffs and discharges, which saw a notable increase in their rate from 0.8% to 1.3%.
The quits rate showed a modest rise, reflecting slightly increased voluntary workforce mobility.
Job Openings and Labor Turnover Rates for the United States (Seasonally Adjusted)
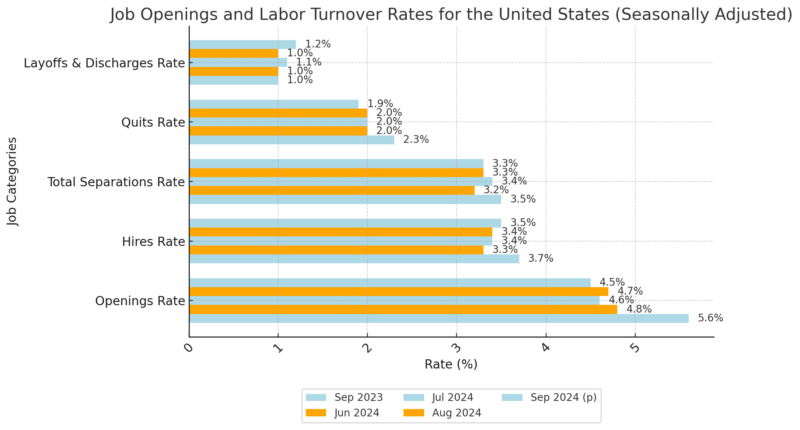
Nationally, the job openings rate fell slightly from 4.7% in August to 4.5% in September 2024. While the hires rate improved marginally, the quits rate dropped to 1.9%, indicating fewer voluntary job transitions.
Layoffs and discharges increased, pushing their rate up by 0.2 percentage points to 1.2%.
This reflects a mixed labor market at the national level, with fewer openings but slightly higher hiring activity.
Housing Market Trends
Metric
Value
Year-Over-Year Change
Median Sale Price
$374,000
+2.6%
# of Homes Sold
10,579
-2.5%
Median Days on Market
49 days
+10 days
The housing market in North Carolina shows moderate growth in home prices, with the median sale price increasing by 2.6% year-over-year to $374,000 according to Redfin.
However, the number of homes sold decreased by 2.5%, reflecting possible affordability concerns or buyer caution.
Median days on the market rose by 10 days, indicating homes are taking longer to sell compared to the previous year.
Top 10 Metros in North Carolina with Fastest-Growing Sales Prices
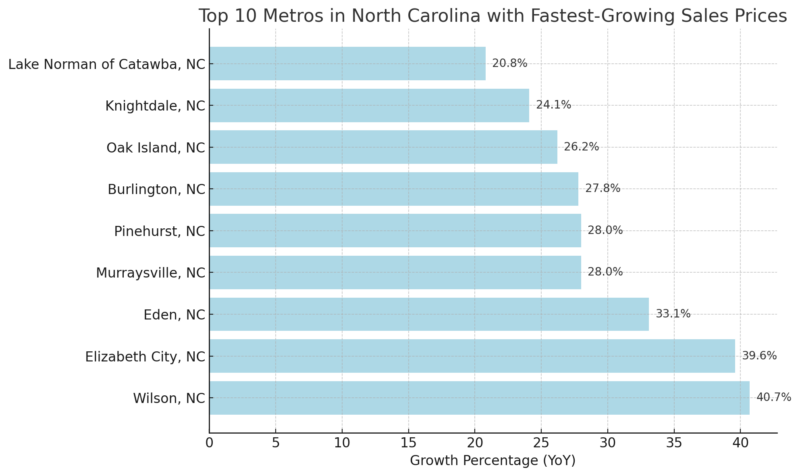
Metros such as Wilson, Elizabeth City, and Eden have seen the highest year-over-year growth in sales prices, with Wilson leading at 40.7%. These areas are experiencing significant demand, potentially driven by migration patterns, economic developments, or affordability compared to larger metro areas.
North Carolina Housing Supply
Metric
Value
Year-Over-Year Change
# of Homes for Sale
50,821
+15.7%
# of Newly Listed Homes
11,638
-2.1%
Months of Supply
4
No change
The number of homes for sale increased significantly by 15.7% year-over-year, reflecting an expanding housing inventory. However, the number of newly listed homes decreased by 2.1%, indicating that while the overall supply is growing, new listings are not keeping pace. The months of supply remain unchanged at 4, signaling a balanced market where neither buyers nor sellers dominate.
North Carolina Housing Demand
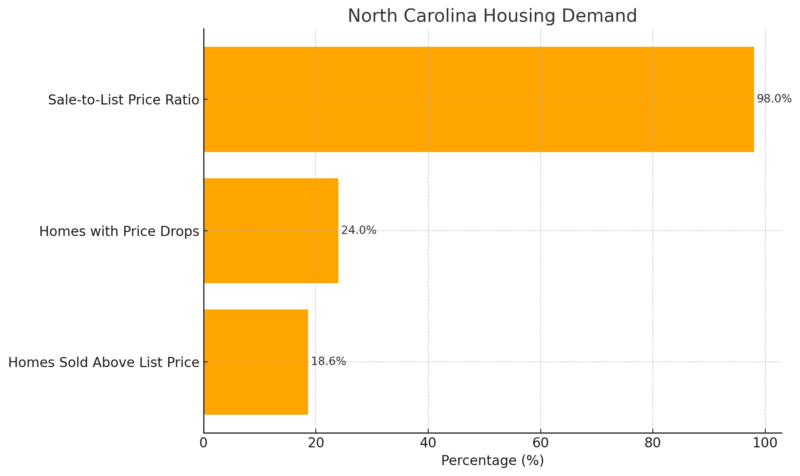
Demand in the North Carolina housing market is softening. Only 18.6% of homes sold above the list price, a decline of 5 percentage points year-over-year.
Homes with price drops rose to 24%, reflecting sellers adjusting expectations in response to market conditions. The sale-to-list price ratio dipped slightly to 98%, indicating homes are selling closer to their listed price but with minimal competition pushing prices higher.
Educational Attainment Levels
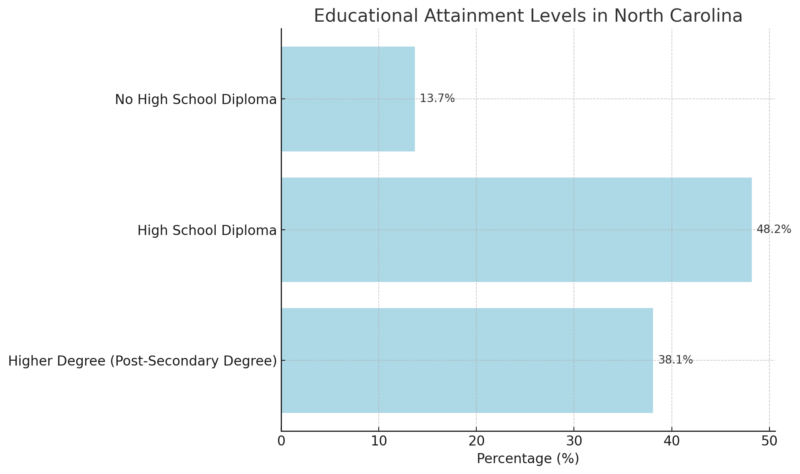
Statistical Atlas notes that among residents aged 25 years and older in North Carolina, nearly half (48.2%) hold a high school diploma as their highest level of education, while 38.1% have earned a post-secondary degree.
Approximately 13.7% of this population does not have a high school diploma.
This distribution highlights the prominence of secondary education attainment in the state, although there remains a notable portion without a high school diploma.
Income Levels
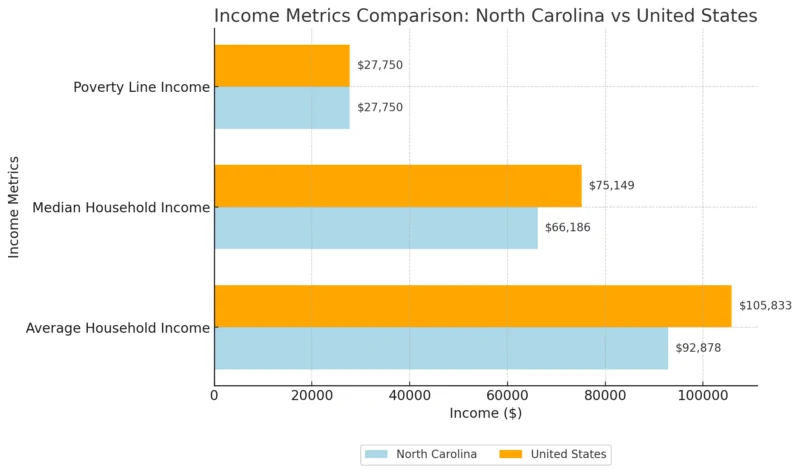
The average and median household incomes in North Carolina are 12% lower than the national averages, indicating a slightly less affluent population compared to the U.S. overall. However, the poverty threshold remains consistent with national standards.
Richest North Carolina Zip Codes
Rank
Zip Code
Population
Mean Income
Median Household Income
1
28207
9,461
$389,928
$217,656
2
27608
12,069
$213,819
$148,261
3
28211
32,050
$211,706
$119,805
4
28480
2,899
$185,809
$121,417
5
28173
62,501
$184,488
$144,544
6
28036
21,492
$184,234
$133,676
7
28226
38,475
$184,053
$116,220
8
27519
66,046
$181,530
$154,632
9
27310
8,571
$176,544
$154,750
10
28031
30,324
$175,817
$111,823
Income By Zip Code notes that the wealthiest zip code in North Carolina is 28207, with an average household income of $389,928 and a median household income of $217,656. Many of the richest zip codes are located in major metropolitan areas or affluent suburbs, reflecting concentrated wealth in these regions.
North Carolina Salary Data
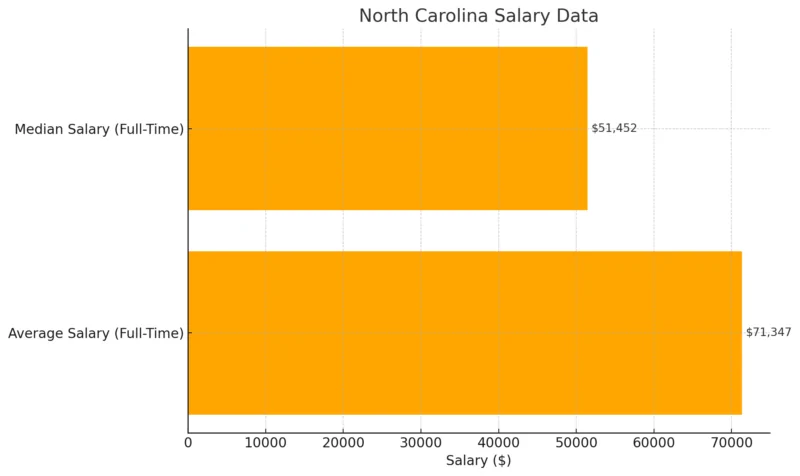
Full-time workers in North Carolina earn an average salary of $71,347, while the median salary is significantly lower at $51,452. The gap between the average and median reflects the influence of higher earners skewing the average upward.
North Carolina Individual Incomes
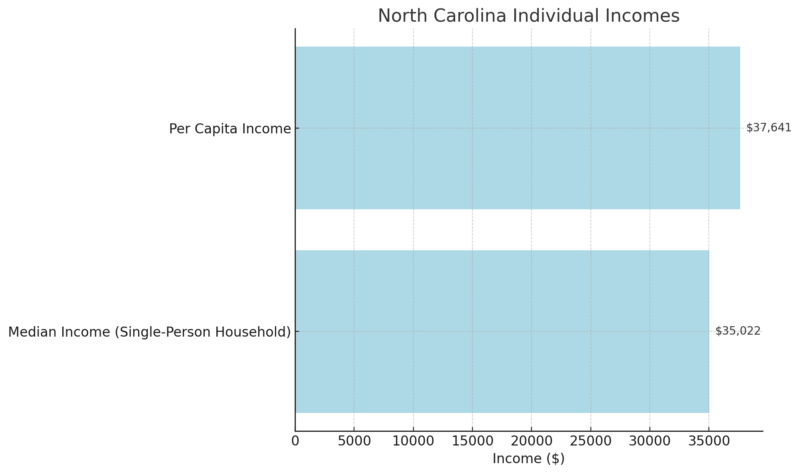
The median income for single-person households in North Carolina is $35,022, slightly below the per capita income of $37,641. The relatively low figures for individual incomes reflect North Carolina’s broader income distribution and a significant portion of the population earning below-average wages.
Methodology
- Data for population, migration, and housing trends were sourced from government reports like the U.S. Census and BLS.
- Income and salary data were obtained from the 2022 ACS 5-Year Estimates and supplemental state reports.
- Educational attainment and racial demographics were analyzed using statistical atlas summaries.
- Zip code income statistics were pulled from the latest census datasets to ensure regional accuracy.
- Housing trends were examined using Redfin market analyses for November 2024.
- All data were cross-referenced for consistency and summarized for easy comprehension.
References
- World Population Review – North Carolina Population 2024
- Statistical Atlas – Educational Attainment in North Carolina
- Neilsberg – North Carolina Population by Age
- Neilsberg – North Carolina Population by Race
- NC Office of State Budget and Management – NC to Become 7th Most Populated State by Early 2030s
- BLS Southeast News Release – Job Openings and Labor Turnover in North Carolina
- Redfin – North Carolina Housing Market
- Income by Zip Code – Richest Zip Codes in North Carolina