According to the World Population Review, North Dakota’s population reached 788,940 in 2025, marking steady progress in its demographic expansion.
In the census 2020, it had 779,094 residents.
Between 2010 and 2020, North Dakota experienced a significant increase of more than 106,000 residents, a trend expected to continue.
Projections suggest that North Dakota could see its population climb to 831,543 by the year 2030, underscoring the potential for economic and infrastructural development within the state.
The growth can be attributed to various factors, including economic opportunities and improving quality of life in the state as much as over the entire country.
Analysts and policymakers are taking note, preparing to accommodate and leverage this increase for sustained prosperity.
Key Takeaways
Population Growth Trends
Between 2010 and 2022, the state experienced growth nearly every year, with the most significant increase of 3% occurring between 2012 and 2013.
This growth has been driven by economic opportunities, particularly in the energy sector, which attracted new residents from various regions.
As of 2023, North Dakota’s population reached approximately 783,926.
Cass County notably led in population growth, with a gain of 3,649 residents since the previous year.
Despite a slight decline between 2020 and 2021, the state continues to show resilience in its growth pattern, indicating a strong regional economic health and continued interest in its job market.
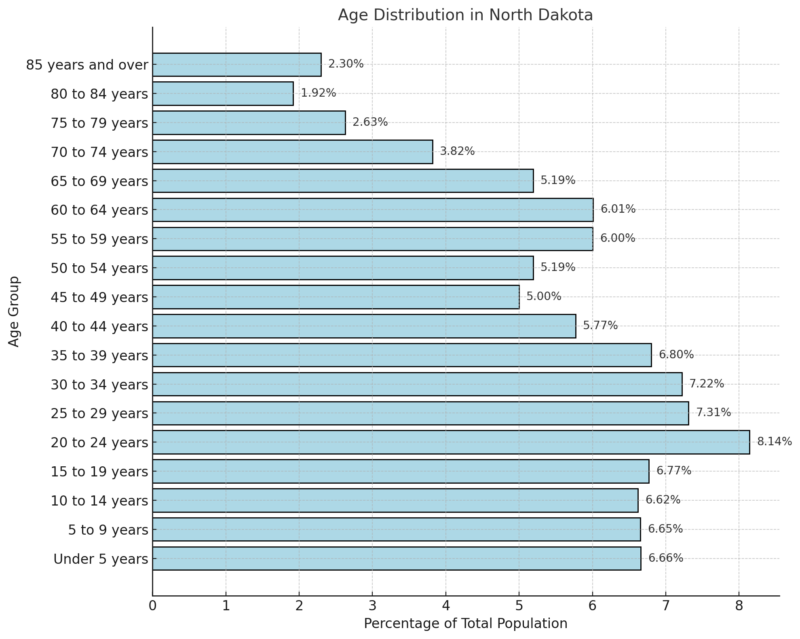
Age Distribution
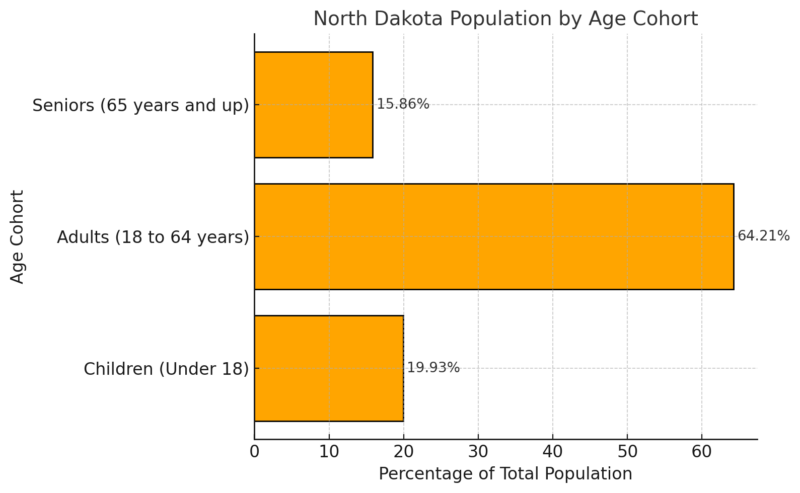
North Dakota Population by Age Cohort
The largest age group in North Dakota is 20 to 24 years, representing 8.14% of the population.
This young adult segment indicates a substantial portion of the population in early adulthood, contributing to a relatively low median age of 35.4 according to Neilsberg.
The high proportion of younger individuals may reflect North Dakota’s economic opportunities, particularly in sectors attracting young workers, such as energy or technology.
In comparison, Montana’s population age distribution reveals a median age of 40.1, highlighting an older demographic structure.
In contrast, the age group with the smallest representation is 80 to 84 years, accounting for only 1.92% of the population.
This trend is consistent with broader national patterns, where older age brackets naturally have smaller populations due to life expectancy limitations.
The population divided by cohort shows that the adult working-age group (18 to 64) dominates, encompassing 64.21% of the total. Children under 18 make up 19.93%, while seniors 65 and older account for 15.86%.
This distribution suggests a workforce-centered population, with significant implications for state resources, such as educational needs for children and healthcare services for seniors.
Median Age by Gender
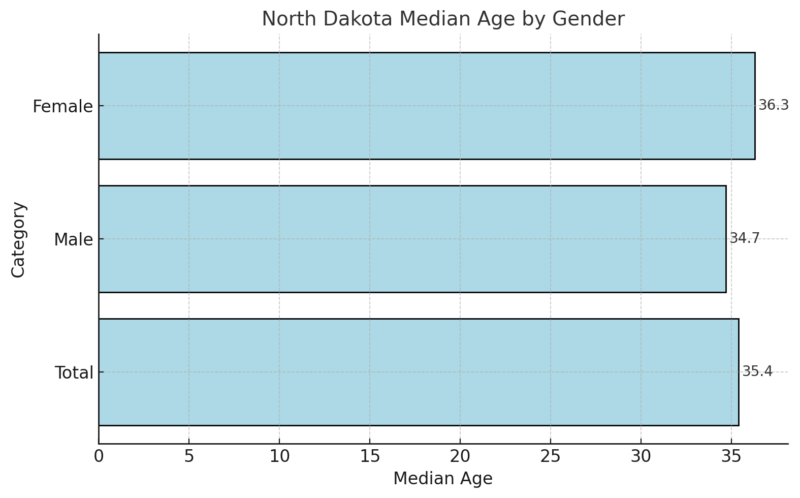
The median age in North Dakota is 35.4, with males slightly younger at 34.7 and females at 36.3.
This slight age difference indicates that, on average, women in North Dakota are slightly older than men, which is a common demographic trend observed in many regions due to differences in life expectancy and population distribution.
North Dakota Adult Population
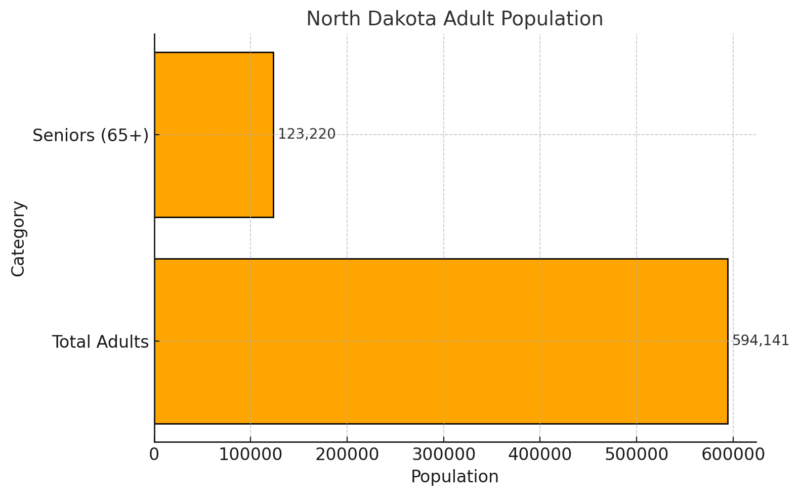
North Dakota’s adult population totals 594,141, of which 123,220 are seniors aged 65 and above.
This means that approximately 20.7% of the adult population consists of seniors, indicating a significant portion of older adults who may increasingly rely on healthcare and retirement resources as they age.
Age Dependency Ratios
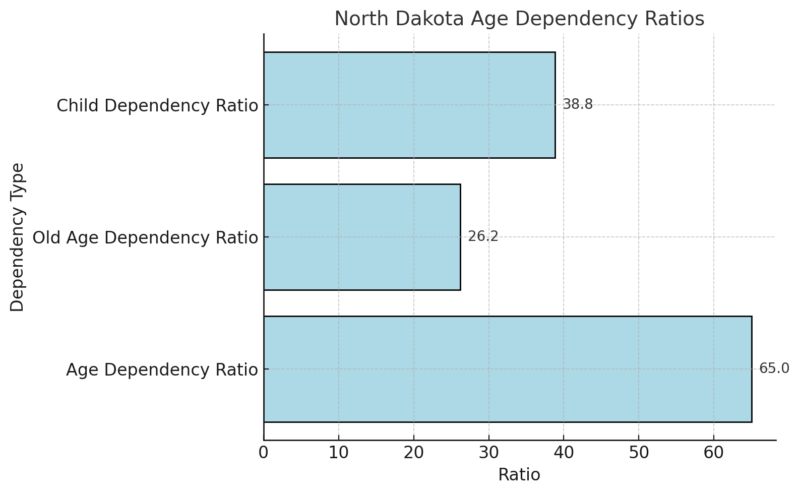
The overall age dependency ratio in North Dakota is 65, meaning there are 65 dependents (children and seniors) for every 100 working-age adults.
The child dependency ratio is 38.8, showing a relatively large proportion of younger dependents, while the old-age dependency ratio is 26.2, which indicates a smaller but notable group of elderly dependents.
This ratio is vital for understanding the demands on the working-age population to support both younger and older dependents.
Sex Ratio
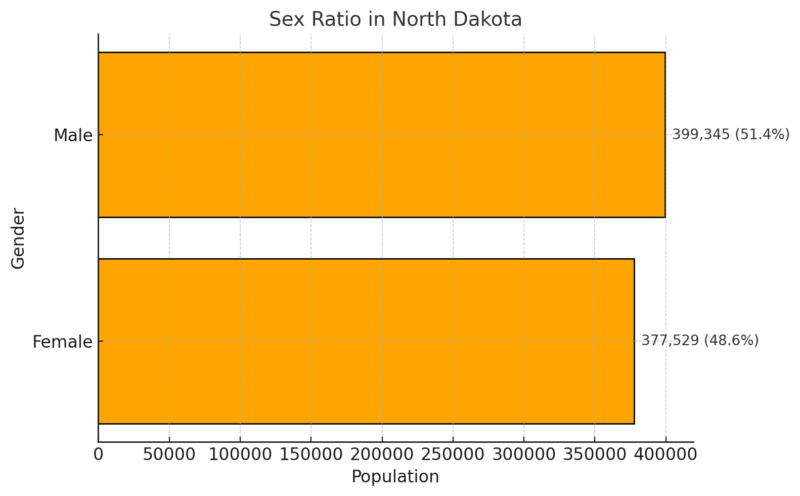
The sex ratio in North Dakota shows a slight male majority, with males making up 51.4% of the population and females 48.6%.
This male-to-female distribution aligns with North Dakota’s demographics, potentially influenced by the state’s industries, such as energy and agriculture, which traditionally attract a larger male workforce.
Population by County
County
Population
% Growth Rate
Area (sq. mi)
Cass County
200,011
8.19%
681
Burleigh County
100,628
2.06%
630
Grand Forks County
72,995
-0.2%
554
Ward County
67,876
-2.92%
777
Williams County
40,260
-2.24%
802
Morton County
34,085
2.31%
743
Stark County
33,284
-1.62%
515
Stutsman County
21,308
-1.08%
858
Richland County
16,542
0.05%
554
McKenzie County
14,615
-1.09%
1,100
Rolette County
11,589
-4.95%
349
Ramsey County
11,410
-1.4%
457
Barnes County
10,691
-1.47%
576
Walsh County
10,150
-3.6%
495
McLean County
9,806
0.41%
814
Mountrail County
9,525
-2.69%
704
Mercer County
8,291
-0.67%
403
Traill County
7,861
-1.58%
333
Pembina County
6,577
-3.82%
432
Bottineau County
6,314
-1.16%
644
Benson County
5,718
-3.66%
536
Ransom County
5,559
-2.34%
333
McHenry County
5,067
-4.97%
723
Dickey County
4,872
-1.95%
437
LaMoure County
4,116
0.37%
442
Dunn County
4,044
-1.32%
775
Pierce County
3,873
-2.74%
393
Wells County
3,830
-3.58%
491
Sargent County
3,748
-2.09%
331
Sioux County
3,600
-7.22%
422
Cavalier County
3,584
-3.24%
575
Foster County
3,238
-4.4%
245
Emmons County
3,194
-2.8%
582
Nelson County
2,983
-0.37%
379
Bowman County
2,835
-4.87%
449
McIntosh County
2,481
-1.43%
376
Hettinger County
2,419
-1.95%
437
Renville County
2,308
1.5%
339
Kidder County
2,303
-3.32%
521
Griggs County
2,247
-1.92%
274
Eddy County
2,219
-4.52%
243
Adams County
2,193
-0.09%
381
Grant County
2,192
-4.11%
640
Burke County
2,136
-2.64%
426
Divide County
2,101
-4.72%
487
Towner County
2,000
-6.85%
396
Logan County
1,900
0.8%
383
Oliver County
1,896
1.44%
279
Steele County
1,771
-1.28%
275
Golden Valley County
1,740
1.1%
386
Sheridan County
1,246
-1.03%
375
Billings County
1,043
11.79%
443
Slope County
666
-5.26%
469
Counties by Population
County
Population
% Growth Rate
Area (sq. mi)
Cass County
200,011
8.19%
681
Burleigh County
100,628
2.06%
630
Grand Forks County
72,995
-0.2%
554
Ward County
67,876
-2.92%
777
Williams County
40,260
-2.24%
802
Morton County
34,085
2.31%
743
Stark County
33,284
-1.62%
515
Stutsman County
21,308
-1.08%
858
Richland County
16,542
0.05%
554
McKenzie County
14,615
-1.09%
1,100
Cass County is the most populous county in North Dakota, with 200,011 residents, accounting for about 23.88% of the state’s total population.
Cass County includes Fargo, North Dakota’s most populous city, which alone represents approximately 17% of the state population.
Burleigh County, home to Bismarck (the state capital), is the second-most populous county with 100,628 residents.
Meanwhile, Grand Forks County, housing the city of Grand Forks, is the third most populous but shows a slight population decrease.
North Dakota Counties with the Fewest Residents
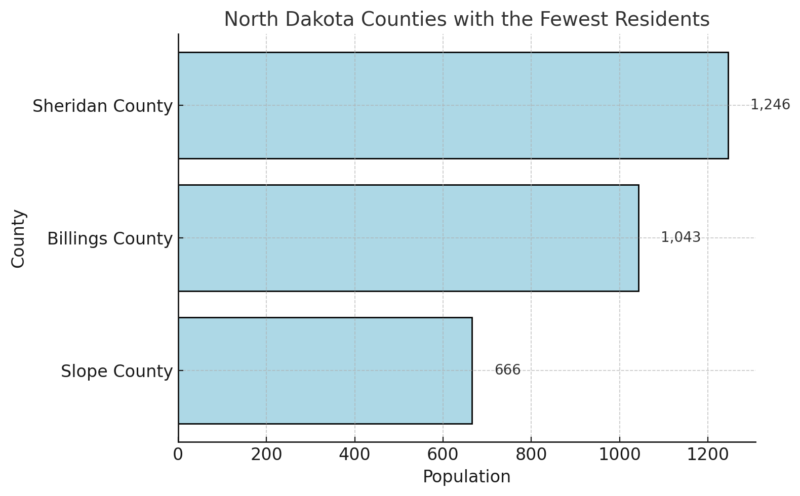
Slope County, with only 666 residents, is the least populous county in North Dakota, with an exceptionally low population density of 0.63 persons per square mile, reflecting its rural nature.
Billings County, with 1,043 residents, follows closely with a density of 0.80 persons per square mile.
Together, Slope and Billings counties account for just 0.22% of North Dakota’s total population, underscoring the sparse population spread in these rural areas.
Sheridan County is the third least populous, with a slightly higher density but still under 1,300 residents.
North Dakota Counties with Rapid Population Growth (Since 2010)
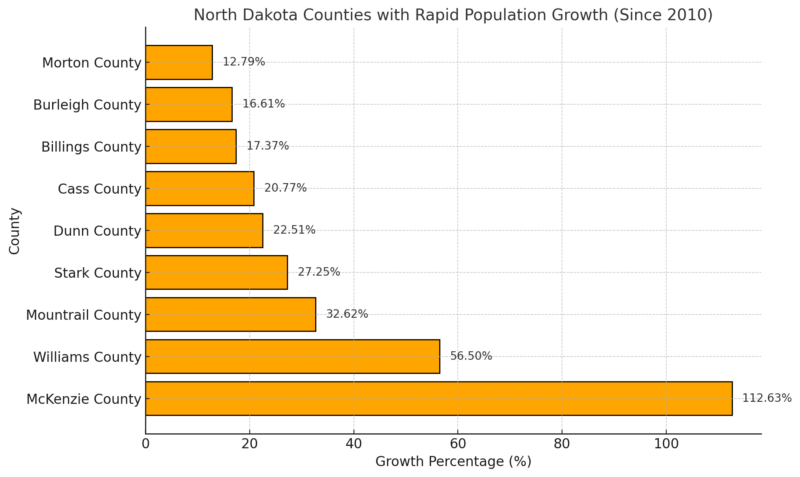
McKenzie County has experienced remarkable growth since 2010, with a population increase of 112.63%.
This explosive growth is likely driven by the oil and energy industries, which attract workers and families to the area.
Williams County, with a 56.50% growth rate, and Mountrail County, with a 32.62% increase, also show significant growth due to similar economic influences.
Counties with substantial, though comparatively smaller, growth include Cass County (20.77%) and Burleigh County (16.61%), showing that both urban and resource-rich areas have benefited from recent population increases.
Ethnic and Racial Composition
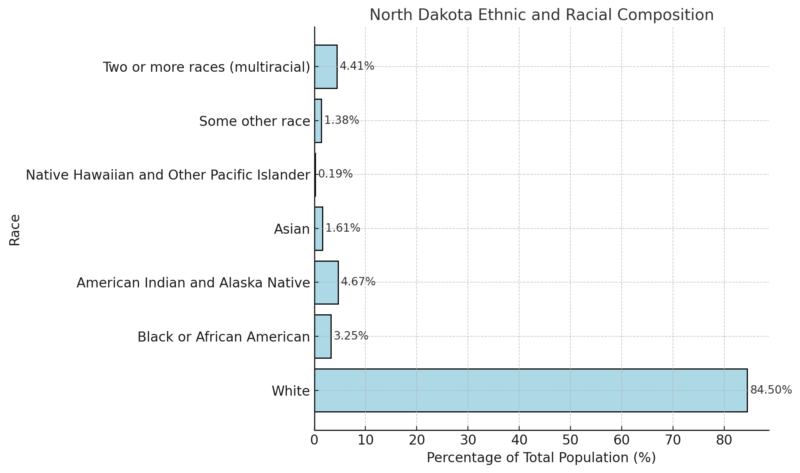
Neilsberg notes that North Dakota’s racial composition is predominantly White, with 84.50% of the population identifying as such.
However, the state shows significant racial diversity, with American Indian and Alaska Native residents comprising 4.67% of the population, reflecting the state’s historical and cultural connections with Indigenous communities.
Multiracial individuals make up 4.41%, while Black or African American residents account for 3.25%, indicating a smaller but present population in the state.
Asians represent 1.61%, and Native Hawaiian and Pacific Islander residents make up 0.19%.
The “some other race” category, comprising 1.38%, shows that North Dakota’s population includes a mix of other ethnicities, contributing to the state’s evolving diversity profile.
Income Statistics for 2025
Income Category
North Dakota Income
US Income
% Difference from US Average
Average Household Income
$97,221
$105,833
-8%
Median Household Income
$73,959
$75,149
-2%
Poverty Threshold
$27,750
$27,750
–
North Dakota’s average household income is $97,221, which is 8% lower than the national average of $105,833.
The median household income is also slightly below the national median, at $73,959 compared to the US median of $75,149 according to incomebyzipcode.
These figures indicate that while North Dakota’s household income levels are slightly below national averages, they remain competitive given the state’s lower cost of living relative to other regions in the US.
How much money North Dakotans need to ‘live comfortably’ https://t.co/LO737MPteA
— KX News (@KXMB) November 26, 2024
Richest Zip Codes in North Dakota (2025)
Rank
Zip Code
Population
Mean Income
Median Household Income
1
58047
4,427
$183,970
$148,833
2
58042
1,291
$176,377
$135,547
3
58843
951
$159,569
$135,509
4
58005
892
$147,606
$137,222
5
58835
904
$139,398
$129,545
6
58030
662
$136,505
$70,469
7
58521
705
$135,582
$128,048
8
58773
990
$135,174
$96,563
9
58051
1,866
$133,192
$115,875
10
58831
1,133
$132,751
$90,000
The wealthiest zip code in North Dakota is 58047, with an average household income of $183,970 and a median household income of $148,833.
These top zip codes reflect areas with significant income concentration, likely due to local economic factors and resources, such as proximity to urban centers or resource-driven industries.
Salary Data
| Category | Average Salary | Median Salary |
|---|---|---|
| Full-Time Workers | $72,016 | $56,345 |
The average salary for full-time workers in North Dakota is $72,016, while the median salary is $56,345.
This indicates that although the average salary is relatively high, the median salary is considerably lower, suggesting income disparities across different sectors or job roles.
Individual Incomes
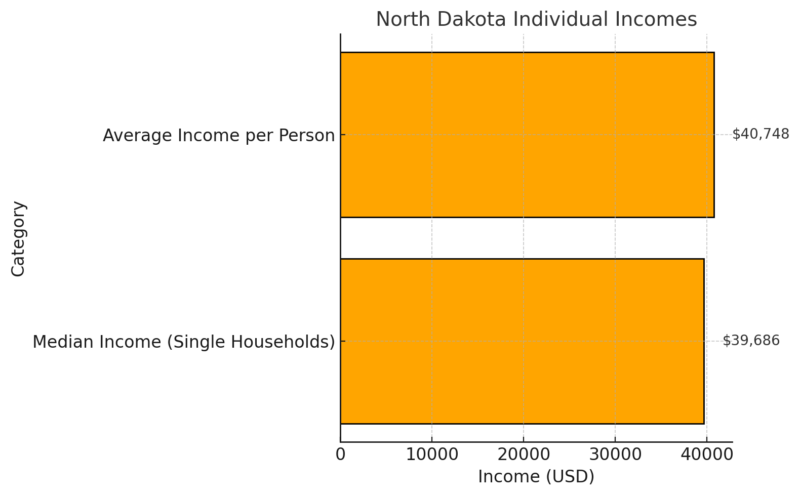
For single-person households, the median income is $39,686, and the per capita income is $40,748.
These figures highlight the economic situation of individuals who live alone, which tends to be lower than multi-person or family households, as single earners support all household expenses on a single income.
North Dakota Family Income Data
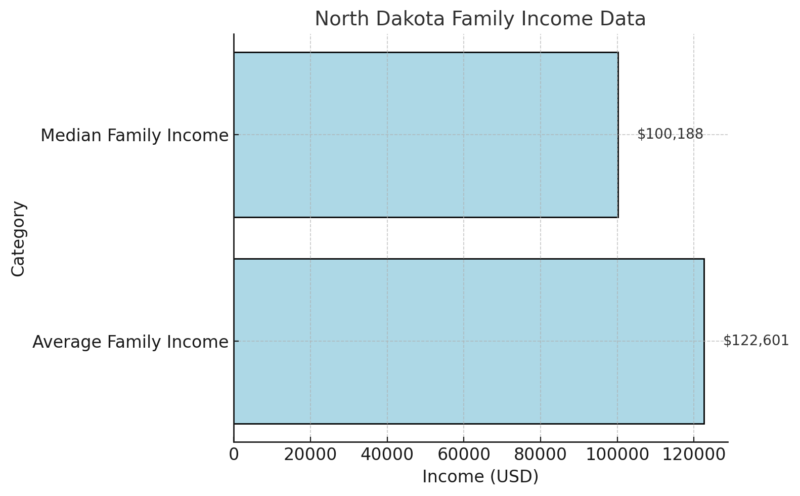
North Dakota families have an average income of $122,601, while the median family income is $100,188.
The higher average family income suggests some families have substantially high earnings, raising the average above the median.
Retirement Income
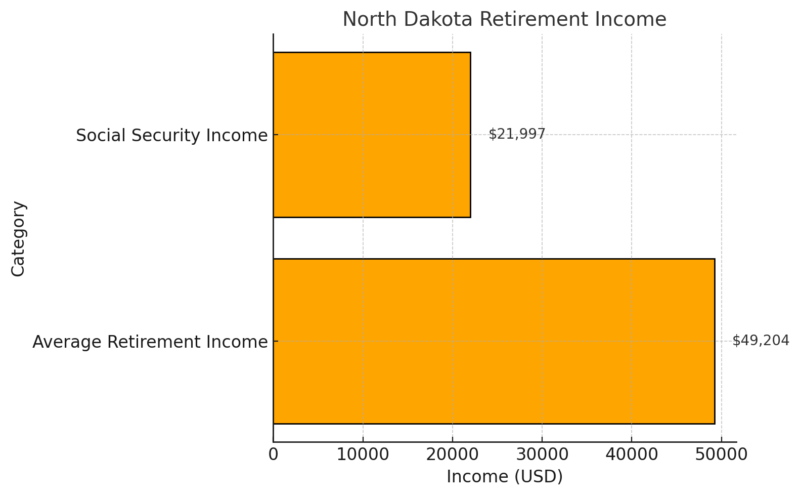
The average retirement income in North Dakota is $49,204, with $21,997 coming from Social Security.
This income reflects a combination of retirement savings, pensions, and other benefits, which are essential for supporting retirees in the state.
Education Attainment
Education Level
% of Population
Comparison to US Average
High school graduate or higher
94.5%
Higher than the US rate of 89.8%
Bachelor’s degree or higher
33.6%
About 90% of the US rate of 36.2%
Post-graduate degree
10%
Approximately two-thirds of the US rate of 14%
North Dakota’s high school graduation rate is strong, with 94.5% of the population aged 25 and over holding a high school diploma or equivalent, surpassing the national rate of 89.8%.
However, while 33.6% of North Dakotans hold a bachelor’s degree or higher, this is slightly below the US average of 36.2%.
View this post on Instagram
Similarly, the post-graduate degree attainment in North Dakota is 10%, lower than the national average of 14%.
These figures suggest that while basic educational attainment is high, the state trails somewhat in higher education, particularly at the postgraduate level.
Population by Highest Level of Education
In North Dakota, 5% of the adult population has not attained a high school diploma, indicating a relatively small segment lacking formal education.
The largest group, at 37%, comprises individuals with some college education but no degree, suggesting a common trend toward post-secondary education without completion.
About 23% hold a bachelor’s degree, while 10% have achieved a post-graduate degree.
This distribution highlights a strong emphasis on at least some college experience within the state, although fewer North Dakotans complete advanced degrees compared to national averages.
Real Estate Market Statistics
Metric
Value
Median Home Price (Single-Family)
$297,000
Median Home Value (12-Month Average)
$265,792
Properties in Foreclosure
44
Real Estate Owned (REO) Properties
3
Total Residential Properties
213,932
Total Commercial Properties
72,803
Average Home Age (Single-Family)
45 Years
Average Square Footage (Single-Family)
1,552 sq. ft.
Total Residential Sales YTD (2024)
3,568
Total Residential Sales (2023)
5,525
Homes Seriously Underwater (Q4 2024)
1.1%
Equity-Rich Homes (Q4 2024)
21.07%
Effective Property Tax Rate (2023)
1.01%
Total Foreclosure Filings YTD
233
As of September 2024, North Dakota’s real estate market shows a median home price for single-family homes of $297,000, while the median home value over the last 12 months sits slightly lower at $265,792, indicating some recent increases in property value.
ATTOMDATA notes that the state currently has 44 properties in foreclosure and 3 REO properties, suggesting a relatively low foreclosure rate given the total number of residential properties (213,932).
The average age of single-family homes is 45 years, with an average size of 1,552 square feet, reflecting North Dakota’s established housing stock. Sales data shows a total of 3,568 residential transactions year-to-date in 2024, with 5,525 sales recorded in 2023, indicating a steady market.
Financially, only 1.1% of homes are considered seriously underwater (where the mortgage balance exceeds the home’s value), while 21.07% of homes are equity-rich, meaning the owners have substantial equity in their property.
North Dakota’s effective property tax rate is relatively modest at 1.01%, which may contribute to the state’s housing affordability.
Total foreclosure filings year-to-date stand at 233, signaling a stable housing market with minimal distress.
Employment and Labor Markets
Dakota Labor Force Data (April – September 2024)
Month
Civilian Labor Force (in thousands)
Employment (in thousands)
Unemployment (in thousands)
Unemployment Rate (%)
April 2024
418.3
409.9
8.4
2.0%
May 2024
418.5
409.9
8.6
2.0%
June 2024
418.6
409.8
8.8
2.1%
July 2024
418.8
409.5
9.3
2.2%
August 2024
419.0
409.4
9.6
2.3%
Sept 2024 (p)
419.2
409.4
9.7
2.3%
North Dakota’s labor force data for 2024 shows a steady increase in the civilian labor force, from 418.3 thousand in April to 419.2 thousand by September. Employment numbers, however, show a slight decrease from 409.9 thousand in April and May to 409.4 thousand in August and September according to BLS.
Unemployment has gradually risen over this period, from 8.4 thousand in April to 9.7 thousand by September. Correspondingly, the unemployment rate increased from 2.0% in April to 2.3% in September. Despite this gradual rise, North Dakota’s unemployment rate remains low, indicating a relatively healthy job market with slight seasonal or economic shifts.
Impact of Migration
North Dakota’s immigrant past and present: A call for compassionate immigration reform @WorldRelief @MatthewSoerens @laura_e_finch @koobxwm https://t.co/Hmn5ABS1An via @NDMonitor
— Dave Jenkins (@MzeeDaveJenkins) November 1, 2024
Dave Jenkins’ commentary highlights North Dakota’s immigrant legacy and urges compassionate immigration reform.
Historically, North Dakota has had a strong immigrant presence, with nearly 80% of its population in 1915 being immigrants or their children.
Today, the state continues to diversify, especially with rapid Hispanic population growth, driven by economic opportunities, a low cost of living, and a family-friendly culture.
Jenkins joined 200 evangelical leaders in sending a letter to presidential candidates advocating for balanced immigration policies rooted in faith and North Dakota’s values.
This letter calls for respecting immigrants’ dignity, securing borders, and protecting family unity.
Jenkins emphasizes that immigrants contribute to North Dakota’s communities by filling essential jobs, succeeding in academics, and enriching local culture.
He calls on candidates to avoid divisive rhetoric and to support practical immigration reforms that honor these shared values and the contributions of immigrants.
Methodology
To craft this summary, data was gathered from reputable sources such as the U.S. Census Bureau, World Population Review, and ATTOMDATA, ensuring a comprehensive view of North Dakota’s demographics, economy, and real estate trends.
Key metrics, including population growth, income levels, age distribution, and housing statistics, were selected to provide an informative overview.
Data was organized into clear categories, focusing on growth patterns, economic health, and community demographics. Concise language was prioritized, emphasizing essential statistics and trends without superfluous details.
Finally, the information was reviewed for clarity, consistency, and alignment with the report’s objectives.
References
- World Population Review – North Dakota Population Review
- Census – North Dakota
- USAFacts – North Dakota Population and Demographic Trends
- North Dakota Compass – Data Highlight: North Dakota Population Estimates
- Neilsberg – North Dakota Population by Age
- Neilsberg – North Dakota Population by Race
- Income by Zip Code – North Dakota Income Statistics
- ATTOMDATA – North Dakota Real Estate Market Trends
- Bureau of Labor Statistics – North Dakota Employment Data
- North Dakota Monitor – North Dakota’s Immigrant Past and Present: A Call for Compassionate Immigration Reform